I. INTRODUCTION
The growth of group-III nitride semiconductors by metalorganic chemical vapor deposition (MOCVD) is of interest for power electronics used to develop efficient high power modules and inverters for hybrid and electric vehicle (HEV) systems. Reference Araujo, Kazanbas, Wendt, Kleeb and Zacharias1–Reference Kachi3 Currently, these systems primarily rely on Si-based power devices, such as insulated gate bipolar transistors and metal-oxide-semiconductor field effect transistors (MOSFETs), where the performance of these devices is limited by the inherit properties of the Si material. Reference Shen and Omura4 The main issue with high power modules is the large heat generation, resulting in poor high-temperature operation and thus requiring complex cooling systems. Reference Ning, Liang, Wang and Marlino5 Devices with high power operation and low on-resistance are essential for the future of inverters in HEVs. GaN is an attractive material for the use in power electronics due to its high electron mobility and high saturation velocity that can withstand high-temperature operation. Reference Mishra, Parikh and Wu6 Traditionally, GaN-based power electronics are lateral structures, where current flows from the source to the drain near the surface. Such lateral device structures suffer from dynamic on-resistance and current collapse due to surface states, limiting the device performance. Reference Binari, Klein and Kazior7,Reference Daumiller, Theron, Gaquiere, Vescan, Dietrich, Wieszt, Leier, Vetury, Mishra, Smorchkova, Keller, Nguyen and Kohn8 Furthermore, to increase the breakdown voltage in lateral devices necessary for high power modules in HEVs, an increase in the distance between the source and drain is needed, which leads to larger overall chip size. Reference Su, Chen, Chen, Esposto and Rajan9 Vertically conducting GaN-based power devices offers many advantages over lateral structures which are reaching their limits. Reference Chowdhury, Swenson, Wong and Mishra10,Reference Uesugi and Kachi11 In a vertical device, the current flows in all areas of the device, consequently, current collapse is suppressed which allows for better device operation. Reference Kachi3 In addition, the vertical device configuration is more effective in realizing low on-resistance and high breakdown voltages, achieving much higher power density over lateral device structures. However, the development of vertically conducting GaN-based power devices has been limited due to the absence of viable substrates. The fabrication of vertical GaN-based power devices has been reported on bulk GaN substrates (GaN on GaN), Reference Oka, Ueno, Ina and Hasegawa12,Reference Kanechika, Sugimoto, Soejima, Ueda, Ishiguro, Kodama, Hayashi, Itoh, Uesugi and Kachi13 however, bulk GaN substrates are still limited in terms of size, cost, and availability.
Vertically conducting GaN-based devices on SiC (GaN on SiC) is an alternative to GaN on GaN devices. The widespread availability of SiC has enabled the realization of high-frequency devices, i.e., AlGaN/GaN high-electron mobility transistors, operating at high power density, owing to its superior thermal conductivity that provides efficient pathways for heat dissipation. Reference Wu, Saxler, Moore, Smith, Sheppard, Chavarkar, Wisleder, Mishra and Parikh14–Reference Neudeck, Okojie and Chen16 Nonetheless, the heteroepitaxial growth of GaN on SiC by MOCVD is challenging. This arises from the large lattice and thermal expansion coefficient mismatch as well as the poor wetting behavior of GaN on the surface of SiC, which significantly impacts film quality. Reference Davis, Weeks, Bremser, Tanaka, Kern, Sitar, Ailey, Perry and Wang17 To overcome these challenges, AlN, which has a smaller lattice mismatch to SiC compared to GaN and improved wettability, is commonly used as a buffer layer for the epitaxy of GaN on SiC. However, due to the insulating nature of AlN (6.1 eV), a potential barrier is introduced at the GaN/SiC interface which inhibits current flow between the GaN film and substrate in vertical devices. As a result, there is significant interest in the direct growth of GaN on SiC. The MOCVD growth of high-quality GaN directly on SiC has been demonstrated using multistep growth processes to transition from a three-dimensional to a two-dimensional growth mode. Reference Lahrèche, Leroux, Laügt, Vaille, Beaumont and Gibart18–Reference Losurdo, Giangregorio, Bruno, Kim, Choi and Brown21 Despite the potential of this approach for vertical devices, there is limited information on the structural properties of GaN on SiC layers and the evolution of film stress in this growth process.
In this study, in situ optical reflectance and wafer curvature measurements were used to monitor the evolution of surface morphology and growth stress, respectively, during the MOCVD growth of GaN on SiC with and without an AlN buffer layer. The studies reveal significant differences in the stress state of the GaN during growth and the resulting surface morphology and microstructure of the films.
II. EXPERIMENTAL
The growth of GaN epilayers on n-type Si-face (0001) 6H-SiC was carried out in a customized vertical cold-wall MOCVD reactor using an inductively heated SiC-coated graphite susceptor. Prior to growth, the SiC substrates were cleaned using standard solvents followed by a 10:1 HF dip and high-temperature H2 etch at 1100 °C to ensure the removal of the native oxide from surface. To understand differences in growth stress, GaN growth was also carried out with an AlN buffer layer, in addition to the direct growth of GaN on SiC. The growth of the epilayers was performed under 100 Torr total pressure in H2 using trimethylaluminum (TMAl), trimethylgallium (TMGa), and ultra-high purity ammonia (NH3) gas for Al, Ga, and, N sources, respectively. For the direct growth of GaN on SiC, a two-step temperature growth process was utilized. The two-step GaN consisted of an initial (650 nm) low-temperature layer grown at 900 °C, followed by a thick (2.5 µm) main high-temperature layer of GaN grown at 1100 °C. The molar flow rates used for the initial low-temperature and main high-temperature GaN layers were fixed at 7.95 μmol/min and 62.50 mmol/min for TMGa and NH3, respectively. For the growth of GaN on SiC with a AlN buffer layer, 100 nm of AlN was first grown on SiC at 1100 °C with the molar flow rates of 13.80 μmol/min and 80.25 mmol/min for TMAl and NH3, respectively. Following the growth of AlN, a thick (2.5 µm) layer of GaN was grown at 1100 °C using the aforementioned molar flow rates used for the direct growth of GaN on SiC.
The MOCVD reactor was equipped with k-Space Associates multibeam optical stress sensor (MOSS). This in situ optical measurement technique allows the evaluation of film stress during growth. Reference Floro, Chason and Lee22 The MOSS system is based on laser reflectance and is used to monitor differential changes in the curvature of the SiC substrate. This is achieved by using an array of laser spots that are reflected off of the growing film surface, where the differential change in the spacing between laser spots corresponds to a change in the curvature in the substrate. This differential change can be related to the film stress-thickness product using a modified version of Stoney's equation. Reference Stoney23 Furthermore, oscillations in laser reflectance due to Fabry–Perot interferences during growth provide real-time monitoring of film thickness, morphological evolution, and surface roughness. High-resolution x-ray diffraction (HR-XRD) measurements were also used to investigate the crystallinity and determine the threading dislocation (TD) density of the GaN films using a Philips four-circle diffractometer with a Cu Kα 0.15406 nm radiation source. Raman spectra of the samples were collected using a WITec Confocal Raman system operated at room temperature with a 488 nm laser excitation source to evaluate the postgrowth residual stress of the GaN film. Tapping mode atomic force microscopy (AFM) was performed on the samples using a Bruker Dimension 3100 system (Billerica, MA) operated at a scan rate of 1.00 Hz. Transmission electron microscopy (TEM) analysis was performed on cross-sectional specimens using a JEOL 2010F field-emission TEM instrument (Peabody, MA) operated at 200 kV. Cross-sectional TEM specimens were prepared with focused ion beam (FIB) milling, using an in situ lift-out technique. First, a protective carbon layer was deposited over the region of interest by ion-beam deposition prior to cross-sectional milling. The starting FIB milling voltage was 30 kV to create a membrane of the cross-sectional specimen and thin to electron transparency. The final milling voltage was stepped down to 2 kV to further thin the specimens and minimize sidewall damage.
III. RESULTS AND DISCUSSION
The evolution of stress during the growth of III-nitride films is a complex process that depends on the interacting surface and growth conditions. With in situ optical reflectance and curvature measurements, both qualitative and quantitative understanding of the growth process and stress evolution, from the initial stages of nucleation and islanding through coalesce and lateral growth into continuous films, can be achieved. Differences in the growth mode evolution of GaN were observed when the film was grown directly on SiC compared to growth with an AlN buffer layer. This is evident from in situ optical reflectance versus thickness data, collected with MOSS during the growth of the main high-temperature GaN layer on 6H-SiC with an AlN buffer [Fig. 1(a)], and with an initial low-temperature GaN layer [Fig. 1(b)]. Oscillations in the reflectance versus thickness data provide information on the morphological evolution during the growth of GaN. Reference Koleske, Fischer, Allerman, Mitchell, Cross, Kurtz, Figiel, Fullmer and Breiland24,Reference Koleske, Coltrin, Cross, Mitchell and Allerman25 During growth, the intensity of the reflected laser beam off of the film surface can diminish as a result of surface roughing which scatters the laser light. Therefore, qualitative information on the density and aspect ratio of the GaN nuclei can be gleaned from a measurement of the intensity of the reflectance as a function of thickness. In addition, the time required for the laser intensity to recover following nucleation provides insight into the island coalescence process and the transition from a three-dimensional island growth mode to a two-dimensional step flow mode.
Reflectance versus thickness data collected during the growth of: (a) the high-temperature GaN layer grown on 6H-SiC with an AlN buffer layer, and (b) the high-temperature GaN layer grown on 6H-SiC with an initial low-temperature GaN layer (highlighting I and II growth stages). Stress-thickness versus thickness curves collected during the growth of: (c) the main high-temperature GaN layer grown on 6H-SiC with an AlN buffer layer, and (d) the main high-temperature GaN layer grown on 6H-SiC with an initial low-temperature GaN layer.

The reflected laser intensity as a function of layer thickness measured during the growth of the main high-temperature GaN layer is plotted in Figs. 1(a) and 1(b) for growth on the AlN buffer layer and the low-temperature GaN layer on SiC, respectively. In the case of the growth on an AlN buffer layer [Fig. 1(a)], the intensity of the reflected laser decreases only slightly at the start of the GaN growth and remains nearly constant throughout the growth process. This implies that during the initial growth of the main high-temperature GaN layer on the AlN buffer layer, rapid coalescence of the GaN nuclei occurs and two-dimensional step flow growth initiates during the early stages of the growth process. In contrast, the growth of the main high-temperature GaN layer on 6H-SiC consists of two stages when a low-temperature GaN layer is utilized. As seen from the reflectance versus thickness data of the high-temperature GaN layer in Fig. 1(b) (stage I), the reflected intensity diminishes initially and gradually recovers with increasing thickness. During the growth of the initial low-temperature GaN layer (not shown in Fig. 1), the intensity of the reflectance diminished without recovery due to incomplete coalescence of the truncated GaN islands and surface roughness that arise from the poor wettability of GaN on SiC. Therefore, the prolonged recovery of the reflectance during the nucleation of the high-temperature GaN layer [Fig. 1(b)] implies an initial low density of GaN nuclei that eventually form into large islands. Initially, the incomplete coalescence of the GaN nuclei leads to the observed low intensity in the reflectance. These islands laterally overgrow and coalesce with the increasing growth time. When the GaN islands coalescence, the reflectance begins to recover. Once the reflectance saturates, as seen in Fig. 1(b) (state II), two-dimensional step flow growth commences and continues with increasing thickness.
The initial stages of island coalescence impact the stress evolution during the growth process. The growth of the initial low-temperature GaN layer on SiC leads to the formation of large truncated islands as a result of the poor wettability of GaN on the surface of SiC. Therefore, a two-step temperature growth process is utilized to overcome the challenge of the coalescence of islands into a continuous film. In the other case, the observation of the rapid coalescence of GaN on the AlN buffer layer comes from the improved wettability of GaN on the surface of AlN. This leads to a high nucleation density of GaN, as well as a reduction in the lattice mismatch (∼2.4%). In addition, the morphological evolution (from three-dimensional growth to two-dimensional step flow) that results from the coalescence of the islands into a film, creates a transition point in the evolution of the film stress. This is clearly evident in the stress-thickness versus thickness curves in Figs. 1(c) and 1(d) collected during the growth process with the MOSS. As seen in Figs. 1(c) and 1(d), the slope in the stress-thickness versus thickness curve represents the incremental stress in the film. Here, the negative and positive slopes in the stress-thickness versus thickness curve signify compressive and tensile stress, respectively. With the use of an AlN buffer layer, which grew under an initial incremental compressive stress of −2.23 GPa and gradually relaxed to −0.74 GPa (not shown), the high-temperature GaN layer grows under an initial compressive stress of −1.04 GPa [Fig. 1(c)]. This compressive stress gradually relaxes with thickness to a final incremental stress value of −0.17 GPa. In the case of GaN grown directly on SiC with a low-temperature GaN layer [Fig. 1(d)], the high-temperature GaN grows initially under a compressive stress of −0.35 GPa. This compressive stress transitioned into a tensile stress around ∼300 nm and then grew under an approximately constant incremental tensile stress of 0.27 GPa.
There is a dynamic interplay between growth related stresses that arise from the evolving film morphology and the mechanisms for stress relaxation. During initial nucleation, the film can be under compression due to capillary forces between islands. Reference Cammarata, Trimble and Srolovitz26,Reference Cammarata27 However, the growth of GaN on AlN leads to compressive stress largely due to epitaxial mismatch. This compressive stress is observed in the case of the growth of the high-temperature GaN layer on SiC with an AlN buffer layer [Fig. 1(c)]. As the islands grow laterally, the capillary forces can decrease to some extent, resulting in partial relaxation of the compressive stress. Furthermore, the gradual relaxation of the compressive stress may also result from the inclination of edge-type TDs in the microstructure. The inclination of TD with increasing thickness has been reported during the growth of AlGaN on SiC. Reference Acord, Raghavan, Snyder and Redwing28 Details on the mechanism of compressive stress relaxation due to the inclination of TDs have been discussed by Romanov and Speck. Reference Romanov and Speck29 In the case of the high-temperature GaN layer grown after the initial low-temperature GaN layer on SiC [Fig. 1(d)], the initial observed compressive stress of −0.35 GPa likely arises from the morphological evolution of the high-temperature GaN on the truncated and rough surface of the initial low-temperature layer. During the growth of the high-temperature GaN layer, adatoms diffusing across the surface can incorporate in-between ledges and grain boundaries. It is suggested that this mechanism of the attachment of adatoms can induce compressive stress during the growth of polycrystalline films. Reference Chason, Sheldon, Freund, Floro and Hearne30,Reference Spaepen31 However, tensile stress can also develop in films during the early stages of the growth, through the mechanism of island “zipping”. Reference Nix and Clemens32 Initially during the growth of the high-temperature GaN layer on SiC with a low-temperature GaN layer, islands nucleate and laterally grow from favorable sites. A continuous film is formed by islands impinging on each other, reducing the interfacial energy by forming grain boundaries. The elastic deformation of the islands as they are “zipping” together levies a cost of an increase in strain energy. Therefore, the induced tensile stress transition point observed in the stress-thickness versus thickness curve [Fig. 1(d)] in the high-temperature GaN layer may be the result of this island “zipping up” process. This observation of compressive-to-tensile stress transition during early stages of growth has been reported in Volmer–Weber growth of GaN on Si. Reference Krost, Dadgar, Bläsing, Diez, Hempel, Petzold, Christen and Clos33,Reference Raghavan and Redwing34
After island coalescence and surface roughness saturation, a transition to two-dimensional step flow growth occurs. The stress behavior of the film during this stage of the growth process highly depends on the mobility of the adatoms. In low adatom mobility growth of films, such as the MOCVD process presented experimentally here, the diffusion of adatoms on the surface is lower compared to the impingement rate. This consequently leads to the subsequent epitaxial growth of films in the strained state of the previous template layer. This growth effect was pointed out by Abermann and Koch in the growth of metal films with low adatom mobility. Reference Abermann35,Reference Koch36 The growth of the high-temperature GaN layer remains compressive, when grown on a compressively strained AlN buffer layer (incremental stress = −0.74 GPa), primarily due to epitaxial mismatch. However, in the case of the growth of the high-temperature GaN layer on SiC with an initial low-temperature GaN layer, tensile stress is sustained during two-dimensional growth after the tensile stress transition (induced from the island zipping-up process), primarily as a result of the low adatom mobility.
Residual stress presents postgrowth in the GaN layers grown on 6H-SiC. This is evident from the Raman spectra of the GaN layers (Fig. 2) collected after the growth process and cool down of the sample to room temperature. The residual stress in the GaN films after cool down is a combination of the intrinsic growth stress and extrinsic stress that results due to differences in the coefficient of thermal expansion (CTE) mismatch. The residual biaxial compressive and tensile stress in the GaN films can be determined respectively from the upward and downward frequency shift of specific Raman modes, relative to unstrained bulk GaN. The measurements of the GaN layers were done in a backscatter
 $z\left( {x,x} \right)\bar z$
configuration, with an excitation source (488 nm) and power density that insured that the GaN layer was completely probed. In c-plane wurtzite GaN, there are six active Raman modes.
Reference Harima37
For the
 $z\left( {x,x} \right)\bar z$
configuration, the E2(high) and A1(LO) modes are only observed. This selection rule of the Raman mode occurs in wurtzite GaN as a result of the optically anisotropic uniaxial crystal. The E2(high) mode for bulk GaN is centered at 568.0 cm−1 and is most sensitive to biaxial stress in the film.
Reference Harima37,Reference Perlin, Jauberthie-Carillon, Itie, San Miguel, Grzegory and Polian38
As evident in Fig. 2, the Pseudo-Voigt fit of the E2(high) mode of GaN revealed a downward shift in frequency (566.1 ± 0.3 cm−1), i.e., residual biaxial tensile stress, in the case of the growth of GaN on SiC with an AlN buffer layer. However, in the case of the growth of GaN on SiC via the two-step temperature growth process, a much larger downward shift in frequency (563.6 ± 0.3 cm−1), i.e., residual biaxial tensile stress, is observed. Using the linear stress coefficient of 4.2 cm−1/GPa for the E2(high) mode, the residual biaxial stress can be calculated from the deviation in frequency with respect to stress-free bulk GaN (568.0 cm−1).
Reference Harima37,Reference Kisielowski, Krüger, Ruvimov, Suski, Ager, Jones, Liliental-Weber, Rubin, Weber, Bremser and Davis39
We find in the case of the growth of GaN on an AlN buffer layer, a residual biaxial tensile stress value of 0.46 GPa is observed and in the case for the growth of GaN on SiC via the two-step temperature growth process, a residual biaxial tensile stress value of 1.05 GPa is observed. The caveat with the growth of GaN on SiC is that thermal expansion mismatch induced tensile stress is generated during postgrowth cool down. The calculated tensile stress as a result of cool down from 1100–25 °C for GaN and AlN on SiC is ∼0.40 and ∼0.80 GPa, respectively.
Reference Acord, Raghavan, Snyder and Redwing28
Therefore, the observed difference in the residual stress is attributed to the degree of the thermal expansion mismatch stress induced in the film after the cool down process.
Raman spectra collected at room temperature with a 488 nm excitation source in backscatter geometry of
 $z\left( {x,x} \right)\bar z$
for: GaN grown on 6H-SiC with an AlN buffer layer (top blue) and GaN grown directly on 6H-SiC via the two-temperature growth process (bottom red).

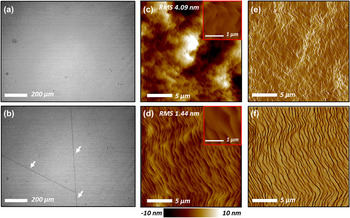
The tensile stress induced from the thermal expansion mismatch with SiC can lead to cracking of the GaN film. This is evident in the Nomarski optical contrast micrographs of the GaN surface shown in Figs. 3(a) and 3(b). The growth of the high-temperature GaN layer on SiC with an AlN buffer layer [Fig. 3(a)] leads to a crack-free surface of GaN. In the case of the growth of GaN on SiC with a low-temperature GaN layer [Fig. 3(b)], the micrograph shows a low density of cracks across the surface. As observed from MOSS during the growth of GaN on SiC with the low-temperature GaN layer [Fig. 1(d)], the incremental stress of the film remained tensile after ∼300 nm. Upon cool down, the additional generated tensile stress as a result of thermal expansion mismatch can lead to the observed cracking in the GaN film. This is consistent with the residual biaxial tensile stress observed in Raman [Fig. 2] for the growth of the two-step GaN on SiC, where the growth of GaN with an AlN buffer layer indicates a smaller residual biaxial tensile stress, below the critical stress for cracking, thus producing crack-free GaN after postgrowth cool down.
Nomarski optical contrast micrographs of the surface of: (a) GaN grown on 6H-SiC with an AlN buffer layer, and (b) GaN grown directly on 6H-SiC via the two-temperature growth process (arrows indicate channeling cracks on the GaN surface). AFM images of the height (c, d) and amplitude (e, f) collected with tapping mode over a 20 µm × 20 µm area of: (c–e) GaN grown on 6H-SiC with an AlN buffer layer, and (d–f) GaN grown directly on 6H-SiC via the two-temperature growth process. The insets in (c, d) are AFM images of the height collected over a 2 µm × 2 µm area.

Although the compressive incremental stress observed in the GaN layer grown on SiC with the AlN buffer layer [Fig. 1(c)] mitigates cracking that results from the thermal expansion induced tensile stress, the use of the AlN buffer layer can lead to an increase in surface roughness. AFM images of the height [Figs. 3(c)–3(d)] and amplitude [Figs. 3(e)–3(f)] were collected with tapping mode AFM. The macroscale root mean square (RMS) roughness of the high-temperature GaN surface was examined by AFM over a 20 µm2 × 20 µm2 area. An improvement in the macroscale surface roughness of GaN is observed for the direct growth of GaN on SiC via a two-step temperature growth process (RMS = 1.44 nm), in comparison to the growth of GaN with an AlN buffer-layer (RMS = 4.09 nm). The improvement in the RMS roughness, in the case of the growth of GaN on SiC via the two-step temperature growth process, may arise from a reduction in compressive stress-induced surface roughing. This is similar to what was observed in the growth of AlGaN on bulk AlN and the growth of N-polar GaN via two-step temperature growth process on SiC. Reference Ren, Sun, Kwon, Han, Davitt, Song, Nurmikko, Cho, Liu, Smart and Schowalter40,Reference Won, Weng, Al Balushi and Redwing41 Moreover, the prolong recovery of the reflectance during the nucleation of the high-temperature GaN layer on the low-temperature GaN layer [Fig. 1(b)] leads to large island coalescence and two-dimensional step flow growth with terraces relatively wider [Fig. 3(f)] than terraces resulting from the growth of GaN on the AlN buffer layer [Fig. 3(e)].
X-ray rocking curve (XRC) measurements in HR-XRD were also performed to further understand the interrelationship between the growth stress evolution and structural quality of the GaN films. As observed from the reflectance-thickness data [Fig. 1(b)] and AFM [Figs. 3(d) and 3(f)], the delayed coalescence of GaN, when grown on SiC with a low-temperature GaN layer, leads to larger island size and improved surface morphology. Therefore, the delayed coalescence of the islands in turn should also give rise to a reduction in the density of TDs. There is a strong correlation between TD density and the mosaicity of the film. During the growth of GaN, TDs are generated to accommodate the misorientation of the subgrains, i.e., mosaic tilt and twist. The tilt and twist represent the misorientation of the mosaic out-of-plane and in-plane, where they relate to screw (c-type) with
b
= [0001] and edge (a-type)
 ${\bi{b}} = {{\bf{1}} \mathord{\left{\vphantom {1 3}} \right\kern-\nulldelimiterspace} /3}\left\langle {11\bar 20} \right\rangle$
TD components, respectively.
Reference Moram and Vickers42
From the XRC full width at half maximum (FWHM) of the (0002) and
 $\left( {10\bar 10} \right)$
reflections of c-plane GaN, the angle distribution of the respective mosaic tilt and twist, which characterizes the TDs density in the film, is measured. However, the XRC FWHM of the
 $\left( {10\bar 10} \right)$
reflection cannot be measured directly in a standard “four-circle” diffractometer geometry. To estimate the TD density in the GaN layers, a model developed by Srikant et al. was utilized.
Reference Srikant, Speck and Clarke43
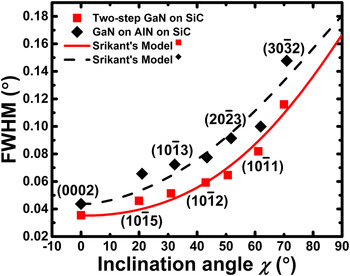
The model considers crystallite rotations and convolutions of two Pseudo-Voigt functions. Therefore, by measuring a series of XRC FWHM as a function of inclination angle (χ) as seen in Fig. 4, the XRC FWHM of the
 $\left( {10\bar 10} \right)$
reflection at χ = 90°, i.e., twist in the film, can be estimated. Once twist is estimated, the TD density (ρ
TD) is calculated using the classical model for the distribution of random dislocations.
Reference Gay, Hirsch and Kelly44
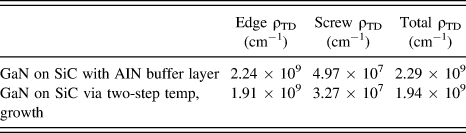
Figure 4 illustrates the fitted XRC FWHM as a function of inclination angle for the GaN layers grown on SiC via the two-step temperature process and with the AlN buffer layer. Evident in Table I, a reduction in the total ρ
TD of GaN grown via the two-step temperature process is observed, as compared to the growth of GaN with the AlN buffer layer. This reduction in the TD density in the case of the growth of GaN on SiC via the two-step temperature growth is attributed to larger island size and delayed coalescence of the high-temperature GaN layer, when the AlN buffer layer is not utilized.
A series of measured XRC FWHM reflections of GaN as a function of inclination angle to estimate twist (χ = 90°) and TD density in the GaN films using a model developed by Srikant et al., Reference Srikant, Speck and Clarke43 for the growth of GaN on 6H-SiC: with an AlN buffer layer (diamonds, dashed line fit), and via the two-step temperature growth process (squares, solid line fit).

Estimated TD densites of GaN as calculated by HR-XRD.

TEM was used to investigate the microstructure of FIB cross-sectional specimens of GaN grown on SiC via the two-step temperature growth process. Figure 5(a) shows a bright-field image collected near the GaN
 $\left\langle {10\bar 10} \right\rangle$
zone axis using multibeam diffraction conditions to reveal all types of TDs in the GaN layer. The TDs are primarily confined within the low-temperature GaN layer, where the diffraction pattern [Fig. 5(a) inset] shown in that region reveals single crystalline wurtzite GaN. The topmost part of the high-temperature GaN layer reveals a lower density of TDs propagating to the surface, where the scanning transmission electron microscope (STEM) image shows a flat surface of GaN. To evaluate the different type of dislocations confined in the low-temperature GaN layer, weak-beam dark-field TEM images were collected at the
 $\left\langle {10\bar 10} \right\rangle$
zone axis, tilted toward
g
= <0002> [Fig. 5(c)] and
g
=
 $\left\langle {11\bar 20} \right\rangle$
[Fig. 5(d)] to reveal, c- and (a + c)-type and a- and (a + c)-type dislocations, respectively, in the film. Weak-beam TEM shows predominant (a + c)-type dislocations in both
g
conditions. However, TEM also reveals the presence of both basal plane stacking faults (BSFs) and
 $\left\{ {11\bar 20} \right\}$
prismatic stacking faults (PSFs). When
g
=
 $\left\langle {11\bar 20} \right\rangle$
[Fig. 5(d)], the observed vertical fringes within the first 500 nm from the GaN/SiC interface are related to PSFs. They are invisible under
g
= <0002> [Fig. 5(c)] since
g
.
R
= 0, where
R
is the stacking fault displacement vector. The formation of PSFs is likely to originate from the nature of the island coalescence of the initial low-temperature GaN layer, as a result of the poor wetting behavior of GaN on SiC. The observation of
 $\left\{ {11\bar 20} \right\}$
PSFs near the GaN/SiC interface was also reported in the molecular beam epitaxy growth of GaN on vicinal 6H-SiC.
Reference Vermaut, Ruterana, Nouet, Salvador and Morkoç45
Furthermore, the presence of BSFs may prevent the propagation of TDs into the topmost part of the GaN, thus reducing the total ρ
TD as observed from HR-XRD.
TEM analysis of the GaN microstructure grown on 6H-SiC via the two-step temperature growth process: (a) low magnification bright-field image collected near the GaN
 $\left\langle {10\bar 10} \right\rangle$
zone axis, with a diffraction pattern [inset top right of (a)] collected near the initial low-temperature GaN/SiC interface, (b) Z-contrast STEM of the topmost part of main high-temperature GaN layer, and weak-beam dark-field TEM images of the low-temperature GaN layer collected for (c)
g
= <0002> and (d)
g
=
 $\left\langle {11\bar 20} \right\rangle$
.

IV. CONCLUSION
In summary, we investigated the morphological and stress evolution during the growth of GaN on 6H-SiC with in situ optical reflectance and wafer curvature measurements, respectively. With the AlN buffer layer, GaN grew under an initial compressive stress of −1.04 GPa which gradually relaxed with thickness (−0.17 GPa). In the case of GaN grown directly on SiC via a two-step temperature growth process, the high-temperature GaN layer grew initially under compressive stress (−0.36 GPa) which evolved into tensile stress (0.27 GPa) above ∼300 nm. This transition into tensile stress occurs when islands laterally overgrow and impinge on each other, i.e., zip-up. As a result, a reduction in the interfacial energy occurs by forming grain boundaries, levitating an increase in the strain energy. The growth of GaN directly on SiC showed a reduction in the TD density and an improvement in the macroscale roughness as a result of the prolonged coalescence of the high-temperature GaN layer. However, cracking of the GaN film was observed when AlN was not utilized. Film cracking observed in GaN is largely a result of the difference in CTE between GaN and SiC, inducing tensile stress during postgrowth cool down. The film cracking may be reduced by utilizing low Al content AlGaN in the low temperature layer and/or optimizing the temperature change in the two-step temperature growth process to introduce sufficient amounts of compressive stress into the GaN film before cool down. Weak-beam TEM reveled predominant (a + c)-type dislocations with few BSFs and
 $\left\{ {11\bar 20} \right\}$
PSFs, all confined within the initial low-temperature GaN layer. These BSFs may block the propagation of TD into the high-temperature GaN layer and result in an improvement in the film quality.
ACKNOWLEDGMENTS
This material is based upon work supported by the National Science Foundation under Grant Nos. DMR-1006763 and DMR-1410765 (JMR). Any opinions, findings, and conclusions or recommendations expressed in this material are those of the author(s) and do not necessarily reflect the views of the National Science Foundation. We would like to acknowledge Mr. Joshua J. Maier and Dr. Ke Wang (Materials Characterization Laboratory, The Pennsylvania State University) for FIB-TEM sample preparation and TEM imaging, respectively. We would like to also acknowledge Dr. Xiaojun Weng, Intel Corporation, Hillsboro OR, for TEM discussions and analysis.