

Changing residential mobility rates of older people in Sweden
In recent years expected changes in behaviour between the baby boomers (in Sweden those born in the 1940s) and older cohorts have been discussed from different perspectives, from general consumption behaviour to residential mobility rates and patterns, including housing consumption (Fransson Reference Fransson2004). Studies have raised issues that can influence residential mobility rates such as changes in place attachment among baby boomers (Bonvalet and Ogg Reference Bonvalet and Ogg2007, Reference Bonvalet and Ogg2008), increasing housing over-consumption (Clark and Deurloo Reference Clark and Deurloo2006), tenure transition among older people (James Reference James2008; Tatsiramos Reference Tatsiramos2006), and geographical relocation such as moving abroad (Gustafson Reference Gustafson2001) or the perspective of older people returning to rural areas as they retire (Jauhiainen Reference Jauhiainen2009; Plane and Jurjevich Reference Plane and Jurjevich2009). Another recent issue is the role of home ownership in retirement, together with equity release (Doling and Ronald Reference Doling and Ronald2010; Toussaint and Elsinga Reference Toussaint and Elsinga2009). The baby-boom cohort is now retiring and their actual behaviour in the housing market as regards residential mobility may be statistically visible.
With this in mind this paper examines residential mobility of older people in a Swedish context. The aim is to establish whether mobility rates have increased (or decreased) over time and to determine if the baby boomers differ from earlier cohorts in ways that would explain such differences. As the share of older people in all Western societies is growing, their behaviour in the housing market will affect other groups entering new segments of the market. Their actions and decisions will impact planning issues. The change in demography is not new to planners or politicians, but how it will change the balance in different sectors of society is still unclear.
This study used register data from Statistics Sweden recorded for every individual in Sweden from 1990 to 2008 in the Geoswede database. The focus was on the most discussed cohort of older people in Sweden, namely the 1940s cohort, the Swedish baby boomers with exceptionally high birth rates (except for 1940–42). This cohort entered retirement age, or was about to, during the period of study, 2001 to 2006. Some were fairly young (in their fifties) and according to earlier studies could be expected to be preparing for housing at older ages (Abramsson and Andersson Reference Abramsson and Andersson2012; Abramsson and Niedomysl Reference Abramsson and Niedomysl2008). The actual reasons for moving are not known as the database provides individuals' registered changes and not preferences and attitudes. The data to describe movers and stayers were sex, age, marital status, income from work and early retirement, country of birth, educational level, children at home, capital income and tenure. To determine a possible increase in residential mobility over time, a point of reference was needed; for this purpose the cohort born in the 1930s was used in order to study mobility rates during the period 1991 to 1996, i.e. ten years earlier.
Referring to the question of balance in different sectors of society, the housing sector is of crucial interest. The housing stock and the housing system are to some extent inert or at least rather path-dependent (Bengtsson Reference Bengtsson and Bengtsson2006). All parts of Sweden will see an increase in the share of older people (Andersson Reference Andersson, Elsinga, Decker, Teller and Toussaint2007) and according to earlier qualitative and survey studies some of them will move and seek housing that conforms to the demands of this group (Abramsson and Niedomysl Reference Abramsson and Niedomysl2008). If this happens, together with a predicted increase in mobility, this will indeed change the balance in the housing market and may increase the demand for housing choices available to older people. One possible development is a rise in the demand for senior housing, which can already be seen in some municipalities. As the baby boomers together with older cohorts constitute almost two out of nine million people in Sweden, the mobility of the studied cohorts will have an impact on planning issues (Abramsson and Andersson Reference Abramsson and Anderssonin press). However, whether old people today are more likely to move than previously has not been researched using register data. Increased mobility is mainly assumed on the basis of interview studies and surveys (Abramsson and Berg Reference Abramsson, Berg, Malmberg, Abramsson, Magnusson and Berg2004; Abramsson and Niedomysl Reference Abramsson and Niedomysl2008). As patterns of demographic change are similar to those in other European countries where there is also an interest in the housing situation of older people, the findings of this study can be useful in a comparative perspective (Tatsiramos Reference Tatsiramos2006).
Aim and questions
The aim of this study is to examine if mobility rates have changed over time, and this is done by comparing the two cohorts born in the 1930s and 1940s. Questions are raised as to differences in the frequency of moves as well as to similarities and differences in the characteristics of the respective cohorts. The answers are intended to prove or contradict findings that are based on interview and survey studies discussed above. The paper begins with a presentation of the aims and the related research questions on which the study presented is based. Next there is a section discussing residential mobility and older people's options in the housing market and the Swedish housing market context. The data, method, and methodological considerations are described in the following section. The results section follows, describing the mobility rates of the two cohorts selected as well as the characteristics of the stayers and movers in each cohort. In the final section the results are discussed.
Residential mobility and older people's options in the housing market
It is well known from several studies and countries that older people do not move to a large extent, compared to younger cohorts (Geist and McManus Reference Geist and McManus2008; Håkansson Reference Håkansson and Fransson2004; Tatsiramos Reference Tatsiramos2006; Walters Reference Walters2000). Rather, they stay put where they have lived for a long time. In particular, this is true for home owners but also for people with less education and those that have lived for a long time in their homes (Abramsson and Andersson Reference Abramsson and Anderssonin press; Andersson Reference Andersson and Fransson2004b; Walters Reference Walters2002). Studies also show that the older the residents are, the stronger their will to stay and age in place (Costa-Font, Elivar and Mascarillo-Miró Reference Costa-Font, Elivar and Mascarillo-Miró2009; Robison and Moen Reference Robison and Moen2000). However, the increase in the proportion of older people in the population and the discussion on lifestyle changes among the ‘young old’, in particular the baby boomers (Edmunds and Turner Reference Edmunds and Turner2002; Huber and Skidmore Reference Huber and Skidmore2003) raises questions concerning changing patterns of residential mobility, such as the frequency of moves, choice of tenure and housing size (Bonvalet and Ogg Reference Bonvalet and Ogg2007; James Reference James2008; Kramer and Pfaffenbach Reference Kramer and Pfaffenbach2009; Tatsiramos Reference Tatsiramos2006). As older people constitute a large group of the Swedish population (Andersson Reference Andersson2004a; SCB 2010), their choice of housing affects the situation in the housing market. Older people's preferences and housing plans for the future have been investigated using qualitative and survey studies, and an increasing interest in residential mobility among older people has been shown (Abramsson and Niedomysl Reference Abramsson and Niedomysl2008; Tillberg-Mattsson Reference Tillberg-Mattsson, Borgegård, Håkansson and Tillberg2002).
In Sweden, about 63 per cent of those born in the 1940s were home owners in 2006, and it could be assumed that a majority of people will remain where they are as most of those in the cohort are well housed as regards housing standards and space (Geoswede data). However, some of the characteristics ascribed to the baby boomers could indicate higher mobility rates as they age; earlier in life they have, to a greater extent than older cohorts, moved for study or labour market purposes, and have attained a higher level of education as well as higher incomes. In addition, this cohort has a higher divorce rate, indicating a previous household break up and a subsequent move. A history of previous moves makes households more prone to move again, as does living in rented accommodation (Fischer and Malmberg Reference Fischer and Malmberg2001). For individuals that have a history of moving, another move in old age may not be a great obstacle, this history of moving rather increase the incentive to move. An on-going project based on interviews with older people moving into senior housing confirms this trend (Gidoff Reference Gidoff2008). The same study indicates that some households choose housing in older age that will simplify life. One reason for this is to be able to continue life as normal by reducing the workload around the home and garden that takes more time and effort as individuals age, but another reason is to be able to realise other projects, such as travelling and other leisure pursuits (Gidoff Reference Gidoff2008).
This possible change among older people to a more diversified housing career can be related to a similar change in the meaning of housing (Clapham Reference Clapham2005). Housing has become a way to realise other values in life as they become important, and to remain in a current housing situation does not necessarily override other lifestyles (Clapham Reference Clapham2002). On the one hand, previous research on interregional mobility from Sweden shows that individuals who have family ties (such as being married and having children), own a house, have a job and little previous experience of moving are more prone to stay than to move (Abramsson Reference Abramsson2003; Lundholm Reference Lundholm2007). On the other hand, moving is often related to life-course changes, such as household formation or break-up, or unemployment (Fischer and Malmberg Reference Fischer and Malmberg2001). Children leaving the parental home, and retirement are other lifecourse changes that could have an effect on mobility rates (Abramsson and Andersson Reference Abramsson and Anderssonin press; Andersson Reference Andersson and Fransson2004b; Walters Reference Walters2002).
Thus, a number of factors influence older people's residential mobility rates such as preferences, choice, place attachment, housing availability, but also economic conditions. People's actions in the housing market are to a large extent influenced by house prices, and thus by economic recession or boom. In the beginning of the 1990s Sweden went through an economic recession followed by a subsequent boom ten years later, which influenced residential mobility among households (Andersson et al. Reference Andersson, Naumanen, Ruonavaara and Turner2007). Following the long trend of rising house prices in the 2000s, a trend of baby boomers moving home to release capital from housing equity has been noted (Andersson Reference Andersson, Elsinga, Decker, Teller and Toussaint2007). For this reason the individual's sum of capital income has been included in the results section below.
The Swedish housing market context
As the baby boomers of the 1940s reached nest leaving age in the 1960s, there was a growing need for more housing in Sweden. This (among other things) led to a severe housing shortage in the 1960s, and the Million Programme was introduced, adding 650,000 dwellings in a ten-year period (1965–74), mainly in multi-family municipal housing estates (SOU 1965:32; Strömberg Reference Strömberg and Lindbom2001). As this was completed, the production of privately owned single-family housing increased considerably. State subsidies to the housing sector became more neutral to tenure, that is, no tenure form should benefit more than another financially. As a result, people were also directed to owner occupation, and this policy benefited young entrants in the market, notably the cohorts of 1940s. This led to a growing share of owner occupiers among the working class and lower middle class and a decreasing demand for multi-family housing in some areas, in particular those hardest hit by industrial closures (Vogel Reference Vogel1993).
There was a different housing market context as the cohort of the 1930s reached nest-leaving age, a decade before the baby boomers. Despite a severe shortage of housing, there was not a Million Programme and fewer housing subsidies were available to alleviate the situation. Those who became owner occupiers at an early stage, i.e. before the dramatic price increases towards the end of the 1980s, have been able to keep their housing costs down. In most cases, for this cohort it is financially beneficial to remain in a home as most of the mortgage has been paid off and as a result housing costs can be kept at a low level (Andersson Reference Andersson, Elsinga, Decker, Teller and Toussaint2007). Moving into rental housing, or even a tenant co-operative, in the same region would increase the cost of housing for most people. However, released capital could be invested and as such contribute to higher capital income or it could be used to realise other projects in life (Elsinga et al. Reference Elsinga, Decker, Teller and Toussaint2007).
At the beginning of the 1990s the housing market was deregulated and the governmental system for housing subsidies dismantled, bringing construction to an almost complete standstill (Turner and Whitehead Reference Turner and Whitehead2002). There was a simultaneous economic recession and at this time many single family houses and tenant co-operatives were sold at a loss or at a lower price than at the end of the 1980s or the late 1990s (Turner and Whitehead Reference Turner and Whitehead2002). In such a situation, according to Åsberg (Reference Åsberg1998), older home owners are expected to transit from owning to renting, in order to release capital and liquidate equity to handle the crisis. Another option, according to the same author and verified in empirical studies, is that older households stay put in order to enjoy home ownership as an insurance against uncertain rents (Åsberg Reference Åsberg1998).
Currently, the housing market in Sweden is rather equally divided between owner occupation (43%) and public and private rental housing (40%). In addition there is a third sector, tenant co-operative apartmentsFootnote 1 (17%) (Andersson et al. Reference Andersson, Naumanen, Ruonavaara and Turner2007). The large majority of single-family housing is owner occupied and apartments are rental or tenant co-operatives. Access to public rental housing is open to all households, and is not regulated by needs and income testing, although in practice, low-income households are over-represented in this sector. The proportion of poor people in single-family housing is below average compared to other countries in Europe (Andersson Reference Andersson, Elsinga, Decker, Teller and Toussaint2007: 234). However, households of all kinds may well opt for rental housing due to the convenience and because such housing is good, modern, and offers more services (Andersson et al. Reference Andersson, Naumanen, Ruonavaara and Turner2007).
From the end of the 1980s, senior housing, i.e. housing for an older population, most often from the age of 55 and above, was introduced into the Swedish housing market in the form of rental and tenant co-operative apartments (Paulsson Reference Paulsson2008). During the first ten years of the 2000s, this type of housing increased substantially from 11,000 apartments to around 33,000, and municipalities are planning for more such apartments (Boverket Reference Boverket2009; SOU 2008:113). The geographical spread of this type of housing has also increased, and it is now available outside the major cities, i.e. in medium-sized cities and in some smaller towns and municipalities. There is also a variety in the cost and standard of this type of housing. Thus, this sector has been made available to a larger group of people.
Data and method
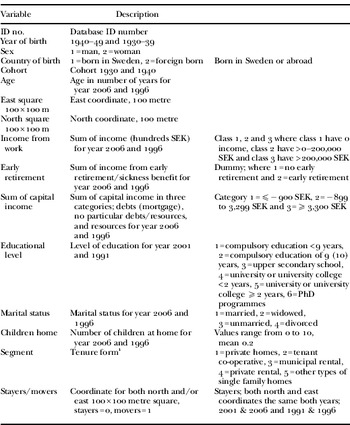
This study follows the mobility of individuals born in the 1930s and 1940s between 1991 and 1996, and 2001 and 2006, respectively, using a register database, i.e. the Geoswede database held by the Institute for Housing and Urban Research at Uppsala University. The Geoswede database covers all individuals that have lived in Sweden sometime between 1990 and 2008. It contains detailed annual information about work-related, socio-economic, and educational status. This study makes use of the variables presented in Table 1.
Data for the two cohorts born in the 1940s and the 1930s were selected. For the 1940s, cohort residential mobility rates between the years 2001 and 2006 are studied, and for the 1930s cohort the chosen years are 1991 and 1996 to obtain the years when the cohorts had the same age. There is an age span of 15 years – ten years in cohort and five years in time. However, the same classification of variables is made for the different years and the variables are the same (Table 1). This way we are able to make comparisons between the cohorts.
The number of individuals born in 1930–49 decreased between 2001 and 2006 as a result of deaths and migration to other countries. Among people from the 1930s cohort 7,579 persons had emigrated (less than 5% of the movers) and in the 1940s cohort 11,101 (about 4% of the movers), however non-registered seasonal migration is expected to be higher (Gustafson Reference Gustafson2001). The largest number of emigrants went to Norway and Finland but there were also stateless refugees for both cohorts. However, due to the relative small numbers we do not expect these emigrants to influence our results significantly. Also, individuals were deleted from the sample because of missing values for: residence number (largest reduction), house type, registered form of ownership, and east/north coordinates. These are variables that were all prerequisites for individuals in the study. The deleted individuals reflected the main population when the variables of age, sex, and foreign birth were analysed. Methodologically, apart from descriptive elements, the study includes logistic regression models to test the probability of moving or staying.
The motives for moving or staying, are not known, as the study is limited to what is known of their personal information as recorded in the database such as age, early retirement, widowhood, or children at home, etc. When testing for correlations among the variables, the strongest was an expected negative correlation between income from work and early retirement (−0.386** for the 1930s cohort and −0.502** for the 1940s cohort; **correlation is significant at the 0.01 level (two-tailed)). Other factors that influence household moves, such as changing values, lifestyle issues, economic recessions, or booms have been found elsewhere and we have used existing studies of older people and their housing preferences to complement this study (Abramsson and Berg Reference Abramsson, Berg, Malmberg, Abramsson, Magnusson and Berg2004; Abramsson and Niedomysl Reference Abramsson and Niedomysl2008).
The definition of a mover is a person who moved at least once between 1991 and 1996 for the cohort born in the 1930s, and at least once between 2001 and 2006 for the 1940s cohort. We count a move as a change in a person's coordinates for both north and/or east coordinates according to a 100-metre grid of Sweden. This means that a change of dwelling on a detailed level (100 m) is recorded as well as long-distance moves over the period. We preferred this measure of a mover to one that captures only the change in, for example, tenure form or house type. As for people in assisted living homes, they are included but not identifiable directly in the database, as they live in ordinary tenure forms, most of which are in public rental housing. The number of people in assisted living was about 95,000 above the age of 65, of which a large majority was over the age of 80 in 2007 (Sveriges kommuner och landsting [The Swedish Association of Local Authorities and Regions] 2008: 48).
Variables

Note:1. Due to data restrictions tenure form for 1995 instead of 1996.
Results
In our analysis we use the total population of the cohorts of persons residing in Sweden during the two periods of study. For the period 2001–06 the cohort of those born in the 1940s included 1,080,433 individuals. For the period ten years earlier, 1991–96, the total number of individuals born in the 1930s was 825,990. That is, the cohort of the 1930s was, as expected, smaller than that of the 1940s. As for the number of people born in each year of the cohorts, the number was smaller the earlier the year of birth, which was mostly a consequence of deaths.
Who are the most frequent movers measured at the same age?
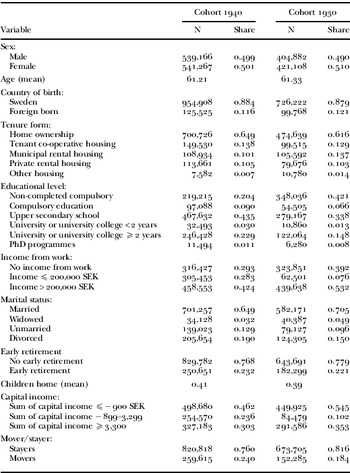
As expected, but previously not demonstrated, individuals born in the 1940s moved more than individuals born in the 1930s. Of the 1930s cohort, 18 per cent moved compared to 24 per cent of those in the 1940s cohort (mean of movers and stayers variable in Table 2 equals the share of movers). The difference between the cohorts is 6 percentage points. For the 1930s cohort the 18 per cent equalled 152,285 individuals, and for the 1940s cohort the 24 per cent was equivalent to 259,615 movers in actual numbers. That is, about 100,000 individuals more were movers in the 1940s cohort (Table 2).
Descriptive statistics for 1940s and 1930s cohort

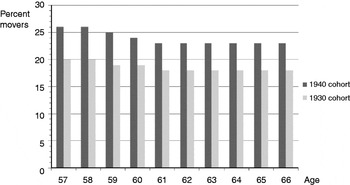
By dividing the cohort born in the 1940s into year of birth we can see the slightly surprising pattern of younger persons moving to a higher degree than older individuals in the same cohort (Figure 1). Those aged 57–59 moved more frequently than those aged 61–66 years. One possible result that we might have expected would instead have been to see higher frequencies of movers as they reached the years of retirement, but this was not the case. However, the result obtained is comparable with results of a recent Spanish study of preferences of ageing in place (Costa-Font, Elivar and Mascarillo-Miró Reference Costa-Font, Elivar and Mascarillo-Miró2009), an earlier study in the United States of America (Warnes Reference Warnes, Champion and Fielding1992), and also a Swedish study of elderly parents (older than 65 years of age) moving closer to adult children (Pettersson and Malmberg Reference Pettersson and Malmberg2009), as well as results in Fransson (Reference Fransson2004: 28). Interestingly, the 1930s cohort showed a similar pattern in that people aged 57–60 were movers to a larger extent than those of the ages 61–66 (Figure 1).
Share of movers at ages 57–66 for cohorts 1930 and 1940.

Characteristics of stayers and movers
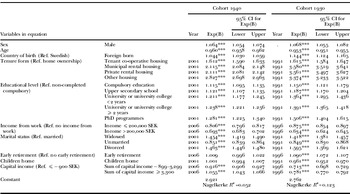
Complementing the finding that people in the 1940s cohort were more frequent movers than those in the 1930s cohort, the characteristics of the two cohorts and their respective movers (and stayers) are studied as described below. The question of who the movers were resulted in the dependent variable of moving (1) or staying (0), and in Table 3, odds ratios for moving are presented. It is possible that we may find some dissimilarities that help explain the higher frequency of moves in the 1940s cohort. Below is the result from logistic regressions of the 1940s cohort, and then the 1930s cohort, followed by a comparison of the two.
To begin with, men had a somewhat higher propensity to move than women in the 1940s cohort (Table 3). This result is probably age-specific as according to SCB (2008), women are reported to move at least one more time in their lifetime than men. The probability of moving decreased somewhat with age, as described above and confirmed in several other studies (Figure 1). This is not to say that residential mobility will not increase again in later life for various reasons, for example, due to health issues. Those who were foreign born had a slightly higher likelihood of moving than those born in Sweden in the 1940s cohort. An increased mobility rate among the foreign born has also been shown in other studies (Clark and Drever Reference Clark and Drever2000). Overall sex, age and country of birth were significant but with minor effects.
The probability of moving was higher for persons in every other tenure form than home ownership, which is consistent with earlier research (Fischer and Malmberg Reference Fischer and Malmberg2001). Those in rental housing had a particularly high probability of moving; in fact the likelihood of moving was twice that of those who owned their homes. Tenure form changed the log likelihood value most if the term was removed from the model, which indicates the importance of tenure form in predicting a move (or the event of staying) in the 1940s cohort. Sixteen per cent of home owners moved during the period 2001–06, which was equal to 42 per cent of the total number of movers. Also, in accordance with earlier research, for the individuals in the 1940s cohort, the higher their educational level, the higher their propensity to move (Fischer and Malmberg Reference Fischer and Malmberg2001). Income from work reduced the likelihood of moving compared to those without such an income. Considering early retirement, the variable was not significant in our model. However, marital status was significant, and was an important variable in the model, being second in importance after tenure form in changing the model's log likelihood value if the term was removed. It showed that those who were widowed and divorced had about one and a half times the probability of moving compared to married individuals. The significance of children still living at home was tested in predicting a move but the variable was not significant in the model. Comparing those with a low sum of capital income with those with a negative sum (mortgage or other loans) suggested that those with a fairly low sum of capital income had a lower likelihood of moving. The result is mixed in that those with the highest sum of capital income had a higher likelihood of moving compared to those with a negative sum of capital income (Table 3). However, the magnitude of odds ratios showing the effects were minor.
Probability (odds ratios) of moving for cohort 1940 (N=1,080,433) and cohort 1930 (N=825,990)

Notes: Exp(B):exponentiation. CI: confidence interval. Ref.: reference category.
Significance levels:
* p<0.05,
** p<0.01,
*** p<0.001.
Men in the cohort born in the 1930s (like the 1940s cohort) had a higher probability of moving than women in the same cohort. Increasing age reduced the likelihood of moving for the 1930s cohort, and being born outside Sweden resulted in a higher probability of moving than being born in Sweden (Table 3). As for the 1940s cohort, the overall effects from sex, age and country of birth were minor.
Looking at tenure form in Table 3, the likelihood of moving was much higher for tenant co-operative housing and rental housing (municipal and private) than for the reference category of home ownership. For the two types of rental housing the likelihood of moving was more than three times higher. Ten per cent of home owners moved during the period 1991–96, which was equal to 34 per cent of the total number of movers. Increasing educational levels gave a higher likelihood of moving for the 1930s cohort. Income from work resulted in a lower probability of moving than not having any income from work. The result can be understood in relation to the higher likelihood of moving for those individuals taking early retirement. Concerning marital status, widows and widowers had a higher probability of moving than married people, and this was also the case for divorced persons. Unmarried individuals had a lower likelihood of moving than the reference category of married people in our model. Among the 1930s cohort, having children living at home in 1991 lowered the likelihood of moving. Compared to those that had a negative sum of capital income in 1996, those with a positive sum of capital income had a lower likelihood of moving (Table 3).
The aim of this study was to examine whether mobility rates and mobility patterns change over time by comparing the two cohorts born in the 1930s and 1940s, respectively. The origin of this aim came from the fact that survey and interview studies state an increase in future and planned mobility among the 1940s cohort compared to earlier cohorts at the same age. Therefore a comparison of the 1940s and 1930s cohorts was undertaken.
First, there was a difference in the extent to which the dependent variable of moving or staying was explained by the variables in the model. The same variables had less power to explain when modelling the 1940s cohort (Nagelkerke R 2 was 0.052, and for the 1930s cohort, 0.123). This showed that for the 1940s cohort, early retirement and number of children at home were not significant variables in the model. However, the variables that were the most important were the same and in the same order for both cohorts; the first and most powerful variable was tenure status. If comparing share of cohorts in home ownership, the 1940s cohort was over-represented but showed the greatest share of movers (16% compared to 10%). It is important to remember that the tenure form of home ownership provided the smallest shares of movers of all tenure forms. This is an interesting result since the expected increase in moves among older people was among home owners. They were expected, according to earlier studies, to leave their house for a convenient apartment (rental or tenant co-operative) in a more central location. Second most important for the propensity to move was marital status. The third most powerful variable to explain whether moving occurred or not, was income from work. Those with such an income moved less, which can be explained by the fact that they were still working and probably in good health. The fourth most important variable (measured by the power to change the models log likelihood value) in our analysis was age: the older the person, the lower the likelihood of moving. The oldest individuals in our study were 66 years old.
Discussion
The results of this study clearly show that those born in the 1940s were more frequent movers than the cohort of the 1930s. Even though the economic recession of the early 1990s can be of importance for this result, a period effect, the differences between the two cohorts, cohort effect, still indicate an increased mobility rate over time. Also, since the actual moving patterns as caused by the recession are not clear, it is proposed both that risk-averse persons would prefer renting (moving from home ownership) and that households do not move in order to insure themselves against uncertain rents (Åsberg Reference Åsberg1998). The result remains that the baby boomers (in Sweden the cohort of the 1940s) behave differently compared to older cohorts as regards residential mobility and tenure forms in the housing market. Interestingly, for both cohorts mobility rates were higher among the younger of the cohorts, i.e. prior to retirement. This indicates that moves are made at a time in life when they may be made for labour market reasons, as a result of children leaving the parental home, or perhaps when plans are made for the years to come as retirees. It is possible that moves at this time of life will influence the housing situation in older age.
Although the total number of moves is increasing, a low share of moves still applied to owner occupiers. Individuals living in owner occupation were still less likely to move than residents in any other tenure form, such as tenant co-operatives or rental (municipal or private) housing. This was similar for the two cohorts. Still, if mobility rates in general were low in owner occupation, the cohort of the 1940s living in this form of tenure was more mobile than that of the 1930s. This result is interesting, but if owner occupiers continue to remain in their homes to a large extent, home care for the elderly still has to be performed to a greater extent than before in areas of owner occupation because a larger share of older people in the younger cohort live in single family housing. However, the fact that residential mobility among owner occupiers in the 1940s cohort was higher will reduce this increase to some degree according to the results of interviews and surveys indicating that older people will move from the owner occupation accommodation type. This study shows that despite giving such answers at interviews, older people are predominantly stayers. Those most likely to move live in rental housing, a form of tenure that is generally known to have a higher turnover rate. This was particularly true for the 1930s cohort, as they had a much higher probability of moving if they lived in rental housing.
Being born outside Sweden increased the likelihood of moving. A higher probability of moving remained, despite the fact that we controlled for tenure, including rental housing where residential mobility is greater than in other types of tenure and where immigrants are in general over-represented. Similarly the household structure, i.e. being divorced or being a widow/widower, increased the likelihood of moving for both cohorts. Such a change will most often influence the economy of the divorced or widow/widower and a move can be made for economic reasons – the home may be considered too large as well as the burden of maintenance too high.
However, an income from capital had a different influence on the likelihood of moving between the cohorts. Whereas the members of the 1940s cohort had an increased likelihood of moving if they had a higher capital income (small effect), this was not true for those born in the 1930s. This can possibly be explained by the latter experiencing a greater place attachment and a greater attachment to the current home than their younger counterparts (at the same age), and the importance of remaining is stronger. Also, this might indicate a much-discussed trend of releasing capital for a good life in old age among the cohort of the 1940s. These are questions about lifestyle and values that we could not test in our analysis. However, support for such reasoning is found in earlier studies (Abramsson Reference Abramsson2008).
As regards education, it is true that higher education levels increased the likelihood of moving in both cohorts, in fact to a higher extent among the 1930s cohort. A higher mobility rate among well-educated individuals could be explained by the fact that higher education nowadays is demanded in various sectors of society in different geographical locations. Since our study cannot pinpoint a specific difference between the cohorts that could explain the higher residential mobility among the 1940s cohort, we give a tentative answer in the number of persons with certain ‘mobility’ characteristics. Higher education is such a characteristic. In the 1940s cohort 26 per cent have some degree of university education compared to 16 per cent among the 1930s cohort (Table 2). The difference is far larger if we also consider the crude numbers; 278,921 individuals of the 1940s cohort and 132,924 of the 1930s cohort had some kind of university education. This is assumed to be an important explanation to the result.
In essence, the attempts in the logistic regressions to find explanations for the cohorts' different frequency of moves showed quite small differences in results between the two cohorts. Above is mentioned the higher probability of moving when living in rental housing, which for the 1930s cohort was higher still, as well as a lower probability of moving for those with the highest capital income in the 1930s cohort. Either we need other variables or the answer to higher mobility rates in the 1940s cohort could be explained by changing values and attitudes that cannot be seen in this material.
As described above, assumed differences attached to the 1940s cohort compared to the 1930s cohort and earlier, lies in so-called lifestyle changes and period effects; period effects being the specific context in which the cohort came to start working, study and find housing, etc. The 1940s cohort entered the housing market when new housing was constructed and housing subsidies were in practice. They entered the labour market during the so-called ‘record years’ and did not face unemployment in any substantial way. Further the 1940s cohort benefited from higher education and a large welfare state. This pattern, moving to study, work and new housing was natural and rising welfare made it possible. The 1940s cohort is known ‘to help themselves’ (Lindh and Malmberg Reference Lindh and Malmberg2000). This context of possibilities and new ideas (e.g. 1968-movement) did change the lifestyle of the 1940s cohort, that is, cohort effects are present. Although the results of this study cannot show the importance of the above-mentioned issues directly, the higher frequency of moving among the 1940s cohort is a sign of different attitudes towards residential mobility. Earlier research supports the idea that having moved once increases the probability for yet another move and this is proposed as an explanation, included in the lifestyle changes, for the result of this study.
Nonetheless, in this study we have confirmed an increased mobility rate over time as well as some characteristics of the movers. Having done this, further questions arise as to the geographical differences in residential mobility rates such as, is residential mobility increasing more in the larger cities rather than in the countryside or more remote areas? Alternatively, is the opposite true, if access to health care and other types of support diminishes in such areas? Are mobility rates influenced by new construction, such as the establishment of more modern rental or tenant co-operative housing, senior housing complexes, or other types of housing, all of which provide support in old age? What are the consequences for local housing markets if residential mobility among older age groups increases? Will this group consider a move over larger distances if they cannot access the type of housing they want in the local housing market?
The results are to some extent in line with and complement results based on data from the European Community Household Panel (Tatsiramos Reference Tatsiramos2006) that indicate a greater interest in moving among the young old in northern and central Europe in contrast to southern Europe where older people to a larger extent move for health reasons, that is in older age. Bearing in mind the characteristics of movers and stayers respectively and the share of the population with certain characteristics could help in directing plans for older peoples' housing options, as would further studies on the possible effect of welfare development to the housing choices and mobility rates of older people.