

DISCUSSION POINTS
-
• While the formal purpose of a market is to allocate scarce resources, the recurrence of resource “crises” suggests that, when it comes to anticipating problems, market signals, such as price, alone are imperfect indicators.
-
• The, as of yet, unmet challenge to the materials community is to develop methods of assessment that treat complex dynamics while maintaining the accessibility necessary to provide useful guidance to planners seeking to mitigate criticality risks.
Introduction
For as long as there has been a field of economics, there have been economists who have fretted over the scarcity of resources and its ramifications for society. Moreover, some of the most famous assessments of the problem have come to rather dismal conclusions. Reference Jevons1–Reference Ricardo4
Over the last century, the topic of resource scarcity has received intense, albeit sporadic academic attention, Reference Hotelling5–Reference Livernois11 particularly around the sustainability of fossil energy resources. The last five years have seen a renewed interest in the topic of resource scarcity, largely spurred by concern over the role of historically minor metals in sustainable energy technologies (e.g., Economat 12 ).
As concern over scarcity has broadened to a larger portion of the periodic table and has broadened conceptually to the framing now known as criticality, a clear intellectual challenge has emerged, identifying which resources are critical. While the formal purpose of a market is to allocate scarce resources, the recurrence of resource “crises” suggests that, when it comes to anticipating problems, market signals alone are fairly imperfect indicators.
In particular, market prices, considered the primary market signaling mechanism, reflect far more than a resource's natural or geologic scarcity; they also offer signals about the ways in which resources are extracted, the intensity of use required to achieve the functionalities that these resources enable in our goods, and the value placed upon those functionalities by consumers. As many observers have noted, deciphering the component of price that reflects resource scarcity, let alone acting upon it, is a challenging task Reference Gleich, Achzet, Mayer and Rathgeber13 (or see the review by Livernois Reference Livernois11 ).
Ultimately, resource criticality cannot be understood and evaluated without the use of assessments grounded in an understanding of the interactions among a number of technological, geophysical, and economic systems. The challenge to the community has been developing methods of assessment that can treat this complex dynamic while maintaining the accessibility necessary to provide useful guidance to planners seeking to mitigate criticality risks.
In response to this challenge, a range of efforts have developed methods to identify criticality risk for a particular material or technology. Although these approaches differ in detail, they are all grounded in the notion that criticality emerges from the confluence of vulnerability and supply risk. Vulnerability occurs when a resource serves a significant role to the stakeholder (i.e., the resource is important) and alternatives are limited (i.e., substitution is difficult). Supply risk reflects an increased likelihood that the materials market will not be able to deliver the resource at a price which is acceptable. This unavailability can occur for geophysical, political, and logistical reasons.
An examination of the literature reveals that several authors have already reviewed the metrics that have been proposed to measure vulnerability and supply risk. Reference Erdmann and Graedel14,Reference Achzet and Helbig15 These reviews insightfully discuss the relative merits of the proposed metrics and weighting schemes. Here we attempted to build on that foundation by exploring a central element of these assessments—the models used to project materials flows, particularly production and consumption, and, thereby, to compute the proposed metrics of importance and risk.
Models of future production and consumption are central to at least one element of every proposed scheme for evaluating criticality risk. Two types of metrics that depend on projected future material flows are those measuring (i) importance and (ii) general availability. Both indicators are based on qualities that (a) are not directly measurable and (b) are generally focused on an unrealized future—attributes whose derivations rely upon a model-based assessment.
This paper reviews the modeling methods that have been applied to estimate future materials use and availability-derived supply risk within studies of materials criticality. In examining material flow dynamics, particular emphasis is given to the endogenous treatment of economic feedback within these models and the resulting implications on materials flows. Generally, we observe that material projection methods can be classified broadly as (a) those which project material flows only and (b) those which use market modeling to explicitly simulate (endogenously) the associated economic behavior and its implication on material flows. The paper concludes with some observations about research needs in this important space.
Review of metrics of criticality
A number of studies on resource criticality include proposed criticality metrics and evaluation schemes. While terminology varies across these studies, several consistent themes emerge. This section summarizes those themes and the most common metrics that have been proposed. Specifically, this section considers twelve English-language studies (considering multiple updates as one study) that proposed a general method for criticality assessment. These studies include the following: Yale Reference Graedel, Barr, Chandler, Chase, Choi, Christoffersen, Friedlander, Henly, Jun, Nassar, Schechner, Warren, Yang and Zhu16 ; National Research Council (NRC) 17 ; Department of Energy (DOE) 18 ; General Electric (GE) Reference Duclos, Otto and Konitzer19 ; Resource Efficiency Knowledge Transfer Network (RE-KTN)/Oakadene Reference Morley and Eatherley20 ; European Commission (EC) 21 ; Institute for Defense Analysis (IDA) Reference Thomason, Atwell, Bajraktari, Bell, Barnett, Karvonides, Niles and Schwartz22 ; United Nations Environmental Programme (UNEP) Reference Buchert, Schüler and Bleher23 ; Joint Research Center, Institute for Energy and Transport (JRC-IET) Reference Moss, Tzimas, Kara, Willis and Kooroshy24 ; Leeds Reference Roelich, Dawson, Purnell, Knoeri, Revell, Busch and Steinberger25 ; RIT Reference Goe and Gaustad26 ; and Volkswagen AG and the Federal Institute for Geosciences and Natural Resources (VW-BGR). Reference Rosenau-Tornow, Buchholz, Riemann and Wagner27 Throughout this section, we will refer to these studies by the abbreviations shown in parentheses and/or italicized in the list for the cases when an organization has performed the assessment.
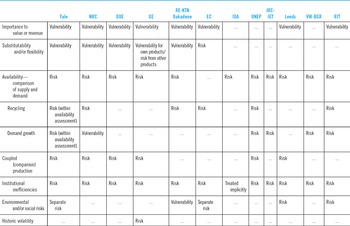
All of the reviewed overview studies agree that criticality is an emergent system property, deriving from the confluence of supply risk (limited availability) and vulnerability (impact of supply disruption). When considering these issues, each study adopts a somewhat unique set of metrics to structure its assessment. Despite this diversity, the metrics used can be broadly categorized as centering upon one of approximately six characteristics of a material system. Table 1 describes how we have categorized the specific approaches of each study into these categories. Specifically, the six categories are:
-
(i) Contributing to vulnerability
-
(a) Importance to value or revenue
-
(b) Substitutability
-
-
(ii) Contributing to supply risk
-
(a) General availability
-
(b) Co-production
-
(c) Institutional inefficiencies
-
(d) Environmental and/or social risks
-
Summary of the literature on critical assessment approaches. Labels refer to the following references: Yale Reference Graedel, Barr, Chandler, Chase, Choi, Christoffersen, Friedlander, Henly, Jun, Nassar, Schechner, Warren, Yang and Zhu16 ; NRC 17 ; DOE 18 ; GE Reference Duclos, Otto and Konitzer19 ; RE-KTN/Oakadene Reference Morley and Eatherley20 ; EC 21,28 ; IDA Reference Thomason, Atwell, Bajraktari, Bell, Barnett, Karvonides, Niles and Schwartz22 ; UNEP Reference Buchert, Schüler and Bleher23 ; JRC-IET Reference Moss, Tzimas, Kara, Willis and Kooroshy24 ; Leeds Reference Roelich, Dawson, Purnell, Knoeri, Revell, Busch and Steinberger25 ; VW-BGR* Reference Rosenau-Tornow, Buchholz, Riemann and Wagner27 ; and RIT. Reference Goe and Gaustad26

In the list above, we have grouped the six market features into those generally associated with influencing vulnerability and those which influence supply risk. These groupings are consistent with the majority of the studies reviewed, but there is no consensus with some studies organizing these groups differently. The following sections explore approaches to evaluating the state of these features and Table 1 summarizes each study's treatment of vulnerability versus risk for the features.
Sidebar: When discussions cross disciplines, terminology runs the risk of obscuring meaning, despite the intention underlying their introduction. Resource scarcity relies upon comparisons between “production” and “consumption” and between “supply” and “demand.” “Supply” and “demand” are concepts drawn from the field of economics, each characterizing behavior of firms and consumers that is contingent upon a given price. In contrast, “production” and “consumption” describe the flows of goods and services in a market, where “supply” and “demand” behaviors interact.
While resource scarcity is fundamentally centered upon questions of the balance between consumption and production, the strategies used to model materials markets when exploring scarcity typically blend consideration of (a) the mechanics of production (e.g., firm expansion, technologies) and consumption (e.g., economic activity, population growth) and (b) the economic behaviors that underlie and incentivize firm and consumer actions (e.g., profit, utility). While deeply interrelated, conflation of these terms can lead to discussions where participants end up talking past one another. We will try to be consistent in our use of these terms, even when the cited papers use other terminology.
Importance of the material
Probably, the most conceptually straightforward aspect of any criticality assessment is the idea that a critical resource must be an important one. To the stakeholder from whose perspective the assessment is carried out, the resource must serve some essential function and do so at a level of performance that no other resource can deliver at the same cost. Criticality, then, emerges because the absence of access to the resource creates vulnerability for some stakeholders — without access to the resource, they are no longer able to realize that critical functionality.
Interestingly, despite universal agreement that criticality requires vulnerability and risk, several studies do not explicitly assess importance. The circumstances under which this apparent incongruity emerges include: (a) when studies focus on material resources that are established by another set of stakeholders (IDA); (b) when materials are declared important owing to some clear categorization (e.g., needed for energy technologies) (UNEP and Moss); or (c) when a study expressly focuses only on supply risk (VW-BGR).
The studies that do explicitly assess importance use metrics of intensity of resource use or the implications of that intensity. Depending on the stakeholder being considered, these metrics include resource consumption (measured in tons) (DOE, Yale, and RE-KTN), firm (or sectoral) revenue from the resource (Yale and GE), or the economic contribution of the resource to the sector of interest (Leeds) or the economy as a whole (NRC, EC, Yale, and RIT).
Substitutability
Ultimately, the impact of a supply constraint is reduced if it is possible to replace the existing material with an alternate. In many applications, such replacements, or substitutions, are familiar and well developed (consider the options to construct a building from wood, steel, concrete, or masonry). Unfortunately, for critical materials, it is effectively definitional that opportunities for substitution are limited and/or costly, at least in the focal applications.
Because of the potential importance of substitution in mitigating criticality risk, it is not surprising that most studies include some metric of this attribute. Generally, this metric is qualitative in nature and based on expert opinion. Yale proposes a system which provides more nuanced insight into vulnerability (or lack thereof) due to substitution by suggesting indicators that resolve several aspects of substitutability: relative performance (technical and economic), relative availability, and relative environmental risk. Other studies base their qualitative scores on more aggregate guidance. For example, the NRC study recommends that substitutability be evaluated in terms of the scale of the impact (i.e., by how much will a substitute impact performance and/or cost and how much of a firm's portfolio or a region's economy is impacted by the absence of a substitute) which is strongly determined both by technology and the timeframe within which a supply chain is forced to react.
General availability
In popular discussions of criticality, the question most commonly raised is “Will we run out of material X?” — will demand for a resource exceed the total quantity available from the earth's crust? All recent studies of criticality point out that this question is generally ill-posed. The ultimate supply of a resource within the earth is often vast (at least compared to current rates of use). The study on criticality developed by the European Commission probably makes the strongest statement on this issue: “The Group considered that geological scarcity is not an issue for determining the criticality of raw materials...” (Ref. 28, p. 16).
Instead of focusing on total geophysical availability, the reviewed studies agree that the more appropriate question is whether the materials market can satisfy demand at a price and rate that does not impede the deployment of a technology of interest or some broader economic activity. To understand the risk that demand will outstrip economical supply, all of the studies reviewed evaluated some measures of general availability by comparing various components of the balance between supply and demand.
The most prevalent measures of availability directly compare estimates of future demand and supply. The simplest metric of this form estimates depletion time (as labeled by Graedel et al. Reference Graedel, Barr, Chandler, Chase, Choi, Christoffersen, Friedlander, Henly, Jun, Nassar, Schechner, Warren, Yang and Zhu16 ) as the ratio of supply to current production (an implicit proxy for future production). Supply is most frequently estimated based on published reserves (UNEP, RE-KTN, VW-BGR, NRC, and RIT) and, in at least two cases, reserve base (NRC, VW-BGR, and RIT). The VW-BGR study extends this concept by also extrapolating historic demand patterns and comparing those to expected expansions of the supply base. Yale proposes a more detailed model to understand future primary demand that explicitly considers both expected future consumption (as opposed to using current consumption as a proxy) and expected future recycling. Of the other studies reviewed, four others (DOE, IDA, JRC-IET, and Leeds) also explore the balance of supply and demand by first developing detailed forecasts for demand (primarily based on demand for a specific technology and the expected materials intensity of that technology) and comparing that to information about relevant supply. The GE study also implies that such a comparison is part of its scoring, but the method is not defined.
As noted above, one study (EC) explicitly excludes depletion time from its metrics of risk. Nevertheless, this same report develops detailed projections of future demand and compares these to both current demand and measures of supply, noting that such information is relevant to both understanding future importance (page 32) and limitations on availability (page 39).
In addition to a direct comparison of expected future supply and demand, some studies also proposed novel complementary metrics. Several studies including NRC, EC, UNEP, and RIT specifically consider recycling rate as an indicator of risk. Also, Rosenau-Tornow et al. Reference Rosenau-Tornow, Buchholz, Riemann and Wagner27 propose several novel indirect (and likely quite informative) indicators, including relative levels of inventory, mine and refinery capital utilization, operating costs, and levels of investment in exploration and mining.
Irrespective of the metric, questions about availability risk are fundamentally grounded in prediction. Developing an understanding of that risk requires assessing future behavior. From the literature, it is clear that such assessments can rely on increasingly sophisticated models of future materials demand and supply.
Coupled (companion) production
In the context of these studies, coupled production refers to the situation where the material in question is not the primary economic driver of the mining activities on which its current production depends. A widely cited example of this is indium, an element that is used in the production of liquid crystal displays and that is primarily produced as a co-product of zinc mining and refining. Reference Reuter and Verhoef29–Reference Kapilevich and Skumanich31
Coupled production is generally cited as a criticality risk because it weakens the responsiveness of the materials supply to economic forces. A classical narrative within the discussion of resource scarcity is that conventional market mechanisms mediate scarcity risk. In this narrative, the market mitigates scarcity risks because increasing scarcity would drive prices higher, in turn, stimulating (in part) both new investments in capacity and innovations in extraction technology. Coupled production necessarily weakens the impact of price signals because the profitability of the primary product (almost by definition) dominates firm decision-making. Additionally (and possibly most importantly), mining firms are unlikely to monitor the market trends of economically minor co-products.
Within the studies reviewed, coupled production risk was considered in six of them and was either evaluated qualitatively through expert input or quantitatively as the fraction of relevant production that derives from coupled production.
Institutional inefficiencies
For decades (if not centuries), discussions of materials availability have focused on economically viable geophysical availability. Recent discussions of materials criticality have highlighted a point that managers of strategic (military) materials and supply-chains have realized for some time—even a short term lack of availability can have large implications to a firm, a fighting-force, or an economy. Short term availability is not determined by geophysics, but instead by logistical, political, economic, and other social realities. Collectively, these are the institutions that affect the exchange of resources within the supply chain. Failures of these institutions can result in (short-term) unavailability.
As a consequence, nearly all of the studies reviewed considered metrics that reflect the departure of institutions from an idealized well-functioning system. The most common issue evaluated was the concentration of supply (i.e., the existence of oligopolistic or monopolistic suppliers) either in terms of geographic location or supply ownership. In many cases, these measures are weighted by or supplemented with composite metrics of the political, social, or economic stability of the state within which production occurs.
Environmental risk
Three studies expressly consider aspects of environmental performance in assessing criticality. One study (EC) considers the risk of environmental regulation and how that might impact supply from a particular location. Four others (Yale, RE-KTN, RIT, and Leeds) assess environmental impact as a general indicator of risk, which may cause future supply to be restricted due to economic, regulatory, or social implications.
Summary of metrics of criticality
This section has provided an assessment of several metrics of criticality; the authors point readers to reviews of these studies and the studies themselves (Erdmann Reference Erdmann and Graedel14,Reference Achzet and Helbig15 ) for a more in depth treatment of the metrics and how they might be scored or weighted. Instead, this review focuses on the treatment of dynamics embedded in these approaches because assessing criticality risk is inherently a future looking endeavor. Each of the materials system characteristics discussed here, not to mention their implications on criticality, cannot be reliably expected to remain constant over the likely planning horizon of any agent seeking to address a criticality challenge. Three of the features—importance to value or revenue, general availability, and co-production—are largely associated with the techno-economic features of production; substitutability adds the techno-economic implications of derived demand upon the market dynamic; and the last two features—institution inefficiency and environmental/social risks—expand the scope beyond the economic and technological into organizational behavior, geopolitics, and the environmental sciences. Clearly, these features are likely to change over time.
This indeterminacy over time indicates that some mechanism for prediction would be necessary to effectively assess criticality risk. Typically this manifests as a modeling tool. Although this is true for all of the aspects of criticality risk, within the literature to date only two aspects have been explored through the modeling of future behavior, importance, and general availability. (The only exception to this trend identified by the authors is the study by Roelich et al., Reference Roelich, Dawson, Purnell, Knoeri, Revell, Busch and Steinberger25 which also projects supplier concentration and environmental risks over time.)
Acknowledging the apparent need for modeling, it is not uncommon to find that “importance” and “availability” characteristics of materials markets are nevertheless treated as intrinsic materials properties whose values are reducible to simple economic or geophysical accounting. Worse, this oversimplification can be an attractive short-cut in criticality policy discussions.
The challenge for those who study criticality risk is to find techniques for assessing importance and availability that avoid this shortcut, giving appropriate consideration to the techno-economic dynamics of real systems. The next section of this paper explores the modeling approaches used in the assessments of specific critical materials.
Modeling material flows and markets
To quantify availability-derived risk, most studies develop models to estimate future supply and/or future demand. There is a significant corpus of work, generally categorized as material flow analyses (MFA), which examines such flows of materials, including production and/or consumption to comment on sources of dissipation or the general state of the system. Reference Chen and Graedel32 For the topic at hand, we are specifically interested in dynamic MFA, which capture changes in material flow over time. (In the MFA literature, dynamic means exclusively that a study tracks multiple points in time, rather than referring to any information feedback as will be discussed below. Reference Mueller, Hilty, Widmer, Schluep and Faulstich33 ) For this review, we do not focus on which specific materials have been tracked (for a detailed review of this and other MFA methodological concerns, see Chen and Graedel Reference Chen and Graedel32 and Mueller et al. Reference Mueller, Hilty, Widmer, Schluep and Faulstich33 ), but rather we build on these previous reviews to discuss how the flow of that material may be modeled and expand the set of studies examined. We do this for ∼45 articles within the relevant literature that describe models that estimate the flows attributable to supply or demand.
We break the discussion of modeling methodology into two main sections. The first deals with topics relevant to the unit of study (or focus) including (a) the level of aggregation in the model and (b) the framing of the model around either materials only (direct) or products then materials (derived).
The second, more significant section, then describes the choice of mechanism (or mechanisms) by which the modeled system's structure evolves over time (more specifically, the magnitude of supply and demand or volume flows of production and consumption). At one end of an axis, the evolution of those flows derives exclusively from physical aspects, while on the other end economic behavior influences the evolution of these physical flows. In other words, setting the relative model structure with primarily independent supply and demand representations provides a largely exogenous view of market function, while providing a mechanism by which the two interact enables some degree of economic endogeneity in the investigation. The “Review of metrics of criticality” section is therefore subdivided into approaches that (a) model system behavior applying only physical flows and (b) those that consider feedback within the economic market–market modeling.
Unit of study
Model granularity
A significant challenge in modeling is to determine the right locus of aggregation to answer the question posed by the analysis (e.g., geographic region, end use sector, material specificity, etc.). Too much detail can be more blinding than illuminating, while too much aggregation may obscure fundamental trends. Throughout this assessment, we will comment on where increased granularity has provided value in framing inquiry.
Framing the flow model-materials or products
At a high level, studies in the literature model material flows either through a direct or derived route. That is, the inquiry is primarily framed around modeling the flow of materials directly or that flow is derived through modeling the flows of products in which materials are incorporated. This distinction is most relevant to the modeling of demand for materials or products.
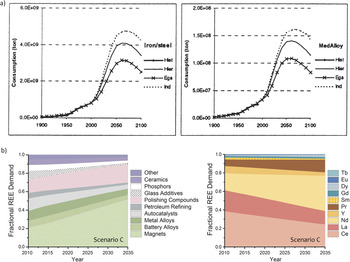
In a direct model, as the name implies, any change in driving factors leads explicitly to a direct change in the material flow itself. As examples of the direct approach, van Vuuren and co-authors model aggregate flows across not only all end uses, but also several materials including iron and copper, while Sverdrup et al. develop individual direct models for copper, silver, and rare earth elements. Reference van Vuuren, Strengers and De Vries34,Reference Sverdrup, Koca and Ragnarsdottir36 The latter develops end-use specific parameters, but materials are considered in a direct manner. Figure 1(a) shows an exemplary result from van Vuuren where direct flows are modeled at an aggregated level. To a degree, this direct modeling of materials is a type of exogenous tracking as the authors have input the quantity of material explicitly for each end use. Reference Van Vuuren, Bouwman and Beusen37 The clear strength of the direct modeling approach is that it facilitates a more comprehensive scope of analysis. In most cases in the literature, the entire material system is expressly modeled. Even in cases where the modeled material system is segmented [e.g., Hatayama et al. Reference Hatayama, Yamada, Daigo, Matsuno and Adachi38 and Alonso et al. Reference Alonso, Sherman, Wallington, Everson, Field, Roth and Kirchain35 as shown in Fig. 1(b)], the data used in the analysis provide a clear approach to capture the entire market. Direct models, however, do not provide an explicit way to model changes in technology (including materials composition) or revolutionary changes in context (including product demand).
A key decision for any study modeling future flows is the level of aggregation across, for example, sectors and regions. (a) The aggregated direct analysis of van Vuuren et al. Reference van Vuuren, Strengers and De Vries34 for iron (left) and MedAlloy (a composite of Cu, Pb, Zn, Sn, and Ni) (from Fig. 6 of the same). (b) A disaggregated analysis which uses direct modeling of rare earth element flows broken down by end use and element (Fig. 2 from Alonso et al. Reference Alonso, Sherman, Wallington, Everson, Field, Roth and Kirchain35 ).

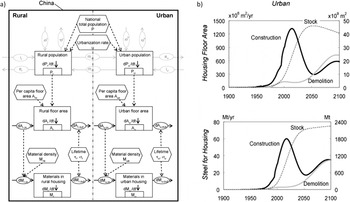
In contrast, a derived model recognizes that materials are contained within products and that the real value of the material is nearly always found in the utility it creates within the products themselves. As a result, a more embedded way of modeling the quantity of material flow accounts for it indirectly from assumptions around product flows and materials content per end-use product. This derived assessment of either form of consumption means that product trends are modeled and then translated to material flow through a material intensity per product. Reference Elshkaki, van der Voet and Loeffe39,Reference Zuser and Rechberger40 As an example of this approach, Busch et al. Reference Busch, Steinberger, Dawson, Purnell and Roelich41 pursue a derived model by developing a highly granular, hierarchical derivation of material content wherein they track infrastructure (e.g., vehicles providing transportation), technology (e.g., the vehicles themselves), components within technology (e.g., batteries, motors, etc.), and material content within components. Analogously, Hu et al. developed a derived demand model of steel demand in China attributable to a detailed assessment of housing stock expansion. (See Fig. 2 for a schematic of the derived demand approach as applied by Hu et al. Reference Hu, Pauliuk, Wang, Huppes, van der Voet and Muller42 ) Bollinger et al. develop a very detailed derived flow model which tracks the flow of cell phones (and the metals within them) among numerous stakeholders. Reference Bollinger, Davis, Nikolic and Dijkema43 This model shows the richness of insight possible within a derived model, but also its possible limitation in that only the materials within one end use are tracked.
An example of a derived demand model where material flows map to demand for the corresponding good. In this case, steel flows are mapped to demand for housing. (a) The conceptual mapping between housing demand and material flows (Fig. 2 from Hu et al. Reference Hu, Pauliuk, Wang, Huppes, van der Voet and Muller42 ). (b) The resulting analysis of the same (from Fig. 4 of the same).

A notable feature of derived models is how material content is modeled, particularly over the time horizon of the assessment. Within a derived model, materials content within the product may change over time as technology evolves. This concept is often implemented as a learning curve (typically manifesting as dematerialization, so material intensity decreases over time) leading to dynamic derived materials content. Reference Elshkaki, van der Voet and Loeffe39,Reference Daigo, Osako, Adachi and Matsuno44 Derived models offer benefit in that they provide an explicit way to model changes in technology and demand for that technology, inverse of the direct approach.
Finally, studies may also use some combination of direct and derived modeling as a function of data availability or study focus. Reference Alonso, Sherman, Wallington, Everson, Field, Roth and Kirchain35,Reference Elshkaki, van der Voet and Loeffe39,Reference Zuser and Rechberger40 As will be discussed in more detail below, often the mechanism of evaluating future demand dictates whether a model estimates material availability through direct or derived approximation.
Model mechanism
Basic material flow models
Once one has framed the modeling of flows, either a direct or a derived model (or a combination of the two), the next decision is how to implement the mathematical model which will project future flows. There are several methods to quantitatively project physical flows for production and consumption, or, in the language of dynamic MFA, inflows, stocks, and outflows.
Demand
Flows of future consumption may be estimated using empirical models of historic consumption of the material (or product, if derived) based on simple time-series regressions. These extrapolations are most commonly executed in terms of time and of several forms including constant, linear, Reference Roelich, Dawson, Purnell, Knoeri, Revell, Busch and Steinberger25,Reference Park, Hong, Kim, Lee and Hur45,Reference Yan, Wang, Chen and Li46 and exponential, assuming a constant consumption growth rate. Reference Cheah, Heywood and Kirchain47 In decomposing consumption, model granularity has been implemented in the form of highly disaggregated product sectors, regional-specificity, and compositional detail. Hatayama, Daigo, and co-authors develop consumption estimates that contain compositional, end use, and regional details in modeling the future flows of aluminum and its alloying elements in buildings, transportation, electrical equipment, and consumer durables in the EU, US, Japan, and China. Reference Daigo, Osako, Adachi and Matsuno44,Reference Hatayama, Daigo, Matsuno and Adachi48,Reference Hatayama, Daigo, Matsuno and Adachi49 These approaches are exogenous by nature and are based on historical data so they therefore assume that the past patterns of behavior are largely consistent with those in the future and, more specifically, that the continuation of that trend does not in fact alter the level of demand in subsequent periods. To comment on availability-derived risk, simple approximations may just compare these future demand projections against current production rate extrapolated out to the year of interest. Reference Zuser and Rechberger40 Alternatives to this approach will be explored in the section below.
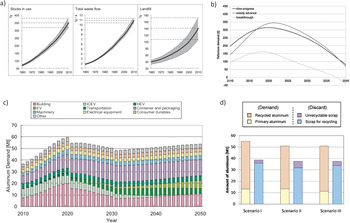
Scenario-based approximations of consumption provide a more complex route of establishing future consumption. Examples of scenario development are shown in Fig. 3. These scenarios build up consumption from the bottom up based on particular changes in technology such as hybrid vehicle penetration, Reference Hatayama, Daigo, Matsuno and Adachi49,Reference Gruber, Medina, Keoleian, Kesler, Everson and Wallington50 wind energy, Reference Alonso, Sherman, Wallington, Everson, Field, Roth and Kirchain35 or photovoltaic adoption. Reference Zuser and Rechberger40,Reference Marwede and Reller51 Scenarios may be linked to expected population growth or projected gross domestic product (GDP), where the penetration of a technology is modeled as a function of GDP. Reference Alonso, Sherman, Wallington, Everson, Field, Roth and Kirchain35,Reference Gruber, Medina, Keoleian, Kesler, Everson and Wallington50,Reference Gerst52 They may also combine published forecasts with a synthesis of market data. Reference Buchert, Schüler and Bleher23 As another example of scenario-based estimates, based on European Commission scenarios for clean energy and materials intensities, Moss et al. estimate energy related consumption for materials, Reference Moss, Tzimas, Kara, Willis and Kooroshy24 the US DOE performs a similar form of scenario assessment to project demand. 18 Highly resolved scenarios provide particular insight into how technology evolution impacts materials requirements. Recent work from Yale has provided significant detail in a multi-level scenario projection for energy use, which enabled commentary on the impact policy on critical materials use as a function of energy source, electricity technology, and alternatives within technology. Reference Elshkaki and Graedel53
In modeling physical flows, studies make important decisions about how to capture the impact of socioeconomic drivers of demand, the level of aggregation within their analysis, and the extent to which various scenarios of an unrealized future are tested. (a) Some studies explore a particular scenario in detail (reproduced from Gloser et al. Reference Gloeser, Soulier, Espinoza, Faulstich, Eberlein and Martínez-Moyano54 ), while other (b) explore a range of uncertain future scenarios (reproduced from Marwede and Reller Reference Marwede and Reller51 ). In limited cases (c) authors had the resources to explore both flow detail and (d) future scenarios (reproduced from Hatayama et al. Reference Hatayama, Daigo, Matsuno and Adachi49 ).

Secondary supply
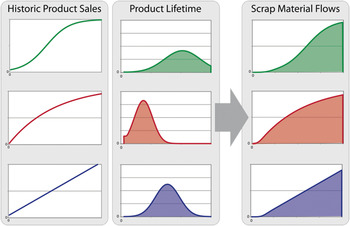
For future scrap use, many authors use a form of physical feedback, termed stock driven, service demand scenario, or population balance model (term coined by Hatayama et al. Reference Hatayama, Yamada, Daigo, Matsuno and Adachi38 ). Irrespective of the name, these modeling approaches multiply (a) lifetime distributions (i.e., the time after consumption when the product is disposed of, by end use), (b) collection rate (by end-use), and (c) rates of inflow into the stock-in-use (or past demand) Reference Park, Hong, Kim, Lee and Hur45,Reference Elshkaki and Graedel53,Reference Bouman, Heijungs, van der Voet, van den Bergh and Huppes55 to project the nature and magnitude of the future supply of secondary materials. Historic data on inflow rates could be based on sales information or apparent consumption; however, projections of future inflow (demand) are estimated through methods described in the previous paragraph. Using this approach, scrap flows are modeled via physical flow feedback to production (shown in Fig. 4); few studies lack this aspect of physical feedback.
Conceptual map illustrating the role of life time in determining production from secondary materials. This modeling approach is adopted in a number of relevant studies including Ref. Reference Busch, Steinberger, Dawson, Purnell and Roelich41, Reference Park, Hong, Kim, Lee and Hur45, Reference Elshkaki and Graedel53, and Reference Bouman, Heijungs, van der Voet, van den Bergh and Huppes55.

This stock driven approach to secondary supply can also vary in level of aggregation, for example, based on their hierarchical structure. Busch et al. track subcomponents within products that have differential in-use dynamics and lifetime characteristics, providing a high level of detail. Reference Busch, Steinberger, Dawson, Purnell and Roelich41
Primary supply
Material required to meet demand from primary resources is most commonly estimated as the difference between the total demand and this recycling-based secondary supply. Reference Elshkaki, van der Voet and Loeffe39 The resulting extraction volume required may then be modified by efficiencies in the production processes (mining, concentration, smelting, base metal separation, and refining).
There are a few more complex models of primary supply developed based on estimation of the relationship between reserves and geopotential resources or estimated based on detailed information about announced projects. Reference Rosenau-Tornow, Buchholz, Riemann and Wagner27 Northey and co-authors develop future supply scenarios based on ultimate recoverable resource (URR) by deposit type to determine ore grade decline factoring new potential mining projects as a function of technology improvements, lifetime, and production rates. Reference Northey, Mohr, Mudd, Weng and Giurco56 This is a dynamic model of supply developed for several mineral and fossil fuel resources. They include an interaction between demand and supply wherein the demand is computed based on the fractional difference between demand and supply in the previous year. Because of this interaction term, this last example provides a more integrated perspective on the flows of materials than previous examples, but without any explicit consideration of economic information. The role of economics in these assessments is explored in detail in the next section.
Considering economic drivers
All of the methodology development studies described in the metrics of criticality section above define criticality as the inability for a material market to satisfy demand at a price and quantity that does not impede technology deployment. (The specific wording of this concept varies across these studies, but the sentiment holds for all.) In fact, price has often been cited as the ultimate metric of general availability (see Hotelling Reference Hotelling5 and other economic studies referenced in the Introduction) and previous authors have looked at its diagnostic value empirically. Reference Gleich, Achzet, Mayer and Rathgeber13
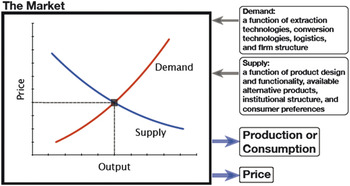
This central role of price and its implied influence on the future strongly points to the value of including economic information within the models and projections used to evaluate criticality. Models that are only a function of time do not explicitly incorporate the effect of changing economic conditions and, therefore, are more limited in the types of insights that can be gleaned. We use the term “market model” below to distinguish assessments of supply and demand that include endogenous economic feedback to capture implication of market function, contrasted with MFA, which typically does not. First, we explore the incorporation of economic variables through econometric analyses of consumption, which leads us to more complex regression models describing intensity of use through Hubbert and Kuznets curves. Finally, we explore in detail market models that simulate the supply/demand interaction via explicit feedback mechanisms. This mechanism is shown schematically in Fig. 5.
Schematic of supply and demand curves and their intersection.

The most prevalent way in which economic information enters the assessment of general availability is through studies which develop models that go beyond the use of univariate regression of consumption as a function of time (as mentioned in the physical flows estimation section). Instead, a number of studies have developed consumption models that are driven by a broad array of socioeconomic variables. This has included variables such as product or material price, GDP, population growth, average household size, level of urbanization, or industrial production. Reference Hu, Pauliuk, Wang, Huppes, van der Voet and Muller42,Reference Gerst52,Reference Elshkaki, van der Voet, Timmermans and Van Holderbeke57 Economic information has also been included within the learning curves associated with materials intensity where the price of the material influences the degree of learning. Reference Hatayama, Daigo, Matsuno and Adachi49,Reference Zeltner, Bader, Scheidegger and Baccini58 Generally, models of future production can also be built either as a function of time (i.e., without explicit economic information) or as multivariate relationship considering many economic features. As mentioned in the physical flows section, there are many fewer studies that focus on detailed modeling of production within this set of literature.
Intensity-of-use hypotheses
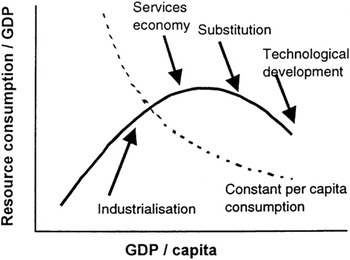
The development of demand based on intensity-of-use hypotheses (metal consumption per unit GDP based on expected growth) also represents common socioeconomic approaches to consumption modeling either alone or in combination with other factors such as regional income and population change. Reference van Vuuren, Strengers and De Vries34,Reference Hatayama, Daigo, Matsuno and Adachi48 Intensity of use models likely aggregates material use across products, thereby using a direct approach to material tracking, but may differentiate material use by region. Reference van Vuuren, Strengers and De Vries34,Reference Kapur59 This economically derived approach to the relationship between supply and demand is linked to the so-called Hubbert curve Reference Hubbert60 (and related Environmental Kuznets curve Reference Kuznets and Simon61 ), which estimates that production (or emission) of a substance will peak (at least when normalized by population or economic activity). Related to materials availability, these models often derive a relationship between the revenue from extraction of a resource leading to increasing investments resulting in increased extraction. Reference Scholz and Wellmer62 As shown in Fig. 6, models of this form assume that intensity of use follows a particular trajectory as societies develop and then saturate in their demand for a particular material or substitute to other higher performance alternatives. An example of the application of this to critical materials is in the work of Kapur. Reference Kapur59 Kapur explores how copper use will evolve as India develops under three economic and policy-based scenarios. The use of Hubbert curves embeds several assertions including that one can perform a regression on the combined trajectory of supply and demand using explanatory variables such as price, extraction, discovery, depletion, and population. Reference Sverdrup, Ragnarsdottir and Koca63 Hubbert curves have been described in the literature to provide early warning indicators, and to hint at the urgency of technology innovation or adaptation of the demand across fossil fuels, metals or strategic minerals such as phosphorus. Reference Seyhan, Weikard and van Ierland64
Example of schematic of the intensity of use models applied in some studies of critical materials.

Market modeling-endogenous feedback
There are a few examples in the literature where studies have developed more sophisticated models to capture endogenous feedback in determining future supply and demand. In these cases, the endogeneity manifests as explicit consideration of feedback between particular agents in the system and this feedback modifies the resulting flows. A few previous articles have outlined the importance of linking material flow analysis with economic feedback effects and, ultimately, into partial equilibrium simulation models. Reference Gloeser, Soulier, Espinoza, Faulstich, Eberlein and Martínez-Moyano54,Reference Bouman, Heijungs, van der Voet, van den Bergh and Huppes55,Reference Knoeri, Waeger, Stamp, Althaus and Weil65 Gloeser et al. and Knoeri and co-authors have described value in integrating these methodologies to provide a more complete picture of supply and demand evolution, while Bouman et al. focused on applications of feedback in waste and environmental management. Reference Bouman, Heijungs, van der Voet, van den Bergh and Huppes55
These studies also differ in their degree of aggregation or specificity as described in the physical flows section. For example, primary production may be based simply on the difference of aggregate consumption and aggregate secondary production. Reference Elshkaki66 In other circumstances, supply may be explicitly tracked either analytically Reference Poulizac67 or the curve may be modeled through empirical, stepwise curves representing each producer. In this last case, highly granular models may formulate an upward-sloping short-run current supply curve, by disaggregating supply by mine (based on the assumption that an individual supplier will produce up to a certain quantity at a given cost). Reference Alonso68
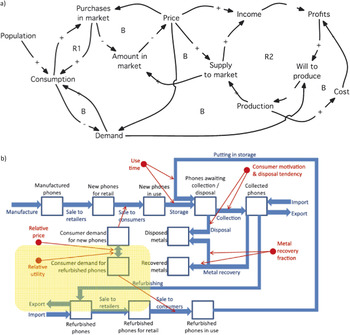
The main form of feedback within materials market models is economic information regarding potential production or consumption that is contingent upon price. More specifically, supply and demand functions are linked through a price clearing mechanism; increased demand leads to higher price, while more supply lowers price. This nature of interaction is captured very clearly [see Fig. 7(a)] in a schematic model illustration in the work of Sverdrup et al. which explores the global flows of silver. Reference Sverdrup, Koca and Ragnarsdottir36 The literature has described a few general, but related, approaches to this endogenous determination of the potential mismatch between supply and demand through market feedback. The key characteristic that distinguishes these analyses comes in the type of signaling (alternately, market clearing or feedback mechanism) that is implemented in the model and therefore influences physical flows. In one type of market clearing, price is set through the interaction between unobservable market characteristics such as the supply curve and demand curve. The other type of market clearing adjusts price based on observable characteristics such as current inventory levels.
Market models which include explicit feedback between supply and demand provide insight into how a market might respond to projected changes. (a) A high level schematic of the influence of price in a model developed by Sverdrup et al. to study silver flows (from Fig. 9 in the same). Reference Sverdrup, Koca and Ragnarsdottir36 (b) The interactions in a model developed by Bollinger to study material flows attributable to mobile devices (from Fig. 2 in the same). In both cases, the highlighting of the locus of price within the schematic was added. Reference Bollinger, Davis, Nikolic and Dijkema43

An early example of the first mechanism in the literature comes from van Vuuren et al., which developed a supply and demand model with endogenous price feedback to study iron (as a proxy for all abundant metals), and a bundled market of metals of intermediate availability (Cu, Pb, Zn, etc.). Reference van Vuuren, Strengers and De Vries34 In this model, price is primarily driven by the cost to expand and operate supply to meet demand. These costs are informed by both a declining ore grade and improving state of extraction technology. Consumption is primarily driven by a peaking model of intensity of use but is moderated in the short run by changes in prices. In this study, supply and demand have been analyzed in an aggregated “one world” model without specific details on demand sectors or suppliers. They develop the model to understand how different exogenous economic and policy developments would impact the use of metals over the next century.
Elshkaki has modeled a constant-elasticity supply function to determine price. Reference Elshkaki66 In part, this approach results from the implicit way supply was modeled here (see above). The goal of this work is to understand how fuel cell adoption would impact the production of Pt and its primary co-mined metals, Ni and Cu. As described above, this model has econometrically determined direct demand/consumption functions for non-automotive use driven by GDP, price, and time. Another approach solves an inverse demand function (an analytical expression of the unobservable demand curve) to derive the market-clearing price, an approach consistent with the related economic literature. Reference Murto, Nasakkala and Keppo69 An example of this approach can be found in the system dynamics model described within Bollinger et al. Reference Bollinger, Davis, Nikolic and Dijkema43 The goal of this contribution (and the thesis from which it derives) is to explore the flow of selected materials (gold, copper, silver, and palladium) in mobile phones. This model uses a version of an inverse demand function with nonconstant elasticity where price fluctuates within 50% of a base price multiplied by the ratio of demand to supply (i.e., driven by the supply/demand imbalance or mismatch). As is shown in Fig. 7(b), within the Bollinger et al. model, price clearing is focused on product sector activities (e.g., price of secondary phones) but leads to derived implications for the materials contained in the phones. This is an economic version of the supply/demand interaction described by Northey. Reference Northey, Mohr, Mudd, Weng and Giurco56 Bollinger et al. provide a perspective different from those of the other examples described in this section, because the model remains primarily at the level of the phone and so does not capture other end uses for the materials in question. Reference Bollinger, Davis, Nikolic and Dijkema43
In a more complex form of capturing market signaling, modelers may directly solve for the intersection of supply and demand either numerically or analytically. Reference Poulizac67,Reference Urbance, Field, Kirchain, Roth and Clark70 Here models may be developed where market clearance occurs through the actions of a simulated market-maker that aggregates financial information from producers to set the price at which the ideal supply meets the anticipated demand. This price may be averaged with price in the previous period to modulate significant price excursions. This resulting price then dictates the simulated consumption rate.
To implement an alternative type of feedback mechanism, modelers adjust price based on observable changes in inventory. In other words, price change is modeled as a function of inventory coverage, where inventory coverage is the ratio of the current inventory over the shipment (sales) of the product. Reference Flemings71 More specifically, the market clearing mechanism formally examines the size of this inventory coverage and adjusts prices according to the simulated level of coverage as compared to a targeted level of coverage. Sverdrup, Kifle, and co-authors have performed endogenous assessments of the supply of rare earths, silver, and copper using an observable change model, although the specific details are not fully transparent within the publications. Reference Sverdrup, Koca and Ragnarsdottir36,Reference Sverdrup, Ragnarsdottir and Koca63,Reference Kifle, Sverdrup, Koca and Wibtoe72
Another instance of an inventory-style mechanism for price determination in the literature around materials availability is found in the agent-based models developed by Bollinger et al. Reference Bollinger, Davis, Nikolic and Dijkema43 That work also provides evidence of the value of disaggregation in terms of activities and actors within the system and of the value of capturing the distinct decision-context of distinguishable actors, but at the same time illustrates the resource-intensive nature of highly granular models. Consumption is set based on the availability (inventory) and characteristics of the phones at the time an agent makes a purchasing decision. In particular, flows are driven by the demands of all agents filling their stocks with goods to sell or use (depending on the agent). Another agent-level form of model development on the supply side captures operational level economic decisions of producers. This work has most specifically commented on recycling related flows, but the decisions plays a role in predicting the nature of future supply (alloying element flows). Reference Hatayama, Daigo, Matsuno and Adachi49,Reference Gaustad, Olivetti and Kirchain73
Models may also use a combination of the two mechanisms described here. In this case, depending on where demand falls relative to supply, either inventory volumes dominate the market clearing price or inventory may be merely an instrument for managing period-to-period imbalances in supply and demand. This may be a function of whether the marginal producer remains the same period to period (whether demand intersects on a horizontal part of a step-wise supply curve). In other words, if the marginal producer stays the same inventory drives price clearing; otherwise, the supply/demand intersection dominates. Reference Alonso68
We have described the ways in which availability-derived risk may be captured along axes of complexity, including both the level of granularity and degree of economic endogeneity. Researchers must strike a balance between the ability to resolve an answer to the posed question and a tractable analysis. Increasingly granular studies enable tradeoffs among end-uses, regions, or technologies in informing availability, while highly endogenous models enable modulation between supply and demand for a substance. Before concluding, we wish to briefly mention one other application of consequences of change in complex materials systems.
Material flow modeling in contexts beyond availability assessment
Examining the use of these methodologies in contexts outside criticality evaluation adds insight into potential future evolutions of the approach. The field of consequential life cycle assessment (cLCA) provides one example where methods range from simplified, analytical approaches to identifying marginal technology to more integrated methods to gain insight into technology-evolution related questions. cLCA is an extension of conventional or attributional life cycle assessment (aLCA). aLCA provides information about the direct environmental impact of products, processes, and services on their current form. cLCA, in contrast, models how changes resulting from the presence of the product, process, or service may affect other activities within the economy and attempts to account for those consequential impacts instead. Reference Earles and Halog74 Rather than simply describing and accounting for material flows, cLCA is therefore a model of causal relationships deriving from a decision at hand. In this way, the endogenous feedback between supply and demand described above is directly relevant to cLCA.
Early work on cLCA focused on integrating economic theory with the framework of life cycle analysis. For example, to capture consequences that are outside of a product's physical supply chain, concepts such as partial equilibrium theory and price elasticity were introduced. Reference Ekvall75,Reference Ekvall and Weidema76 The analytical approach to coupling economic models with life cycle inventory data through estimates of price elasticities on supply and demand provides a way of simplifying the modeling task and decreases the data collection needed. Successful applications on selected topics include agriculture (e.g., Schmidt Reference Schmidt77,Reference Dalgaard, Schmidt, Halberg, Christensen, Thrane and Pengue78 ), biofuels (e.g., Rehl et al. Reference Rehl, Lansche and Muller79 ), and electricity. Reference Soimakallio, Kiviluoma and Saikku80 For a more integrated determination of the evolution of marginal technology, analysts have linked multimarket and multiregional partial equilibrium models with life cycle inventory Reference Dalgaard, Schmidt, Halberg, Christensen, Thrane and Pengue78,Reference Searchinger, Heimlich, Houghton, Dong, Elobeid, Fabiosa, Tokgoz, Hayes and Yu81 in an analogous fashion to the coupling of MFA with economic information described in this review. The successful development of these models and application to questions of LCA suggests that such should be beneficial for criticality questions as well. Increasing the degree of endogeneity of these models through simulation tools has been cited as area of research need, Reference Earles and Halog74 where the most sophisticated economic model applications to cLCA have developed in modeling direct and indirect land use change for biofuels. Reference Marvuglia, Benetto, Rege and Jury82 Insights from this work could inform model development in criticality assessment and vice versa. In order for cLCA approaches to capture issues relevant to criticality assessment, they would need to be expanded to incorporate more detailed economic feedback. In particular, cLCA models would need to consider potential materials substitutes including those related to revolutionary technology introduction (i.e., electrification of the vehicle fleet) as well as the dynamic environmental impacts of coproduction. These factors are also relevant to future work in criticality assessment more broadly as discussed in the final section of this review.
Conclusion
As understanding of the drivers of criticality risk has developed, so too have the sophistication of the models used to project future materials use to quantify that risk. That sophistication has largely manifested in terms of increasingly granular models with an increasing number of endogenous feedbacks within the model. Particularly, this review has outlined a distinction between models that do not explicitly recognize or model economic behavior, instead focusing on physical material flows, and those that develop projections of market function by capturing economic feedback. Despite the sophistication of these models, there are a number of important topics for further research in this field. Not surprisingly, the most important of these topics concerns the modeling of other key determinants of criticality risk.
Building on the increasing sophistication of the market models reviewed above, the most pressing research challenges include developing (a) the ability to model material substitution behavior, (b) more sophisticated models of supply evolution particularly including the impact of co-production, and the interaction between primary and secondary markets on both supply and demand. We briefly comment on some areas of research interest in these three areas.
So far, we have described a predominantly economic interaction between supply and demand. Technical interaction, in the form of substitution of materials, is referenced within several of these studies, but is not explicitly modeled. This is a particularly important issue because substitution plays a critical role in determining the vulnerability of a stakeholder to limited materials availability. The treatment of revolutionary changes in demand behavior, in particular, the notion that the supply demand interaction can lead to drastic changes in end-user preference. Bollinger has captured some technical feedback within consumption related to differences in utility (or the measure of the satisfaction gained through consumption), Reference Bollinger, Davis, Nikolic and Dijkema43 but this concept would need to be extended to cases where utility among alternatives is driven by several technical attributes and price for it to be applied to a broad range of substitution cases.
As was noted earlier, within the literature surveyed for this paper, the vast majority of studies have focused on projecting the evolution of demand within a given materials market. A full picture of criticality risk depends upon insight into the evolution of supply as well. The paucity of studies on future supply represents an acute need within the field. This need is especially acute for the particular case of modeling supply of co-products. For such cases, the detailed nature of the supply chain may become important as one might have to understand both the extraction activity at the mine in addition to the behavior of the refinery. Reference Roelich, Dawson, Purnell, Knoeri, Revell, Busch and Steinberger25,Reference Elshkaki66,Reference Bustamante and Gaustad83 Finally, the modeled interaction between primary and secondary may be expanded upon as secondary provides a direct offset to the need for primary extraction and therefore mitigates availability concerns. While links between primary and secondary metal markets exist, especially in terms of price, Reference Xiarchos and Fletcher84 complexity exists when secondary materials are not perfect substitutes for primary. In a few examples, market shares of primary versus secondary production are calculated from the relative costs of their outputs modulated by a cross-price elasticity. Reference van Vuuren, Strengers and De Vries34 One final research need derives from why one would develop models to examine materials availability concerns at the outset: to evaluate and identify effective criticality risk mitigation strategies. While some examples of this evaluation are found in several of the examples provided above, further refining methodology to assess proposed strategies will be an ongoing area of improvement for research in this space.
Over the last decade, our understanding about the nature and drivers of criticality risk has matured significantly. Fortunately, in parallel, the modeling methods to support criticality-related decision-making have also developed rapidly. As this review of the literature has made clear, these modeling efforts have already produced a wealth of insight regarding criticality. Nevertheless, a tremendous need still exists to develop sufficiently granular models with sufficient endogenous feedback to fully understand the criticality landscape.