INTRODUCTION
Sucking lice of the family Echinophthiriidae represent an integral element of the parasite fauna of pinnipeds, with records worldwide in species from all pinniped genera (Murray, Reference Murray and Cheng1976). Echinophthiriids are peculiar among the Anoplura by their morphological, physiological, behavioural and/or ecological adaptations to the amphibious life of their hosts (Kim, Reference Kim1971; Murray, Reference Murray and Cheng1976; Mehlhorn et al. Reference Mehlhorn, Mehlhorn and Plötz2002), being among the few insects that have been able to adapt to the marine environment (Leidenberger et al. Reference Leidenberger, Harding and Härkönen2007).
Studies on ecology and life cycles of echinophthiriids flourished in the decades 1960–70. Some studies focused on lice from 2 phocid species, i.e., Lepidophthirus macrorhini on the Southern elephant seal, Mirounga leonina (Murray, Reference Murray1958, Reference Murray, Carrick, Holdgate and Prevost1964, Reference Murray1967; Murray and Nicholls, Reference Murray and Nicholls1965) and Antarctophthirus ogmorhini on the Weddell seal, Leptonychotes weddelli (Murray, Reference Murray, Carrick, Holdgate and Prevost1964; Murray et al. Reference Murray, Smith and Soucek1965). Other studies focused on 2 lice species, i.e., Antarctophthirus callorhini and Proechinophthirus fluctus, infesting the Northern fur seal, Callorhinus ursinus (Otaridae) (Kim, Reference Kim1971, Reference Kim1972, Reference Kim1975). One of the major findings of these studies was that the life cycle of echinophthiriids adjusts precisely to that of their hosts because reproduction, and possibly transmission, of lice can only occur when hosts are on land. As a consequence, the number of lice generations per year is constrained by the duration of haul out periods of their hosts.
Considering the methodological problems inherent to working with pinnipeds, the above studies are of exceptional value because they combined a diverse array of analyses including field counts of lice, in vitro observations, experimental infections and even the follow-up of natural infections in confined hosts (see references above). However, a missing element of all these studies was the lack of replicated data about the actual population dynamics. Field counts of lice on single occasions can convey only a static picture of population dynamics, and the follow-up of infections on single, or few caged or restrained hosts (Murray and Nicholls, Reference Murray and Nicholls1965; Kim, Reference Kim1975) may have a limited value to infer population patterns.
In this paper we investigate, for the first time, the population dynamics of an echinophthiriid species based on replicated sampling of its hosts under natural conditions. Pups of the South American sea lion, Otaria flavescens, from a rookery in Patagonia (Argentina), were periodically sampled for the louse Antarctophthirus microchir throughout the lactation period ashore over 2 consecutive years. The main methodological advantages of this approach were that individual hosts were uninfested at the beginning of the study, the age of infestations was known, and host disturbance was kept at a minimum. Also, population inferences could be based on statistical analysis with replication. Pups were chosen because they are a key population group for lice reproduction, similarly as in other echinophthiriids (Murray and Nichols, Reference Murray and Nicholls1965; Murray et al. Reference Murray, Smith and Soucek1965; Kim, Reference Kim1975).
The population dynamics of A. microchir in sea lions from Patagonia is also interesting for ecological reasons. The cycle develops in a temperate region (20°C on average in the austral summer, see Yorio et al. 1995, and references therein), unlike the other species of echinophthiriid thus far investigated (the cycle develops under a range of temperatures from −2°C to 10°C, see Murray and Nichols, Reference Murray and Nicholls1965; Murray et al. Reference Murray, Smith and Soucek1965; Kim, Reference Kim1975). Temperature is a key determinant for the survival and reproduction of anoplurans, and for the length of egg incubation time (Murray, Reference Murray1987). In fact, echinophthiriids from cold regions have developed ecological strategies and physiological adaptations to withstand low environmental temperatures (Murray, Reference Murray and Cheng1976). On the other hand, the period in which A. microchir can reproduce on pups is short (pups are about 30 days continuously on land; see below). This scenario resembles that of A. ogmorhini on the Weddell seal and L. macrorhini on Southern elephant seals, but contrasts with that of A. callorhini and P. fluctus on Northern fur seals (over 10 weeks on land) (see Murray and Nichols, Reference Murray and Nicholls1965; Murray et al. Reference Murray, Smith and Soucek1965; Kim, Reference Kim1975). Could this combination of a temperate climate and a short period for reproduction lead to shorter generation times in A. microchir compared with other echinophthiriids?
This study addresses 2 specific goals. First, we describe the population dynamics of A. microchir identifying key features that influence transmission patterns and changes in population structure with pup age. Second, we develop simple models of population growth and compare them with empirical data to investigate the duration of the life cycle and, therefore, the number of land generations of A. microchir. These results are discussed in relation to the selective pressures that may act upon the reproductive schedule of this species.
Reproductive biology of the South American sea lion
The South American sea lion is distributed along the Atlantic and Pacific coasts of South America, from 29°S in Brazil to 4°S in Peru; in Argentina, more than 100 colonies have been recorded (Dans et al. Reference Dans, Crespo, Pedraza and Koen-Alonso2004). The main events of the reproductive biology of O. flavescens in Argentina have been summarized by Cappozzo (Reference Cappozzo, Perrin, Würsig and Thewissen2002). Adult males and females arrive at the breeding rookeries during the first half of December. Pregnant females give birth 2–3 days after arrival, and copulation occurs on land 6 days after parturition. Mothers stay with their pups for 2–3 days more and then go to forage offshore for 1–4 days; each foraging trip is followed by 2 days of nursing bouts on land. When pups are alone, they tend to stay in close congregations whose size increases as the reproductive season goes on. At about 30 days of age, pups begin to moult the pelage and go to sea for the first time (Campagna, Reference Campagna1985). Lactation continues for 8–10 months.
MATERIALS AND METHODS
Data collection
This study was carried out throughout 2 consecutive years (2007–2008) in the sea lion rookery of Punta León, Chubut Province, Argentina (63°03′S, 47°43′W). The reproductive season on land begins by mid-December and ends at the beginning of February. In both years, the study began the 3rd of January (approximately 1 week after the first births were observed), and ended the 2nd of February.
Within the first 3 days of study, pups were randomly selected, captured with a noose pole and individually marked with a bleaching solution. The total numbers of pups marked in 2007 and 2008 were 73 (39 male, 34 female) and 63 (35 male, 28 female), respectively. Marked pups were then randomly selected for lice sampling within days 1st–6th (20 pups in 2007 and 20 in 2008), 19th–20th (20 and 21 pups), and 27th–30th (33 and 22 pups) after marking. Initial age of marked pups was determined by examining the degree of umbilicus healing (E.A. Crespo, manuscript in preparation). Based on this method, the age (in days) can confidently be determined in pups from 1 to 3 days old; however, in older pups up to 8 days old, errors of up to 2 days may occur in age determination. For instance, a pup considered as being 4 days old could actually be up to 6 days old, or vice versa. The range of initial age for pups of 2007 and 2008 were 1–8 and 1–7 days, respectively; mean values did not significantly differ between the years (2±2 days in both cases; t-test with log-transformed values, P>0·05). In both years, over 70·0% of the pups were ⩽3 days old.
In a preliminary survey of lice during 2 previous years, we had examined the naked parts of the body of approximately 80 pups to collect lice, based on information about habitat selection from other species of Antarctophthirus (see Murray et al. Reference Murray, Smith and Soucek1965; Kim, Reference Kim1975). However, lice had rarely been found on these locations, but were particularly abundant on the chest and belly. Since pup manipulation had to be very quick (about 3 min) to minimize stress, we sampled only these sites in 2007 and 2008. To collect the lice, each pup was restrained by 2 people and a third person (always the same to minimize biases) combed the pelage with fine-tooth combs of the type used for treating human pediculosis. Inter-teeth width was narrow enough (300 μm) to avoid differential sampling of instars (the mean length×width of the smallest instar was 980×450 μm, see below). Combing stopped when no more lice were collected. All collected lice from each individual pup, and the comb, were put in a Ziploc© bag with 96% (v/v) ethanol. Eggs were not considered in further analyses. Mothers of manipulated pups readily accepted and nursed them, and all manipulated pups survived the study period.
Lice were classified into nymphal stages and male and female adults following Ferris (Reference Ferris1934, Reference Ferris1951) and Kim (Reference Kim and Stehr1987). Adults are distinguished from nymphs by the presence of sexual characters: females (average length×maximum width: 2780×1640 μm, n=20) have a group of setae surrounding the genital opening, and males (2480×1260 μm, n=20) have pseudopenis. Nymphs 1 (hereafter referred to as N1, 980×450 μm, n=18) are differentiated from other nymph stages by smaller size, absence of scales and the absence of ventral spines or hairs on thorax. Nymphs 2 (N2, 1510×830 μm, n=32) and 3 (N3, 1870×1070 μm, n=22) are distinguished by size and by arrangement of occipital apophyses (parallel in N2 and converging at apex in N3) (S. Leonardi, manuscript in preparation).
Infestation patterns
Five pups from 2007, but none of 2008, were >30 days old at the time of lice sampling. These pups were excluded in comparisons between years because they start going to the sea and this may strongly affect lice populations (see the Discussion section).
Infestation parameters were estimated following Bush et al. (Reference Bush, Lafferty, Lotz and Shostak1997) and Rósza et al. (Reference Rózsa, Reiczigel and Majoros2000). Sterne's exact 95% confidence interval (CI) was calculated for prevalence (Reiczigel, Reference Reiczigel2003) and overall sex ratio (no. males/total population). Bootstrap 95% CIs using 10 000 replications were estimated for mean intensity and mean abundance (Rósza et al. Reference Rózsa, Reiczigel and Majoros2000). Prevalence and sex ratio were compared between years with Fisher's exact tests, and population structure with a non-parametric MANOVA based on the Bray-Curtis similarity index (Anderson, Reference Anderson2001). Significance of the F value was computed by permutation of group membership with 10 000 replicates. Inter-year comparisons of mean abundance of specific instars were carried out with bootstrap-based t-tests (Rósza et al. Reference Rózsa, Reiczigel and Majoros2000).
To investigate transmission patterns, we selected pups 1–3 days old in which infestations were assumed to have originated only by transmission. Prevalence, mean abundance and population structure were compared between years as described above. In addition, we tested, for each year separately, whether there was a significant trend of increase in the abundance from less developed (N1) to most developed (adult) instars using Page's tests (Conover, Reference Conover1999).
In infested pups, changes of log10-transformed values of the number of N1, N2, N3 and adults of A. microchir with pup age were described, for each year, using robust local nonparametric regression models (LOESS). This procedure is suitable to discern systematic structure when variables exhibit complex nonlinear relationships (see Cleveland and Devlin, Reference Cleveland and Devlin1988; Jacoby, Reference Jacoby2000, for details). The degree of polynomial and the choice of an optimal fraction of data for each local fitting (the bandwidth) are the most critical factors to balance the risk of under- and overfitting in LOESS (Loader, Reference Loader1999; Schucany, Reference Schucany2004). To select the most suitable combination of these parameters we examined (i) cross-validation plots (Loader, Reference Loader1999); (ii) residual plots after varying the degree of the polynomial (1 and 2) and the bandwidth (0·4 to 0·8) (Loader, Reference Loader1999; Jacoby, Reference Jacoby2000), and (iii) stability of trends after constructing confidence bands using 1000 bootstrapped regression curves for each combination of parameters (Efron, Reference Efron2005). In all cases, the best fitting was obtained with linear regression (polynomial degree=1) and a bandwidth=0·5. For each selected LOESS curves we set point-wise 95% confidence intervals following Loader (Reference Loader1999).
We compared LOESS regressions between years based on an approximate F test:

where RSScombined and dfcombined are, respectively, the residual sum of squares and the equivalent degrees of freedom for the LOESS fit using pooled data from both years; and RSSseparate and dfseparate are, respectively, the summations of the residual sum of squares, and equivalent degrees of freedom for the LOESS regressions calculated separately for each year (see Cleveland and Devlin, Reference Cleveland and Devlin1988; Loader, Reference Loader1999 for details). The degrees of freedom associated to this F test are dfcombined−dfseparate (numerator) and dfseparate (denominator).
Population projection models
The most likely range of generation times (egg to egg) of A. microchir was investigated by developing deterministic matrix models of population growth based on life tables that assumed a reasonably realistic set of values (see Murray and Gordon, Reference Murray and Gordon1969, for a similar procedure). This probably is the best (and arguably the only) option when many life-history data are missing and difficult to obtain, which is the case for the vast majority of species of Anoplura (see Kim, Reference Kim and Stehr1987).
To perform the analysis we focused on the subset of pups ⩽15 days old because, in this host group, the regression between log10-transformed population size of lice and pup age was linear, so were approximately the regressions theoretically obtained from models. Therefore, a comparison of slopes was feasible and served to ascertain possible generation times: shorter generation times should result in steeper slopes and vice versa.
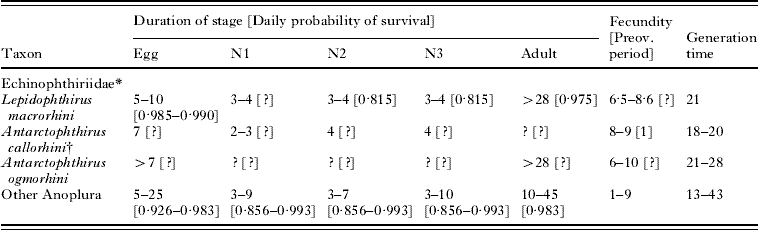
Life-history data (partial, except for Pediculus humanus) were available from 18 anopluran species, including 3 echinophthiriids and 15 species from other families (Table 1). A set of potential life tables for A. microchir was constructed as follows. Concerning the duration of stages, we selected a range of values for the egg (5–10 days), N1 (2–3 days), N2 (3–4 days) N3 (3–4 days), pre-ovoposition period (1 day) and adult (>15 days) based on information from other echinophthiriids (Table 1). It is important to note that combining these data we could construct generation times from 14 days (which allows accommodating 3 lice generations on pups and is close to the shortest value known for an anopluran, see Murray, Reference Murray1987) to 23 days (which allows accommodating only 2 generations and is relatively close to the time limit for A. microchir to reproduce on pups).
Life-history data from species of the Echinophthiriidae and other Anoplura
(Duration is expressed in days, and fecundity as eggs/day. Daily probability of survival was calculated from experimental reports of the number of survivors in a sample after a known period. For instance, Murray and Nichols (Reference Murray and Nicholls1965) found that, from an initial sample of 70 N1s+N2s, 20 had become adults after 6 days. Accordingly, the combined daily probability of survival for N1 and N2 was 0·815 since 70×0·8156≅20.)
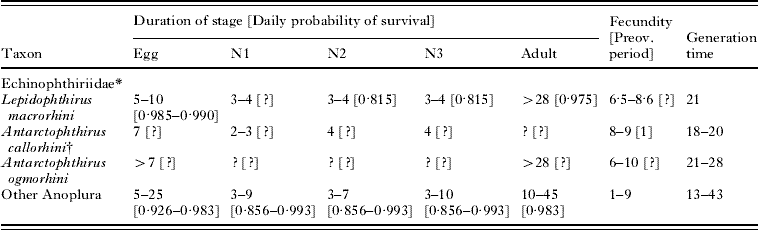
* Sources of data: L. macrorhini: Murray and Nicholls (Reference Murray and Nicholls1965); A. callorhini: Kim (Reference Kim1972, Reference Kim1975); A. ogmorhini (Murray et al. Reference Murray, Smith and Soucek1965). Information about the duration of stages, fecundity and life cycles of other Anoplura were obtained from Evans and Smith (Reference Evans and Smith1952) for Pediculus humanus; Murray (Reference Murray1961) for Polyplax serrata, and the reviews by Kim (Reference Kim and Stehr1987) and Price and Graham (Reference Price and Graham1997), which included relevant information for 5 species of Haematopinus, 6 of Linognathus, 1 of Solenopotes and 1 of Pthirus. Information from daily survival rates was complete only for Pediculus humanus (Evans and Smith, Reference Evans and Smith1952); partial data for specific stages were obtained from P. serrata (Murray, Reference Murray1961); Haematopinus tuberculata (Chaudhuri and Kumar, Reference Chaudhuri and Kumar1961); H. suis (Florence, Reference Florence1921), H. eurysternus (Craufurd-Benson, Reference Craufurd-Benson1941) and Linognathus pedalis (Scott, Reference Scott1950). Information on survival data are more abundant from chewing lice, and values are in the range considered here (see references in Price and Graham, Reference Price and Graham1997).
† Duration of stages is assumed to be similar in Proechinophthirus fluctus (Kim, Reference Kim1975).
We obtained 30 types of models by combining duration values of non-adult stages (see Fig. 3). Next, for each type of model, we considered 5 realistic values of daily survival rate (0·80, 0·85, 0·90 and 0·95 and 0·99) for each stage, and 5 fecundity values (6, 7, 8, 9 and 10 eggs), based on information from echinophthiriids and other anoplurans (Table 1). Accordingly, there were 5×5×5×5×5=3125 possibilities of combining these values, of which we randomly selected 100 to construct life tables. Since there were 30 types of models of stage duration, we eventually produce a total of 30×100=3000 individual life tables.
For each life table, the theoretical population growth during the first 15 days was calculated by assuming a constant daily rate of mother-to-pup transmission of 2 N1s, 6 N2s, 6 N3s and 7 adults during the first 10 days; this proportion was selected based on overall infestation data from pups ⩽3 days old (see the Results section). Population data were then log10-transformed to achieve linearity with pup age, and the slope of minimum-squares regression was calculated. Average slopes for each of the 30 combinations of generation time were calculated based on the 100 replicas, and 95% confidence intervals (CI) were set based on the normal theory. Then, we compared theoretical slopes with those empirically obtained.
Most statistical analyses were carried out with SSPS v. 15.0 and SYSTAT 12.0. Models were developed with Excel spreadsheets. Other specific analyses were performed with free software: the program ‘Past’ for nonparametric MANOVAS; the Locfit procedure of the R package to estimate and compare LOESS regressions, and Quantitative Parasitology v. 3.0 (Reiczigel and Rózsa, Reference Reiczigel and Rózsa2005) to estimate infection parameters and conduct pair-wise comparisons with the bootstrap t-test.
RESULTS
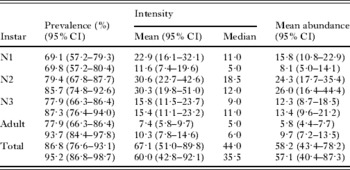
The great majority of pups examined (124 out of 136) were infected with A. microchir and prevalence did not differ significantly between years (Fisher exact test, P=0·131) (Table 2). Of the 12 uninfected pups, 10 (9 from 2007 and 1 from 2008) were 1 day old, and 2 pups from 2008 were 2 and 3 days old, respectively. Mean intensity of A. microchir did not significantly differ between years (bootstrap t-test, t=0·465, P=0·654); the range of intensity was 1–382 in 2007 and 1–466 in 2008. However, the comparison of overall population structure was close to significance (nonparametric MANOVA, F=2·098, P=0·066). Individual comparisons between instars indicated that the mean abundance of both N2 and N3 was very similar between years, but pups collected in 2007 harboured significantly more N1s (bootstrap t-test, t=2·151, P=0·038) whereas those collected in 2008 harboured more adult lice (t=2·072, P=0·039) (Table 2). The adult sex ratio in the overall sample of A. microchir did not depart significantly from 1:1 and did not differ between years (in 2007: 0·459 [95% CI: 0·409–0·509]; in 2008: 0·470 [0·430–0·510]; Fisher exact test, P=0·795).
Infection parameters of Antarctophthirus microchir collected from the chest and belly of pups of Otaria flavescens from Patagonia, Argentina
(Data from 2007 (upper row, n=68 pupsFootnote *) and 2008 (lower row, n=63). N1–N3: Nymphs 1–3. CI: Confidence Interval.)

* Five pups of the original sample were excluded from calculations because they were >30 days old (see the text for details).
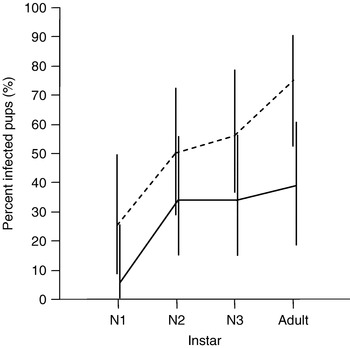
A total of 34 pups (18 and 16 from 2007 and 2008, respectively) were ⩽3 days old. In this subsample, the prevalence of all instars of A. microchir was consistently higher in pups collected in 2008 (Fig. 1); the difference was significant for adults (Fisher exact test, P=0·02). Overall population structure also differed between years (non-parametric MANOVA, F=3·132, P=0·036); univariante comparisons indicated that mean abundance of all stages was higher in 2008, but only that of adults was found to be statistically significant (t=2·05, P=0·036). Within each year, prevalence differed significantly among instars (Cochran test; in 2007, Q=8·5, 3 d.f., P=0·037; in 2008, Q=13·55, P=0·004), with values increasing from N1 to adult (Fig. 1). Using intensity data, this trend was found to be significant in both years (Page test; in 2007, L=242, P<0·01; in 2008, L=350·2, P<0·01).
Prevalence of instars (N1–N3, nymphs 1–3) of the louse Antarctophthirus microchir in 1 to 3-day-old pups of the South American sea lion, Otaria flavescens. Solid and broken lines connect values for the sample of 2007 (n=18) and 2008 (n=16), respectively. Vertical bars are the 95% confidence intervals.

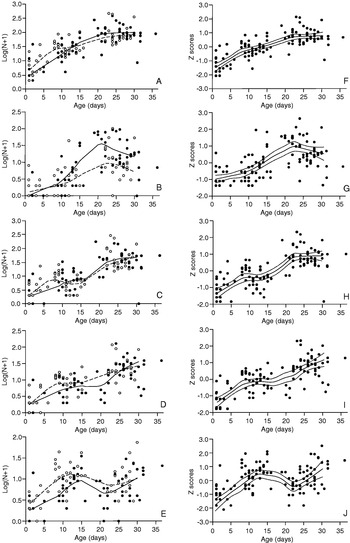
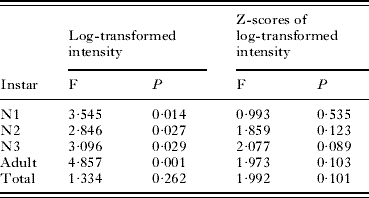
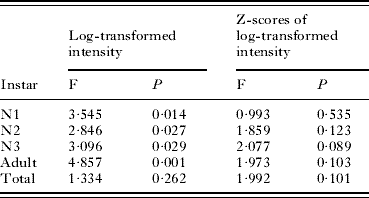
LOESS regressions of log-transformed intensity of instars of A. microchir on pup age are shown in Fig. 2. There were significant differences of regression lines between years for all instars, but not for total intensity (Table 3). The largest differences occurred in the case of N1s and, particularly, adults (Fig. 2B, D; Table 3). The number of N1 in young pups (⩽10 days old) was similar in both years, but increased more in older pups collected in 2007 than in 2008 (Fig. 2B). In contrast, the number of adult lice was consistently higher in pups from 2008, except for pups approximately 28–30 days old (Fig. 2D). In spite of these numerical differences, regressions with standardized log-transformed values of intensity did not differ between years for any instar (Table 3), suggesting that a basic population trend was conserved.
LOESS regression models for log10-transformed values, and standardized log10-transformed values, of the number of each instar and total intensity of the louse Antarctophthirus microchir in pups of South American sea lion, Otaria flavescens. Pups >30 days old were excluded in the calculations. A–E: Regressions on log10-transformed values. Black points, solid lines: sample of 2007; open points, broken lines: sample of 2008. F–I: Regressions on standardized log10-transformed values with pooled data from both years. Dotted lines: point-wise 95% confidence intervals for the LOESS curve. (A, F). Total population; (B, G). First nymph (N1); (C, H) Second nymph (N2); (D, I). Third nymph (N3); (E, J) Adult.

Inter-year comparison of LOESS regression curves of the raw, and standardized, log-transformed number of each instar or total intensity of the louse Antarctophthirus microchir on age of pups from South American sea lion, Otaria flavescens (see Fig. 2)
(The equivalent degrees of freedom, which were the same in all F tests (d.f.1=3·94 and d.f.2=111·26), were rounded to the nearest integer to calculate P-values.)
Five pups in the sample from 2007 were >30 days old when examined for lice. When we compared mean abundance of each instar between this subsample and that of pups 28–30 days old (n=7), we did not find significant differences in the case of N2, N3 and adults (bootstrap t-test, all P>0·22), but we did in the case of N1 (t=−2·574, P=0·0240) although the samples to be compared were small. The number of N1 sharply decreased in pups >30 days old (Fig. 2B).
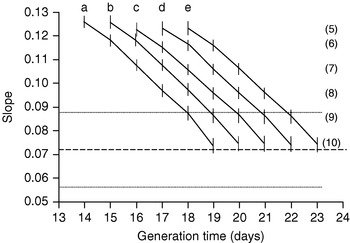
The slopes of generation times considering different combinations of life-history data for A. microchir are shown in Fig. 3. Variability of slopes was heavily dependent on egg duration (incubation time), with minor changes related to the duration of the nymphal stages (Fig. 3). This is not surprising because incubation time determines when the second generation of lice will appear within the 15-day period, thus strongly affecting the slope of population growth (nymphs plus adults). The empirical slopes of population growth were similar in 2007 and 2008 i.e. 0·76 (95% CI: 0·50–0·100) and 0·73 (0·56–0·88), respectively. An ANCOVA indicated that the two slopes did not significantly differ from each other (F(1,63)=0·040, P=0·842) and, therefore, a single empirical regression was obtained from pooled data. The comparison of the empirical and the theoretical slopes of population growth suggested a range of generation times from 18 to 23 days (which was the maximum established by default), for a minimum incubation time of 9 days (Fig. 3). In fact, an upward change in the trend of increase of N1 in both years occurred in pups 9 days old or older (Fig. 2B, G), which probably is indicative that lice from a new generation are being recruited in pups ⩾9 days old.
Average slopes of the theoretical regressions between the log10-transfomed population size of Antarctophthirus microchir and the age of sea lion pups, for pups ⩽15 days old. A total of 30 different combinations of stage duration were considered; the right numerical column identifies the egg incubation time, and top letters identify the duration of the N1, N2 and N3 (a: 2,2 and 3 days; b: 3,3,3; c: 2,4,4; d: 3,4,4; e: 4,4,4); a constant pre-ovoposition period of 1 day was assumed for all combinations. For instance, the rightmost combination in the row at the bottom assumes an incubation time of 10 days, and 4, 4 and 4 days of duration for the N1, N2 and N3, respectively, plus a pre-ovoposition period of 1 day; therefore, the generation time (egg to egg) for this combination is 23 days. For each of the 30 combinations of stage duration, 100 regression models were obtained by varying the daily fecundity rate, and survival rate for each stage (see the text for details). Vertical bars represent the 95% CIs of average slopes. The broken line represent the empirical slope observed for A. microchir, with its 95% CI limits (dotted lines).

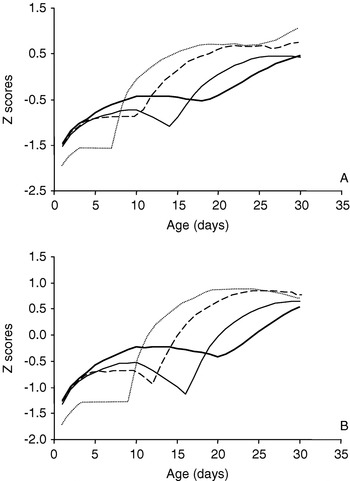
In Fig. 4, we provide 2 examples of population projection of each instar for pups ⩽30 days old for generation times of 18 and 23 days. The only additional assumption was that adults have a life span >30 days. Note that the basic shape of projections agrees well with empirical trends (Fig. 2G–J), and was not substantially altered by assuming that additional events of vertical or horizontal (pup to pup) transmission occur in pups >10 days old (data not shown).
Two examples of theoretical population projection (standardized log10-transformed abundance) of the different instars of the louse Antarctophthirus microchir in sea lion pups 1–30 days old. Only mother-to-pup transmission during the first 10 days was considered, with daily ‘packets’ of 2 N1s, 6 N2s, 6 N3s and 7 adults. Dotted line: Nymph 1. Broken line: Nymph 2. Thin line: Nymph 3. Thick line: Adult. A. Generation time: 18 days. Duration of stages (in days): Egg: 6; N1: 3; N2: 4; N3: 4; adult: >30. The pre-ovoposition period was 1 day. B. Generation time: 23 days. Duration of stages (in days): Egg: 10; N1: 4; N2: 4; N3: 4; adult: >30. The pre-ovoposition period was 1 day. In both examples, daily survival rates were 0·900 for all stages, and daily fecundity rate was 8 eggs/female (see text for details).

DISCUSSION
This study tracks, for the first time, the population dynamics of a species of echinophthiriid using replicate samples under natural conditions. However, the study relies on lice sampling of only a part of the host's body. Thompson et al. (Reference Thompson, Corpe and Reid1998) faced a similar logistic problem and counted individuals of Echinophthirius horridus only on the dorsal surface of one hind flipper of harbour seals. These authors justified their decision based on previous evidence showing that this was the principal site of infestation. Our sampling strategy was justified on similar grounds, i.e., individuals of A. microchir were particularly abundant on the chest and belly of sea lion pups. However, this observation is in contrast to the reports from other species of Antarctophthirus indicating a preference for bare areas of the body (Murray and Nicholls, Reference Murray and Nicholls1965; Murray et al. Reference Murray, Smith and Soucek1965; Kim, Reference Kim1972, Reference Kim1975). Apparently, these thermoregulatory areas provide suitable temperature conditions for the activity and reproduction of lice in cold climates (Murray and Nicholls, Reference Murray and Nicholls1965). However, A. microchir faces the opposite problem: at Punta León, average air temperatures in January are about 20°C, with maximum temperatures sometimes reaching 38°C (Yorio et al. 1995, and references therein). Therefore, direct solar radiation on pups produces thermal stress and likely lethal conditions for lice on bare areas, whereas ventral areas with pelage may provide maximal protection. In any event, our sampling strategy assumes that the preference for ventral body areas is similar for all instars. Although this assumption might be valid, we dealt with the absolute number, and not with their relative proportion, of each instar per host to alleviate potential biases of differential habitat selection among instars.
As noted above, A. microchir has a window of time of about 1 month to reproduce on newborn pups. Afterwards, pups go to the sea and start moulting, and both events likely kill all lice eggs (see Murray, Reference Murray and Cheng1976, Reference Murray1987). Our data also suggest that the N1 might be affected negatively by the first immersions because its abundance, but not that of other instars, sharply decreased in pups >30 days old. Interestingly, the N1 of A. microchir lacks, as other species of Antarctophthirius (Kim, Reference Kim1971; M. S. Leonardi, unpublished data), the specialized abdominal scales that assist more developed instars in obtaining oxygen underwater (Kim, Reference Kim1971; see also Murray, Reference Murray and Cheng1976, Mehlhorn et al. Reference Mehlhorn, Mehlhorn and Plötz2002). In other words, the N1 would depend on atmospheric air for respiration. Kim (Reference Kim1975) suggested that this was the reason why the N1 of A. callorhini favours the underfur layer of pelage of the Northern fur seal, where an air blanket is formed during immersions. However, the pelage of the South American sea lion wets completely when submerged.
Vertical transmission of A. microchir starts shortly after the pup's birth and is very effective: most 1-day-old pups already harboured lice and uninfected pups were all ⩽3 days old. Likewise, Kim (Reference Kim1972, Reference Kim1975) reported infestation with A. callorhini in pups of Northern fur seal as early as 7 h after parturition. However, instars of A. microchir seem to differ in their potential for transmission. Each year, we found a consistent pattern of increase in numbers from the N1 to the adult in pups ⩽3 days old, which might probably result from corresponding differences in the potential for transmission of each instar. In a series of experiments with human head lice, Takano-Lee et al. (Reference Takano-Lee, Edman, Mullens and Clark2005) demonstrated that travelling speed and dispersal ability were minimal in the N1 and increased in more advanced instars. This hypothesis is also compatible with previous studies on echinophthiriids (Murray and Nicholls, Reference Murray and Nicholls1965; Kim, Reference Kim1972, Reference Kim1975), which reported a relative rarity or absence of N1 in newborn pups.
Our results suggest that the shape of population increase for each instar of A. microchir with pup age is conserved between years. Simple models of population growth suggest that this basic pattern would primarily reflect the dynamics of recruitment and reproduction: recruitment would depend mainly on vertical (mother to pup) transmission (Leidenberger et al. Reference Leidenberger, Harding and Härkönen2007), particularly during the first 10 days post-partum, whereas reproduction would be continuous on land (Murray, Reference Murray and Cheng1976) and so at least a second generation of lice would be produced (see also below). However, the specific trend of change in abundance differed between years for all instars of A. microchir. This is not surprising as populations of lice are strongly affected by a number of factors that often produce remarkable short-term changes in population structure (see Murray, Reference Murray1987, and Price and Graham, Reference Price and Graham1997, for references). Environmental factors are particularly relevant in our case. Newborn pups apparently acquired more lice, particularly adults, from their mothers in 2008. However, although the number of adult lice remained higher on older pups, the number of N1 strongly declined compared to 2007. In fact, the decline affected all instars but was sequential with pup age (LOESS regression lines cross at later pup ages from N1s to adults; see Fig. 2). It would appear that some factor induced a lower reproduction rate or a higher mortality of eggs, probably 10 days after the sampling period had begun. Environmental conditions (e.g., temperature, solar radiation, relative humidity), but not host-related factors (e.g., population density, changes in pelage or grooming behaviour) can change idiosyncratically in a matter of days. We suspect that relative humidity, which has a specific impact upon lice eggs (see Murray, Reference Murray1963), may account at least partly for the differences that we observed. At Punta León, rainy days are regularly scattered throughout January every year, but the duration of rainy periods and the amount of rainfall may vary unpredictably among years (Yorio et al. 1995, and references therein).
We used a number of combinations of realistic values of survival probability, stage duration and fecundity to model the population growth of A. microchir and so ascertain its possible generation time. The range obtained was 18–23 days, which is congruent with data from other echinophthiriids (note, however, that the upper limit could increase if we assume a longer duration of nymphal stages, see Table 1). What makes our result particularly robust is that slopes of population growth for a given combination of stage durations varied little, regardless of the values of survival rate and fecundity. However, the minimum generation time obtained depends on a relatively long egg incubation time (⩽9 days). Since incubation time can vary widely according to small changes of microhabitat temperature (see Price and Graham, Reference Price and Graham1997), could shorter generation times be expected in better years?
To answer this question, we should consider the potential selective pressures acting upon the tight reproductive schedule of A. microchir. This species might accommodate 3 generations at best during the lactation period of pups ashore, but further regular reproduction is unlikely in other host age classes because they do not stay continuously on land enough time (see Campagna and Le Boeuf, Reference Campagna and Le Boeuf1988) for newly laid eggs to develop into N2 (as discussed above, the N1 probably requires also aerial conditions). For comparison, consider the 6–12 generations per year of a typical terrestrial louse, the hog louse, Haematopinus suis (Price and Graham, Reference Price and Graham1997). Having such strict temporal limits for reproduction, A. microchir may confront a trade-off between generation time and fecundity (Stearns, Reference Stearns1992; Gemmill et al. Reference Gemmill, Skørping and Read1999). A short generation time (e.g., 14 days) would potentially allow accommodation of a third generation of lice before pups go to the sea, but with the clear risk that unfavourable environmental conditions at any time (e.g., low temperature) may delay development until it is too late. In contrast, a long generation time (e.g., 23 days) would prevent the possibility of producing a third generation of lice, but parental individuals may produce more eggs if a prolonged development increases adult size (Gemmill et al. Reference Gemmill, Skørping and Read1999). Ascertaining whether this trade-off is actually shaping the life cycle of A. microchir, and that from other echinophthiriids, could be investigated in the future through comparative analysis with other anoplurans.
The authors thank the members of Laboratorio de Mamíferos Marinos CENPAT, especially N.A. García and M.F. Grandi. G. Svendsen, F. García and L. Hardtke for their invaluable assistance in fieldwork, and to M. Fernández for her assistance with nymph classification. This study was funded by the BBVA Project BIOCON04 entitled: ‘Estudio de las amenazas para la conservación de mamíferos marinos de Patagonia’ and the Zoo d'Amneville, France. Institutional support was given by Centro Nacional Patagónico (CONICET, Argentina) and the Secretaría de Areas Protegidas y Turismo, Chubut province (Argentina). F.J. Aznar benefits from a I3 Contract from the Ministry of Science and Innovation of Spain.