I. INTRODUCTION
The non-metallic inclusion is not only the origin of fatigue failure for high strength steel, but also causes fatigue failure of medium strength steel in certain conditions. Reference Murakami, Takada and Toriyama1–Reference Lu, Zhang and Shiozawa3 For example, it is common for a railway wheel which is made from medium strength steel to fracture from the internal inclusion under rolling contact loading. Reference Ekberg and Sotkovszki4–Reference Kabo7 When the steel fractures from the internal inclusion, the fatigue strength is determined by the largest inclusion in the material. Reference Murakami, Kodama and Konuma8,Reference Murakami and Beretta9 Therefore, it is important to evaluate the inclusion size in the medium strength steel.
The conventional method for evaluating the inclusion size is based on surface analysis by optical microscopy. Reference Atkinson and Shi10 Inclusion sizes on the polished surface of a sample are measured by optical microscopy. Then, the maximum inclusion size in a given material volume can be estimated based on the measured inclusion sizes by statistics of extreme values (SEV) method. Reference Murakami and Beretta9,Reference Murakami and Usuki11 However, the inclusion size measured by surface analysis is smaller than the actual size because the probability of observing the largest inclusion in an arbitrary section is quite small. Reference Abe, Furuya and Hirukawa12
Furuya conducted ultrasonic fatigue testing for high strength steel and then evaluated the inclusion size on the fracture surface of fatigue specimens; this evaluation method was proved to possess the advantage of detecting larger inclusions compared with the conventional surface analysis. Reference Furuya, Matsuoka and Abe13 However, it still has some deficiencies. This method cannot be used to evaluate the inclusion size in medium strength steel, because fatigue failure of medium strength steel initiates from the surface of specimen, rather than the internal inclusion. Reference Murakami, Takada and Toriyama1–Reference Lu, Zhang and Shiozawa3 Besides, the inclusion size increases in proportion to the increased risk volume of fatigue specimen that is estimated as the region subjected to over 90% of maximal stress. Reference Murakami14,Reference Sonsino, Kaufmann and Grubišić15 However, the risk volume of the hourglass-shaped specimen that was used by Furuya tends to be small. Reference Furuya, Matsuoka and Abe13 The accuracy of the evaluation result would be increased when using the fatigue specimen with a large risk volume. However, it is difficult to cool such a specimen by conventional compressed air. This can lead to the failure of the specimen due to a high temperature. Therefore, some experimental methods should be designed to evaluate the accurate inclusion size in the medium strength steel by ultrasonic fatigue testing.
The object of this paper is to propose a novel method to evaluate the maximum inclusion size in medium strength steel by fatigue testing. Some experimental methods were designed to ensure specimens of medium strength steel fracture from the internal inclusion during ultrasonic fatigue testing. Then, the validation of the proposed method was analyzed in comparison with the traditional method.
II. METHOD AND EXPERIMENT
A. Method
The maximum inclusion size in medium strength steel was evaluated by a high frequency fatigue test in this study. To estimate the accurate inclusion sizes in fatigue specimens, the following steps were taken:
-
(i) The risk volume of fatigue specimen was designed to be as large as possible, because the probability of the existence of large inclusions increases with an increase in the risk volume.
-
(ii) Conduct high frequency fatigue testing to rapidly damage the specimens and measure the inclusion sizes on the fracture surfaces.
-
(iii) It is difficult to suppress the temperature increase of the specimen with a large risk volume by air-cooling during high frequency fatigue testing. To avoid the failure of specimen due to high temperature, water-cooling was conducted for fatigue specimens.
-
(iv) Increase the probability of fatigue failure that occurs at internal inclusion by strengthening the fatigue specimen and protecting the specimen from surface corrosion that is induced by cooling water during fatigue testing.
B. Experiment
1. Material and pre-treatment
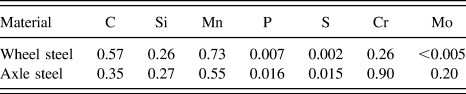
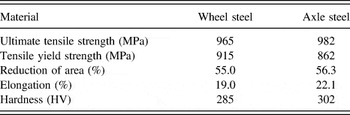
The medium strength wheel steel and axle steel were used to demonstrate the proposed evaluation method in this study. Chemical compositions and mechanical properties of test steels are given in Table I and Table II, respectively.
Chemical compositions of tested materials (wt%).

Mechanical properties of tested materials.

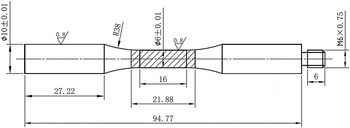
Steel bars with a diameter of 11 mm were machined from a railway wheel and a railway axle, respectively. Heat treatment was conducted to increase the strength of the steel bars using the following procedure: austenitizing at 810 °C for 0.5 h, quenching in oil, tempering at 180 °C for 0.5 h, and air-cooling. Then, steel bars were machined into ultrasonic fatigue specimens that have a straight section of 6 (diameter) × 16 mm in the middle, as shown in Fig. 1. These specimens were oxynitrocarburized to improve surface corrosion resistance. The oxynitrocarburization was carried out at 620 °C for 2 h, with a gas mixture of NH3, O2 and additive organic gas at 0.11 MPa in a low-temperature gas multi-elements penetrating system, and then the specimens were cooled in air.
Specimen shape and dimensions for ultrasonic fatigue test (mm).

2. Ultrasonic fatigue tests
The ultrasonic fatigue tests were conducted using a Shimadzu USF-2000 ultrasonic testing system (Shimadzu Corporation, Kyoto, Japan) with a resonance frequency of 20 kHz, a resonance interval of 200 ms, and a stress ratio of R = −1. It has been reported that fatigue fracture of specimens could be grouped into two types: (i) fracture that occurred from the surface of specimen at a high stress amplitude level and low number of cycles and (ii) fracture that occurred from the internal inclusion at low stress amplitude level and high number of cycles. Reference Lu, Zhang and Shiozawa3,Reference Itoga, Tokaji, Nakajima and Ko16,Reference Ochi, Matsumura, Masaki and Yoshida17 Many works have shown that there is a fatigue limit for the surface initiated fatigue, while the fatigue limit disappears for the internal inclusion-induced fatigue. Reference Shiozawa, Lu and Ishihara18 That is, when the applied stress amplitude is below the fatigue limit of the surface initiated fatigue, the internal inclusion-induced fatigue crack can still grow, while the surface crack stops propagating. However, when the fatigue testing is conducted at a high stress that is above the fatigue limit of surface initiated fatigue, there is a competition between surface crack and internal crack during the testing. For a given stress amplitude and inclusion size, the stress intensity factor at the surface is higher than that at the interior. Besides, since the internal crack grows in the vacuum, the growth rate of internal crack is lower than that of surface crack. Reference Shoya, Kuroshima and Harada19 And thus, there is still a possibility that fatigue failure originates at the surface at a high stress, even if the strength of specimen surface is increased by surface treatment. Therefore, step loading was used in this study and the applied stress amplitude at the starting point of the test was set at a low level. This increases the probability of fatigue failure that originates from the internal inclusion. In this study, the applied stress amplitudes at the starting point of the test were set as 150 and 250 MPa for wheel steel and axle steel, respectively, which are about half of the fatigue limit Reference Zhang, Lu, Shiozawa, Zhou and Zhang20,Reference Robles Hernández, Cummings, Kalay and Stone21 of the tested steels. The surface fatigue fracture does not occur at the high-cycle region of more than 107 cycles, while there is a probability that the specimen fractures from the internal inclusion in that condition. Reference Itoga, Tokaji, Nakajima and Ko16,Reference Ochi, Matsumura, Masaki and Yoshida17 Therefore, the specimens were applied up to 2 × 10⁷ cycles at every stress amplitude, which was increased by an increment of 50 MPa each time until the failure of the specimen. During the testing, specimens were cooled by water to suppress any temperature increase. All fracture surfaces of ruptured specimens were observed by scanning electron microscopy (SEM) to measure the inclusion size.
3. Surface analysis by optical microscopy
To compare the proposed evaluation method with the traditional method, wheel steel samples were prepared for surface analysis by optical microscopy. Ten samples were polished and then observed under a magnification of 400. About 100 areas were chosen at random and inspected using an optical microscope to measure the maximum inclusion size on each area. Each inspection area is of a standard size which is called the “standard inspection area.” Reference Murakami14 The value of a standard inspection area is 0.087285 mm2 in this study.
III. RESULTS
A. Microstructure and microhardness of pre-treated fatigue specimen
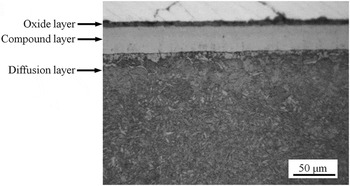
Figure 2 shows the cross sectional microstructure of wheel steel specimen after pre-treatment. Three layers were formed on the surface of the fatigue specimen during oxynitrocarburization: oxide layer, compound layer, and diffusion layer. On the outermost surface, there is a loose and black oxide layer. Next to the oxide layer, there is an obvious bright compound layer which is homogenous and dense. The diffusion layer is below the compound layer. It has been reported that the compound layer, which is composed of ε-Fe4N and ε-Fe3N, is able to protect the specimen from surface corrosion, Reference Zhang, Lu, Cui, Yi and Zhang22 which is induced by cooling water during fatigue testing.
Microstructure observation of the oxynitrocarburized fatigue specimen.

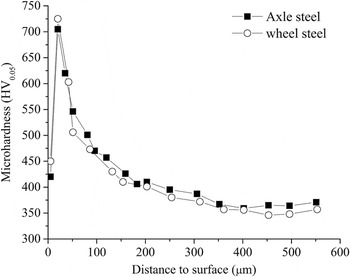
Figure 3 shows microhardness profiles of the treated ultrasonic fatigue specimens. It can be seen that the microhardness of the oxide layer on the outmost surface is comparatively low and the compound layer has the highest hardness. At the diffusion layer, the hardness decreases with the increasing of the depth until about 350 μm, at which depth a uniform hardness of the matrix is reached. The hardness of the matrix of wheel steel specimen and axle steel specimen after heat treatment and oxynitrocarburization was increased to 353 and 364 HV, respectively.
Hardness profiles of the treated ultrasonic fatigue specimens.

B. Risk volume of fatigue specimen
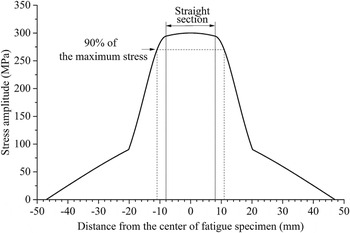
Figure 4 shows the stress amplitude distribution along the axial direction of the specimen during ultrasonic fatigue testing. The stress amplitude distribution was obtained by analytically solving a longitudinal wave equation. Reference Bathias and Paris23 The difference between the maximum stress and the minimum stress in the straight section is less than 2%. The stress amplitude distribution in the straight section is assumed to be uniform. The risk volume of fatigue specimen is estimated as the region where the applied stress amplitude is larger than 90% of the maximum stress amplitude, Reference Murakami14,Reference Sonsino, Kaufmann and Grubišić15 as shown in Fig. 4. Therefore, the risk volume of the fatigue specimen indicated by the shaded areas in Fig. 1 can be obtained as 612 mm3. However, the risk volume is reduced by surface treatment, because the fatigue initiation at the surface layer which is strengthened by the oxynitrocarburization is suppressed. The depth of the strengthened surface layer is about 350 μm, as shown in Fig. 3. The risk volume of the fatigue specimen after oxynitrocarburization is then reduced to 486 mm3.
Calculated stress amplitude distribution along the axis of specimen during the ultrasonic fatigue testing at 300 MPa.

C. Inclusion sizes
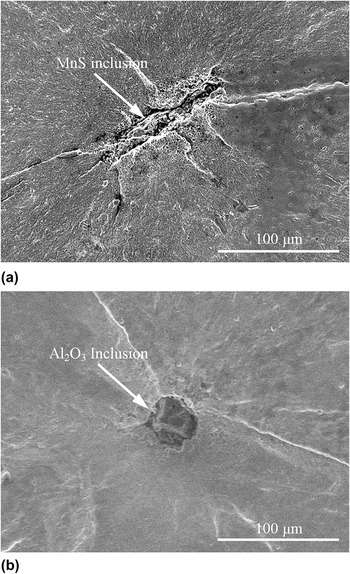
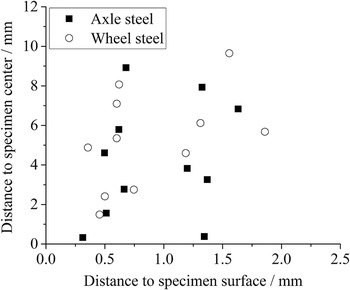
The typical fracture surfaces of fatigue specimens are shown in Fig. 5. The distribution of crack initiation sites is shown in Fig. 6. It can be seen that all of the fatigue cracks originate from the internal inclusions and the initiation sites are randomly distributed in a large volume. Square root of inclusion area
 $\sqrt {{\rm{area}}}$
was adopted to represent the inclusion size. The inclusion was approximated as an ellipse and the value of
 $\sqrt {{\rm{area}}}$
was estimated using the equation
 $\sqrt {{\rm{area}}} = \sqrt {\left( {{\rm{major\ axis}}} \right) \times {{\left( {{\rm{minor\ axis}}} \right)} \over {\rm{4}}}}$
, where major and minor axes are those of an ellipse approximating the shape of the inclusion.
Reference Murakami14
The values of
 $\sqrt {{\rm{area}}}$
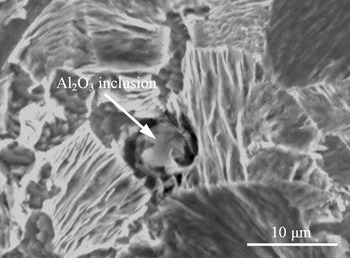
for wheel steel and axle steel range from 46.0 to 168.3 μm and from 34.3 to 75.7 μm, respectively. Figure 7 shows the typical inclusion obtained by surface analysis. The inclusion sizes of wheel steel obtained by surface analysis range from 3.4 to 38.8 μm.
SEM observations of ultrasonic specimen fracture surface. (a) Wheel steel. The final fatigue life and applied stress amplitude for this specimen are 1.23 × 10⁸ and 450 MPa, respectively. (b) Axle steel. The final fatigue life and applied stress amplitude for this specimen is 1.42 × 10⁸ and 600 MPa, respectively.

Distribution of crack initiation sites.

Inclusion in wheel steel observed by surface analysis.

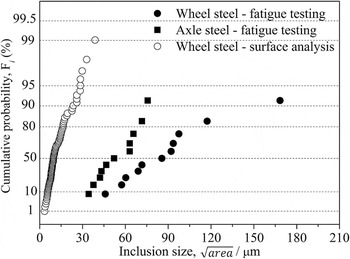
To compare the results of these two methods, the inclusion sizes are plotted on a Gumbel probability paper, as shown in Fig. 8. The inclusion sizes of wheel steel obtained by fatigue testing are significantly larger than those obtained by surface analysis.
Inclusion sizes plotted on a Gumbel probability paper.

The number of cycles it generally takes to complete fatigue testing for each specimen is less than 2 × 10⁸. This is achieved in less than 6 hours by ultrasonic fatigue testing with extremely high frequency of 20 kHz, instead of the 22 days by a conventional 100 Hz test. Therefore, the proposed method can be conducted in a reasonable amount of time.
IV. DISCUSSIONS
A. Effect of pre-treatment on fracture behaviors of fatigue specimen
It has been reported that fatigue specimen with a higher hardness tends to fracture from the internal inclusion. Reference Murakami, Takada and Toriyama1,Reference Abe, Furuya and Matsuoka2 Therefore, the pre-treatment increases the probability of internal inclusion-induced fracture, since the hardness of the matrix of fatigue specimens is increased by pre-treatment.
The ultrasonic fatigue specimen is generally cooled by dry compressed air. However, it is hard to cool the specimen with a large risk volume by air-cooling. To avoid temperature rise during testing, fatigue specimens were oxynitrocarburized and then cooled by water. Water-cooling was conducted to limit the temperature increasing and avoid the failure of specimen due to high temperature. A bright compound layer with high resistance to surface corrosion was formed by oxynitrocarburization, as shown in Fig. 2. This protects the specimen from surface corrosion induced by cooling water.
The inclusions can be classified as surface inclusion and internal inclusion. According to the theory of Murakami, Reference Murakami, Kodama and Konuma8,Reference Murakami14 the inclusion would quickly detach from the matrix under the applied loading and then the interface of the inclusion can no longer sustain the applied stress. The inclusion therefore becomes mechanically equivalent to a stress-free pore and the effects of the inclusion on fatigue strength can be resolved quantitatively by fracture mechanics. The value of stress intensity factor for an inclusion was proposed by Murakami as follows Reference Murakami, Kodama and Konuma8,Reference Murakami14 :
 $$\Delta {K_S} = 0.65{\sigma _{\rm{a}}}\sqrt {\pi \sqrt {{\rm{are}}{{\rm{a}}_S}} } > \Delta {K_{{\rm{th}},S}}\quad ,$$
 $$\Delta {K_I} = 0.5{\sigma _{\rm{a}}}\sqrt {\pi \sqrt {{\rm{are}}{{\rm{a}}_I}} } > \Delta {K_{{\rm{th}},I}}\quad ,$$
where σa is the applied stress amplitude, ΔK is the stress intensity factor,
 $\sqrt {{\rm{area}}}$
is the square root of the inclusion area, and ΔK
th is the threshold stress intensity factor. A subscript of S refers to the inclusion on the surface, I to the inclusion at internal zone. Fatigue failure is predicted if ΔK exceeds ΔK
th.
The value of ΔK th,S was increased since the surface layer of the fatigue specimen was strengthened by oxynitrocarburization. Fatigue failure induced by surface inclusion was then inhibited and the fatigue specimen would fracture from the internal zone where the maximum value of ΔK I is reached. As shown in Fig. 4, the stress amplitude distribution in the straight section is almost uniform. Besides, since the fatigue specimens were tested under axial loading, the applied stress amplitude on the whole section of the specimen can be assumed to be constant. This leads to the crack initiation from the maximum section of the largest internal inclusion in the straight section.
In this study, most of the fatigue specimens fractured from the straight section, while only two specimens fractured from the arc transition region with a radius of 38 mm, as shown in Fig. 1. It can be seen from Fig. 6 that the distance from the fracture surface to the center of the specimen for these two specimens is 9.65 and 8.92 mm, respectively. Although the stress amplitude is comparatively small in the arc transition region, the inclusion size in this region is larger than that in the straight section; this leads to the existence of the maximum ΔK I in the arc transition region and therefore the specimen fractures from this region. The concept of “the risk volume” that is estimated as the region where the applied stress amplitude is larger than 90% of the maximum stress amplitude Reference Murakami14,Reference Sonsino, Kaufmann and Grubišić15 is therefore adopted in this study. The risk volume of the fatigue specimen is indicated by the shaded areas in Fig. 1. Thus, all of the specimens fracture from the maximum section of the largest inclusion in the risk volume.
B. Effect of pre-treatment on the inclusion size
The inclusions obtained by fatigue method can be classified into two categories: MnS inclusions in wheel steel and oxide inclusions in axle steel. It has been reported that the morphology evolution of MnS can be divided into three steps with an increase in the soaking temperature and soaking time: (i) shrinkage occurred in the longitudinal direction of the slender MnS; (ii) expansion in radial direction which causes the split of the MnS; (iii) eventually, the spherical particles emerged from the split parts. Reference Shao, Wang, Jiang, Wang and Huang24,Reference Shao, Wang, Jiang, Wang, Huang and Ji25 The inclusion size is hardly changed during the first two steps. Since the split does not occur for the slender MnS in this study, it can be assumed that the size of MnS inclusion cannot be influenced by the pre-treatment. Besides, Shao et al. have shown that the shape of MnS inclusion is significantly changed only when the soaking temperature reaches 1200 °C at a soaking time of more than 3 h. Reference Shao, Wang, Jiang, Wang and Huang24 Burnakov et al. have shown that the partial solution of the oxide inclusions occurs only when the heating temperature is more than 1000 °C. Reference Burnakov, Khasin, Danilov, Oshchepkov and Listkova26 In this study, the fatigue specimens were pre-treated at a maximum temperature of 810 °C with a corresponding soaking time of 0.5 h. Therefore, the inclusion sizes cannot be affected by the pre-treatment.
C. Comparison of the inclusion sizes obtained by different methods
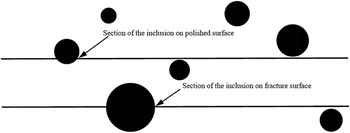
As shown in Fig. 8, inclusion sizes of wheel steel obtained by fatigue testing are significantly larger than those obtained by surface analysis. One reason for the result is that the inclusion observed on the fracture surface is the largest one in the risk volume, while the inclusion observed on the polished surface is rarely the largest one, as shown in Fig. 9. The other reason is that the tested volume evaluated by fatigue testing is much larger than that evaluated by surface analysis. In this study, the tested volume of every standard inspection area, which is defined as the product of the standard inspection area and the mean value of the inclusion sizes, Reference Atkinson and Shi10 is only 0.001057146 mm3. However, the tested volume of every fatigue specimen, i.e. the risk volume, is 486 mm3. This means that the obtained inclusion is just one, which is rarely the maximum, in the volume of 0.001057146 mm3 when evaluated by surface analysis, while the inclusion evaluated by fatigue testing is the largest one in the volume of 486 mm3.
Schematic illustration of the evaluated inclusions on a polished surface and a fracture surface.

The inclusion sizes of wheel steel obtained by fatigue testing are larger than those of the axle steel, as shown in Fig. 8. This is consistent with the fact that the control over the largest inclusion in axle steel is stricter than that in wheel steel. However, the inclusion sizes of wheel steel obtained by surface analysis are smaller than those of the axle steel obtained by fatigue testing. This means that the representativity of the evaluation method proposed in this study is higher than that of the traditional method.
D. Validation of the fatigue method
1. Prediction of the maximum inclusion size in a given material volume
Fatigue strength of a large scale component is controlled by the largest inclusion in the material when the component fractures from the internal inclusion. Meanwhile, several applications have shown that the SEV method proposed by Murakami Reference Murakami and Beretta9,Reference Murakami and Usuki11 is the most significant method for estimating the size of the maximum inclusion in a given material volume. Consequently, the maximum inclusion size in the full-scale railway wheel is estimated by SEV method. According to this method, the maximum inclusion size in every control volume V 0 is collected. And then, the data are analyzed with the Gumbel extreme value distribution function:
 $$G\left( {x,\lambda ,\delta } \right) = P\left( {X \,\,\le\,\, x} \right) = \exp \left[ { - \exp \left( { - {{x - \lambda } \over \delta }} \right)} \right]\quad ,$$
where G(x, λ, δ) is the probability that the largest inclusion is no larger than size x, x is the variable, and λ and δ are the location and scale parameters, respectively.
The largest inclusion size
 $x = \sqrt {{\rm{are}}{{\rm{a}}_{\max }}}$
in each control volume V
0 is measured. This is repeated for N control volumes. Then, the cumulative probability G(x
i
) of the ith largest maximum inclusion size x
i
can be calculated by:
 $$G\left( {{x_i}} \right) = {i \over {N + 1}} = \exp \left[ { - \exp \left( { - {{{x_i} - \lambda } \over \delta }} \right)} \right]\quad {\rm{,}}$$
where x i is the ith value of the inclusion sizes which are classified, starting from the smallest, and ranked with i = 1, 2, …, N. The values of δ and λ can be estimated by the maximum likelihood method from the largest inclusion sizes measured in N control volumes, x 1, x 2, …, x N . The likelihood is calculated by the product of the probability density functions corresponding to Eq. (3):
 $$L = \prod\limits_{i = 1}^n {{1 \over \delta }\exp \left\{ { - \left[ {{{{x_i} - \lambda } \over \delta } + \exp \left( { - {{{x_i} - \lambda } \over \delta }} \right)} \right]} \right\}} \quad {\rm{.}}$$
The estimated values of δ and λ are obtained when the L reaches the maximum value. The values of λ and δ are estimated as 72.92 and 23.44 μm, respectively, using the data obtained by fatigue method, while they are estimated as 9.22 and 4.46 μm, respectively, using the data obtained by surface analysis.
Considering a component with a material volume V, the distribution function of the maximum inclusion size in volume V can be expressed by the statistics of extremes as:
 $$F{\left( {{{\sqrt {{\rm{area}}} }_{\max }}} \right)_{{V_0}}} = {\left[ {F{{\left( {{{\sqrt {{\rm{area}}} }_{\max }}} \right)}_V}} \right]^{{V \mathord{\left/ {\vphantom {V {{V_0}}}} \right. \kern-\nulldelimiterspace} {{V_0}}}}}\quad .$$
By applying the transformation of Eq. (6) to the Gumbel distribution of maximum inclusion size in V 0, the maximum inclusion size in volume V, which is denoted by x V , can be obtained by solving the equation G(x V ) = 1 − 1/T. Then
 $${{{x_V} - \lambda } \over \delta } = - \ln \left[ { - \ln \left( {1 - {1 \mathord{\left/ {\vphantom {1 T}} \right. \kern-\nulldelimiterspace} T}} \right)} \right]\quad ,$$
where T, the return period, is defined as T = V/V 0.
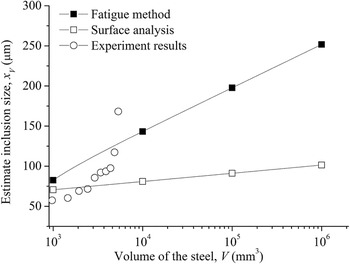
The control volume V 0 of every standard inspection area is 0.001057146 mm3, while that of every fatigue specimen is 486 mm3. According to Eq. (7), the data obtained by surface analysis and fatigue method were applied to estimate the maximum inclusion sizes in different volumes of wheel steel, respectively. The estimated results are shown in Fig. 10. The size of the maximum inclusion increases with an increase in the volume of wheel steel. The maximum inclusion size in a given material volume estimated according to the data obtained by fatigue method is obviously larger than that estimated according to the data obtained by surface analysis.
The maximum inclusion size in different volumes of wheel steel estimated by the SEV method.

2. Validation
The inclusion sizes observed from 11 ultrasonic fatigue specimens of wheel steel are classified from the smallest to the largest and x i is the ith value of the inclusion sizes (i = 1, 2, …, 11). The maximum inclusion size in the steel with a volume of V i (V i = i × V 0) is then not smaller than x i . The experiment data (V i , x i ) are plotted in Fig. 10 to explain the accuracy of both of the estimated results. Since x i is the minimum value of the maximum inclusion size in the volume of V i , a reasonable estimated inclusion size ought to be larger than x i . Therefore, compared with surface analysis, fatigue method gives a more accurate estimated result, since the estimated values based on fatigue method are larger than most of the experiment data. However, the prediction using the data obtained by surface analysis underestimates the inclusion size because the estimated values based on surface analysis are close to or smaller than most of the experiment data.
The evaluation method proposed in this study can be used for the fatigue design of component made from medium strength steel, such as railway wheel and railway axle. This would improve the security of the component, compared with using the traditional evaluation method. It is also useful for improving the cleanliness of medium strength steel during steel-making process.
V. CONCLUSIONS
-
(1) The maximum inclusion size in the fatigue specimen of medium strength steel was successfully obtained by ultrasonic fatigue testing using large risk volume specimens under water-cooling condition.
-
(2) Heat treatment and oxynitrocarburization can be conducted to ensure internal inclusion-induced fatigue fracture during the fatigue testing.
-
(3) Evaluation of the inclusion size by the proposed method is more accurate than the traditional approach based on inclusion size characterization from arbitrary two dimensional cross sections.
-
(4) As the method is based on fatigue testing in the ultrasonic frequency regime, it can be conducted in a reasonable amount of time.
ACKNOWLEDGMENTS
This work was supported by Basic Research Association Foundation of High – speed Rail (U 1134202 and U 1334206), the 2014 Doctoral Innovation Funds of Southwest Jiaotong University and the Fundamental Research Funds for the Central Universities.