

There is a long-standing historical model in which modern urban life – of the kind firmly established in eighteenth-century London – involves the separation of humans from nature and, particularly, the animal world. At the heart of this process, it is often claimed, was a rapid shift from animal-energy to a system of production driven by steam.Footnote 1 From this growing isolation, Keith Thomas argues, urbanites developed new ‘feelings’ towards animals. Londoners, above all, came ‘to think of animals as pets rather than working livestock’ and thus assumed a leading role in the nation's campaigns against cruelty.Footnote 2
Thomas’ claim has since been criticized by Harriet Ritvo, Hilda Kean, Diana Donald and others, each of whom has refuted the notion that animals were peripheral in nineteenth-century London. These studies have, however, tended to focus on the rise of humanitarianism and issues relating to animal cruelty rather than exploring animals in urban, industrial and economic life more broadly.Footnote 3 Despite the recent growth of animal studies in cultural history, literary studies and sociology, the core assumption of a decline in the importance of animal power during the English industrial revolution has not been tested systematically. Furthermore, despite extensive work in recent years – some of which highlights the need to look beyond a narrow band of critical technologies – equine power continues to be sidelined by steam and machinery.Footnote 4 The need for reassessment and further research is underlined by the pioneering work of Clay McShane, Joel Tarr, Ann Norton Greene and David Edgerton on the role of horses in the urbanization and industrialization of North America.Footnote 5 The situation in Britain demands similar scrutiny.
It is argued here that London's impressive economic growth in the eighteenth century, accompanied by dramatic changes in the life and fabric of the city, was entwined with the increasing number and significance of horses working on its streets, and that these animals were capable of producing major changes in the city's industrial operations. In doing so, I build on F.M.L. Thompson's assertion that Victorian England was ‘the horse drawn society’ – despite and often because of the expansion of the railways – with an examination of an earlier phase of the industrial revolution, in which the horse played a critical role.Footnote 6 The eighteenth century was, as Daniel Roche asserts in reference to France, ‘the hinge-period’ in the relationship between men and horses, in the sense that equine work became increasingly ‘structured . . . into a function of the energy needs of town and countryside’. This process involved major changes in the production of horses – to achieve particular specifications in size, speed, strength and stamina – but also in the ‘technologies of control . . . of horses; the daily linkage to human effort’. In contrast to Keith Thomas, Roche rightly associates the eighteenth century with the strengthening of man's bond with horses, through ‘the world of work’.Footnote 7 Evidence of this phenomenon is particularly striking in London, where urbanization and industrialization greatly expanded opportunities for men and horses to work together.Footnote 8
This article focuses on the role played by horses in brewing, a leading metropolitan industry which relied heavily on equine engines and haulage. It reveals that the introduction of horse-mills led to a step change in production long before the advent of steam power. Moreover, although steam did replace equine power in certain areas of industry, it also had the paradoxical effect of increasing demand for horses elsewhere.
Brewing warrants special attention for two reasons. First, since London's brewery horses worked, and were generally stabled, within the city limits, these animals were fully integrated into the life and economy of the city. Secondly, like many other metropolitan industries, brewing underwent considerable mechanization in this period whilst continuing to rely heavily on horses for mechanical power and draught. Thus, the brewery horse provides valuable insights into several other equine-dependent industries which played a key role in London's economic growth, such as tanning and dyeing; paint, porcelain, glass and snuff production; brick-making and other building trades. While there is considerable evidence of the work performed by horses in these industries, brewing is particularly well documented.Footnote 9
Equine power underpinned metropolitan industry on a massive scale. As well as providing traction for the carriage of raw materials and finished goods, horses powered mills and other machinery for myriad trades. As McShane and Tarr have noted, the ‘horse-power machine’ succeeded in multiple forms by converting the ‘linear, ambulatory, slightly rhythmic gait of the animal’ to the rotary motion needed for machinery. Thus, the monotonous plodding of the urban horse ‘powered mills . . . raised and pumped water, sawed wood, drove hoisting devices and construction equipment’.Footnote 10 Such work often represented the final phase in an animal's working life and historians of animal cruelty have referred to their labours as ‘the most shaming instance of the mercenary callousness of the age’.Footnote 11 Yet, by focusing on suffering, such studies have tended to neglect the social and economic value of animal labour. While acknowledging that working animals suffered a great deal in this period, this article is concerned with the remarkable contribution of horses to the English industrial revolution.Footnote 12
The rise of brewing and the contribution of horses
Brewing was ‘the largest scale’ operation in London's food and drink manufacturing sector, itself a crucial element of metropolitan industry.Footnote 13 The scale and sophistication of the trade increased dramatically in the second half of the eighteenth century and as Peter Mathias asserts, it was not until the nineteenth century that the great London breweries were ‘eclipsed in size and capital’ by other industrial concerns in Britain. This astonishing growth reflected both an expanding metropolitan market for beer and major advances in large-scale brewing methods ‘with its attendant developments in marketing and distribution’ and impressive ‘mechanical innovation’.Footnote 14
Between the 1720s and 1790s, the total number of breweries in London fluctuated between 140 and 180, declining from the 1750s as the biggest operations began to dominate the market.Footnote 15 In 1748, William and Felix Calvert each brewed 50,000 barrels for the first time, prompting a dramatic increase in production among an elite circle of brewers. Samuel Whitbread was among the first to achieve 100,000 barrels in 1776 and doubled this figure in just 20 years, only to be overtaken by Barclay Perkins. In 1815, production at their Southwark site surmounted 300,000 barrels.Footnote 16 In his survey of the industry, Mathias noted the importance of horses, asserting that their numbers in a brewer's inventory offer the best indication of the ‘extent of their trade’.Footnote 17 Such observations can, however, be expanded through closer examination of the ways in which equine labour underpinned the modernization process. Moreover, most historians have accredited mass-production brewing to the adoption of the steam engine, but such ‘innovation-centric’ assumptions can be challenged by showing that the brewing revolution relied on the horse long before the arrival of steam. Furthermore, when new engines stirred into action, the need for equine labour was re-negotiated but never diminished.
Truman brewery horse stock, 1790–1835
Source: LMA, B/THB/B/3–25/A, Truman brewery rest books.

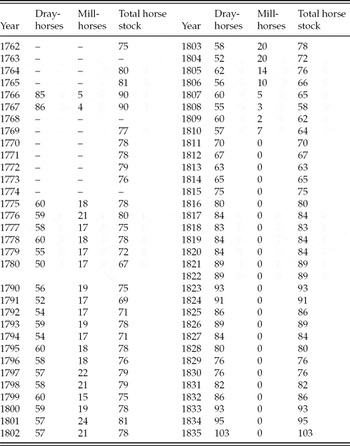
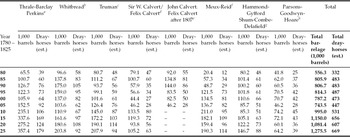
The extant source material offers a patchy indication of the number of horses employed by London's breweries, from which it is impossible to make precise industry-wide calculations. The most complete record for the Hanoverian period appears in the Truman rest books (1741–1837, with a gap from 1780–90). As shown in Table 1 and Figure 1, after 1775 the brewery consistently recorded the number of dray- and mill-horses in its service.Footnote 18 Unfortunately, no such record survives for Truman's competitors.Footnote 19 Using annual production data, Mathias proposed a series of convincing ratios for the number of dray-horses required for different levels of distribution capability. He calculated that a trade of between 60,000 and 100,000 barrels would require 50–60 horses, rising to 80–90 for 200,000 barrels and 150 for 300,000 barrels. Using the higher figure in each case, I have calculated the approximate number of dray-horses employed by the eight largest breweries at five-year intervals from 1780 to 1825 (see Table 2).Footnote 20 These companies would have needed approximately 332 animals in 1780. By 1825, this figure had doubled to 669.
Truman brewery dray- and mill-horse stock, 1762–80, 1790–1835

Source: LMA, B/THB/B/3–25/A, Truman brewery rest books, 1759–80 and 1790–1836.
Barrelage and number of dray-horses employed by eight largest London breweries, 1780–1825

a Anchor, Deadman's Place, Southwark.
b White Hart, Chiswell Street.
c Black Eagle, Spitalfields.
d Hour Glass, Upper Thames Street.
e Peacock, Whitecross Street.
f Griffin, Liquorpond Street.
g Woodyard, Castle Street, Long Acre.
h Red Lion, St Katherine's, East Smithfield.
Source: Mathias, The Brewing Industry, 79 and Table 43.
The Truman rest books suggest a ratio of mill- to dray-horses of around 1:3 in 1780 and 1:4.5 in 1805, for reasons outlined below. We can, therefore, assume that in 1780 the same breweries employed approximately 111 mill-horses, falling to 99 in 1805. This would amount to a total stock of 443 horses in 1780, rising to 546 in 1805. As discussed below, the decline of mill-horse numbers from the late eighteenth century was outweighed by a simultaneous rise in dray-horses. Considering that the total number of brewers in the Bills of Mortality fluctuated between 140 and 160 in this period – most of whom ran much smaller operations than those discussed above – as many as a thousand horses were conceivably employed in total.Footnote 21 To appreciate their full significance, let us consider the nature of their work, commencing with the production process and the mill-horse.
As noted above, traditional studies of the industrial revolution have focused overwhelmingly on the contribution of the steam engine. Those who have wrongly downplayed London's role as an industrial and manufacturing centre have argued that steam power was not widely embraced, ensuring that it remained ‘traditional in technology’.Footnote 22 Conversely, the swift adoption of steam by London's brewers has been cited as evidence of the city's industrial importance.Footnote 23 While the latter assertion is well founded, both sides of this historiography nevertheless imply that horses were an outdated and insignificant technology. In a recent architectural study of breweries, Lynn Pearson asserted that the transformation from the small-scale brewhouse to the industrial brewery ‘was powered by two factors: the availability of a mass market for beer . . . and by power itself in the form of the steam engine’.Footnote 24
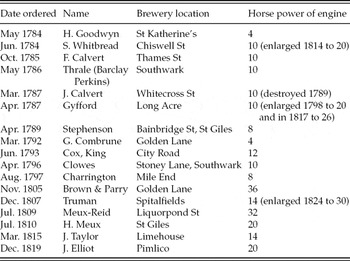
Brewing was indeed one of the first metropolitan industries to take up steam but none of its engines were installed before 1784 and two of the city's largest concerns, Truman and Meux-Reid, continued to rely on horse-mills for a further quarter of a century. Prior to 1784, the mechanical components of all large-scale metropolitan breweries were powered by mill-horses. Nor was steam's triumph over the mill-horse immediate. As late as 1807, five major brewers were still reliant on horse-engines. It was only in 1820, when J. Elliot's Pimlico-based brewery converted, that the trade truly committed to steam (see Table 3).
Orders placed for steam engines by London's breweries, 1784–1819

Source: Mathias, The Brewing Industry, 85.
Despite its remarkable contribution, the mill-horse has been almost entirely omitted from the history of brewing, offering little glamour to compete with the fanfare of steam. Mill-horses were ‘old broken creatures capable only of infinite plodding’. Often blind and nearing the end of their working lives, they were seldom purchased for more than £5, marking a sharp contrast with their dray counterparts, which fetched 10 times this amount. In 1766, Truman valued his entire set of five mill-horses at only £7 10s.Footnote 25 These workers were almost permanently hidden from public view: the ‘mill-house’ was enclosed and removed from the glistening vats which attracted visitors, despite the fact that these animals drove the major transformation in large-scale brewing in the first half of the eighteenth century. In 1744, the brewer William Ellis described two major innovations in pumping systems, both of which relied on the power of the mill-horse. ‘Formerly’, he wrote
water-pumps . . . were work'd [by men] . . . But the present Contrivance works both these Pumps with more Expedition by a single Horse put into the Malt-mill . . . which saves great Part of a Man's Wages . . . the Wort-pump . . . is now likewise supplied by the Horse-mill . . . and will with great Expedition throw up the Worts . . . into the Copper.Footnote 26
It has largely been forgotten that nearly 50 years before the arrival of steam engines, London's major breweries were already highly mechanized. Crucially, the introduction of the rotative engine had satisfied the brewer's need for ‘steady milling and pumping over long periods at reasonable speeds’. Yet, this innovative technology would have been nothing without an ‘eminently suited’ power source, and for half a century this remained the circular plodding of horses.Footnote 27 Indeed, by increasing efficiency and cutting human labour costs, the mill-horse played a crucial role in the dramatic expansion of production in this period, upon which all further developments were founded.
On the rare occasions when mill-horses have been discussed, they have generally been viewed as case-studies of abuse, an approach echoing certain kinds of Georgian commentary. In 1785, ‘The High Mettled Racer’, a song performed on the London stage, lamented the pitiful decline of a used-up racehorse. It gained national fame and was ‘quickly transmuted into graphic imagery’.Footnote 28 An engraving after Robert Cruickshank from 1831 depicts the forlorn ex-racer, now ‘Blind, old, lean, and feeble’ tugging round a mill. At the doorway, a corpulent businessman watches the beast relinquish its last breath for his profit.Footnote 29 In sharp contrast to this tradition, however, other strands of eighteenth-century discourse, including the literature of science and engineering, actively celebrated the contribution of equine labour, treating animals without sentiment, but as vital elements in sophisticated mechanical processes.Footnote 30
In technological terms, the mill-horse became a victim of its own success. In the second half of the eighteenth century, their employment increased substantially, so that by 1780, a large concern needed at least 20, with teams of four ‘working together in shifts’.Footnote 31 While far less expensive than dray-horses, they were just as costly to maintain, ceaselessly demanding provender and human care. While they served the mechanical needs of the brewery more than adequately, they imposed ‘the inconveniencies of short-shift working, fatigue, early death and replacement’.Footnote 32 Thus further expansion, requiring financial as well as mechanical efficiency, prompted moves to replace mill-horses with a less costly alternative.
Yet, the Boulton and Watt engine was of no use to brewers until 1782, when its original pumping capability was adapted for the turning of machinery. Until that point, brewers had no alternative to the horse wheel. So long as they needed horses to grind malt, a steam engine for pumping alone was neither practical nor cost effective. Once the new engine was available, several London brewers placed early orders and while ease of installation varied between sites, the transition appears to have been remarkably smooth; engines were simply ‘put to’ the wheel of the old horse-mill.Footnote 33 In 1786, one of Whitbread's assistants, Joseph Delafield, wrote to his brother, describing the financial benefits of steam less than a year after installation:
Our wheel . . . required 6 horses to turn it, but we ordered our engine the power of ten, and the work it does we think is equal to fourteen horses, for we grind with all four mills about 40 quarters an hour . . . We put aside by it full 24 horses, which to keep up and feed did not cost less per annum than £40 a head. The expense of erection was about £1,000. It consumes only a bushel of coals an hour.Footnote 34
Knowing now that steam revolutionized the brewing industry, we should nevertheless not assume that brewers found the decision to exchange their mill-horses an easy one.Footnote 35 Indeed, brewers’ correspondence suggests an anxious awareness of the risks involved. Barclay Perkins was the first company to enquire about the Boulton and Watt engine but hesitated before placing an order. As a result, they were overtaken by Goodwyn, Whitbread and Felix Calvert who were ‘more easily convinced’ by its promised advantages.Footnote 36 Yet, even Goodwyn, the first to install, retained some of his mill-horses, perhaps fearing that the new technology might let him down. In July 1784, he wrote to Boulton and Watt
I have parted from one half of my Mill Horses already, & in hopes that you my Engineer, will render them all needless . . . I am deliberating on the sale of the remainder but shall probably keep two or three until we are perfect masters of the conduct of our new works.Footnote 37
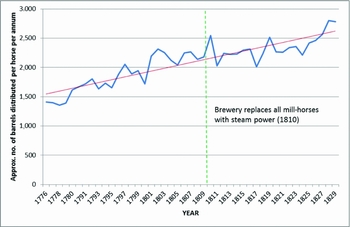
Despite being London's fifth largest brewery in 1790, Truman's Black Eagle delayed placing an order until December 1807 (see Table 3). Rest books covering this transition period suggest that, even after installation, the company was reluctant to dispense with its animals altogether. Truman's mill-horse stock reached its peak of 24 in 1801; the company's steam engine was ordered six years later and, like Goodwyn, Truman anticipated its success by scaling down from ten to five animals. The engine was presumably installed by the time of the 1808 summer rest, by which time all but three mill-horses had been sold. However, by the end of 1810, the company had acquired new mill-horses, returning to a total of seven. Only in 1811, three years after installation, did the brewery depend wholly on steam (see Table 1 and Figure 1).Footnote 38 This was the situation for London's largest and most progressive breweries. Few seriously considered installing an engine until they had reached 20,000 barrels. Yet they only represented around a quarter of the 100–20 companies operating in the early 1800s.Footnote 39 In 1799, only around 10 per cent of the city's breweries owned steam engines, rising to 15 per cent in 1805.Footnote 40 At the turn of the nineteenth century, therefore, close to 100 breweries continued to rely on mill-horses.
Moreover, by no means did the triumph of steam over the mill-horse mark the end of equine employment. In fact, as steam boosted production, brewers needed to expand distribution operations at an unprecedented rate: this was the age of the giant dray-horse.
The dray-horse
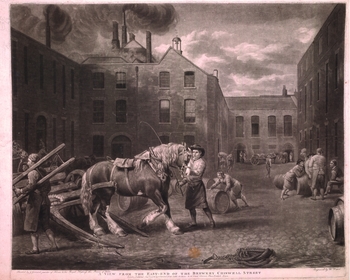
In the 1790s, George Garrard (1760–1826), an artist best known for his livestock portraiture, completed a dramatic depiction of London's most important brewery, Whitbread's White Hart on Chiswell Street. Samuel Whitbread I (1720–96) and II (1758–1815) were Garrard's greatest patrons and although they did not commission this particular work, it clearly reflects their tastes and philosophy. The original painting is now lost but the image gained much wider appeal as an aquatint engraving (see Figure 2).Footnote 41 The brewery is shown as a hive of industrious activity: a series of large chimneys belch black smoke while in the yard, several workers go about their business, one rolling a hogshead, another fetching a timber frame. Yet, the painting is not dominated by men or machinery, but a gigantic horse which occupies much of the foreground. From every angle, this is an impressive beast, appearing to combine great strength with an intelligent understanding of its role. One is struck by the animal's self-control when backing into the shafts of its dray, underlined by the relaxed confidence of its attendant. Its coat gleams with good health like a Stubbsian thoroughbred, and its white legs brilliantly contrast their sooty industrial surroundings. This is an animal of prestige, valued by its owner just as the aristocracy esteemed their champion racers. Yet, Stephen Deuchar observes that Garrard's choice of pose emulated ‘Stubbs’ Horse Frightened by a Lion’, with the important difference that his ‘solid English horse’ appears without the same ‘sense of drama and suggestion of fear’.Footnote 42 Deuchar convincingly suggests that this animal was thus emblematic of ‘London's calm and orderly atmosphere’, and that the painting juxtaposed the chaos then unfolding in revolutionary France. The Whitbreads would certainly have approved of such a celebration of orderly industriousness, themes which permeate the family's art collection at Southill.Footnote 43
W. Ward after George Garrard, View of the East End of Whitbread's Brewery in Chiswell St (aquatint, 1792). © The British Library Board (Maps K.Top.27.32.1).

Several other grand paintings of the brewing industry celebrate dray-horses in this way. In Dean Wolstenholme's Hour Glass Brewery (1821), a giant white horse belonging to Felix Calvert takes centre stage. Yet these striking depictions have been somewhat overlooked in studies such as Diana Donald's nevertheless invaluable, Picturing Animals in Britain, which tends to juxtapose horses of ‘prosperity’ with those of ‘adversity’; the magnificence of Stubbs versus the horror of George Cruickshank's The Knacker's Yard (1830–31).Footnote 44 Clearly, Garrard's image fits neither category. It represents a distinctive and alternative strand in the visual culture of the eighteenth-century horse. As a recent study of farm animal portraiture argued, ‘British heavy horses were the most desirable in the world’ and were bred with great enthusiasm.Footnote 45
In addition to their leading presence in brewery landscapes, individual dray-horses inspired admiring portraits by artists better known for their depictions of racehorses and aristocratic hunting scenes. In 1798, the celebrated animal painter, John Nost Sartorius painted a veteran dray-horse known to its owners as Old Brown. Despite being aged 35, this animal displays considerable strength, elegance and pride. The horse appears unharnessed, free from the trappings of working life, but its achievements are symbolized by the barrels in the background, a tranquil corner of the brewer's yard. Another painting by and print after (1818) John Christian Zeitter (see Figure 3), captures the power and prestige of a pair of more youthful animals at work.Footnote 46 Owned by Reid's Griffin brewhouse, the heroically named ‘Pirate’ and ‘Outlaw’ are shown with tails swishing and muscles bulging as they prepare to haul barrels from the depths of a cellar. One of the horses boldly turns its head to meet our gaze, underscoring its supreme confidence.
J. Egan after J.C. Zeitter, Pirate and Outlaw (engraving, c.1818). © Rothamsted Research Ltd.

The immense power and bulk conveyed by these images was not the result of artistic flattery. London's brewers invested huge sums to secure the finest Clydesdales. Most of these horses were bred in the Midlands and were first sold to country dealers. Between the ages of two and five, they were generally worked on farms, often in Wiltshire, Berkshire and Hampshire. Brewers from the metropolis sought out the best of these animals either through dealers or by visiting home-county horse fairs, including those at Barnet, St Albans and Harlow.Footnote 47 Their value increased from approximately £16 in the middle of the century to £40 after 1800, exceeding that of many carriage horses.Footnote 48 Indeed, the qualities looked for in a dray-horse were no less specific than in a racehorse. William Youatt said they ‘should have a broad breast, and thick and upright shoulders . . . deep and round barrel, loins broad and high, ample quarters, thick fore-arms and thighs’, and much else besides.Footnote 49 The agricultural writer, John Middleton, observed that ‘as to strength and figure’ these animals were ‘scarcely to be equalled’.Footnote 50 They were ‘the strong dray-horses’ whose size and skill ‘amazed visitors to London’ long into the nineteenth century. Not only were they ‘the best symbol of large-scale brewing . . . apart from the giant vat’, but dray-horses also represented the strength and ambition of metropolitan industry and commerce itself. As discussed below, dray-horses doubled as effective mobile marketing tools.Footnote 51
These animals attest to two key strands of draught-horse spectacle: visions of cruelty on the one hand and advertising on four legs on the other. By focusing on the former, previous studies have neglected alternative, more positive, images of working animals and oversimplified the nexus of contemporary attitudes. Eighteenth- and early nineteenth-century commentators often condemned the abuse of wretched, overworked animals but they also admired what they saw as hard-worked but well-maintained ‘living-machines’.Footnote 52 John Lawrence lamented that the ‘management of draft-horses in town’ was ‘a cheerless and invidious topic to a considerate mind’ but emphasized that ‘an exception must be made, in favour of many noble-minded citizens of London, who demonstrate the best proofs of meriting the large property they possess, in the fine appearance, and high condition of their horses, and in the visible care and humanity of their servants’.Footnote 53
The striking physical attributes of the dray-horse reflected the heavy demands of the industry's distribution process. Whether alone or working in pairs, these horses were responsible for hauling a vehicle loaded with three 108 gallon butts of beer, collectively weighing 1.5 tons, between the brewery and its customers for 12 hours a day and sometimes longer.Footnote 54 The intensity of the work, the unforgiving nature of the vehicle and challenging metropolitan conditions demanded a special kind of strength and durability. Youatt noted that ‘over the badly-paved streets of the metropolis, and with the immense loads . . . great bulk and weight are necessary to stand the inevitable battering and shaking. Weight must be opposed by weight, or the horse would sometimes be quite thrown off his legs.’Footnote 55
Once outside a customer's premises, one horse would be removed from the dray to help lower the butts into the cellar and to raise up empties by ropes fixed to its harness. As well as requiring brute strength, these procedures demanded considerable intelligence from the animal. In 1868, an observer proclaimed:
the greatest [wonder] I ever saw was in London. I saw a brewers team lowering some butts of beer. The horse that performed this office, without any signal, raised the butts, and returned and lowered the rope: not a word or sign escaped the man at the top of the hole, who only waited to perform his part as methodically as his four footed mate did his. The cellaring finished, the horse took his place by the team . . . The man . . . then walked away; the team followed. Not one word passed, not even a motion of the whip.Footnote 56
In a similar vein, George Scharf the elder's illustrations of the butt-raising process, c. 1820–30, emphasize the extent to which efficiency relied on equine attributes.Footnote 57 The artist's necessarily rapid sketches show that well-trained horses freed draymen to arrange their hooks, ropes and ramps; to speak to the victualler and to prepare to move on. The dray-horse underlines Ann Norton Greene's observation that ‘In addition to being amenable to human direction and training, the horse has an excellent memory for patterns, and can memorize a work routine and perform it with little or no supervision.’Footnote 58 Therefore, while the persistent usefulness of the dray-horse is very much part of a general transportation narrative, it is also rooted in specific developments in the metropolitan brewing industry, which placed increasing demands on equine sagacity and skill.Footnote 59
The London dray-horse's work increased dramatically in the eighteenth century. In 1760, the Gentleman's Magazine noted that, in the 1690s, ‘beer was mostly fetched from the brewhouse by the customers themselves . . . so that the brewer entertained but few servants [and] few horses’.Footnote 60 By the 1750s, the situation had been transformed. Publicans scattered across a radius of a few miles now received monthly deliveries in a highly sophisticated system of supply.Footnote 61 A list of Whitbread's customers in 1800 reveals that horses setting out from the White Hart Brewery in Chiswell Street delivered to almost 400 victuallers peppering the metropolis from Paddington in the west (6.5 km away) to Woolwich in the east (12 km), and from Finchley in the north (13 km) to Peckham in the south (5.5 km).Footnote 62 Two-thirds of customers were located more than 1.5 km away. As David Barnett asserts, the fact that London's ‘outermost districts’ remained just ‘within the daily reach of a dray’ was an important advantage for the industry.Footnote 63 But mass distribution meant tough shifts for dray teams. A visitor to London in the early nineteenth century suggested that a major brewery's horses were ‘often sixteen hours in harness out of the twenty-four’.Footnote 64 By this time, a London dray-horse could haul a remarkable 2,000 barrels a year, weighing 1,000 tons.Footnote 65 Modern brewing thus required a special kind of horse, one which combined considerable intelligence with size, strength and stamina.
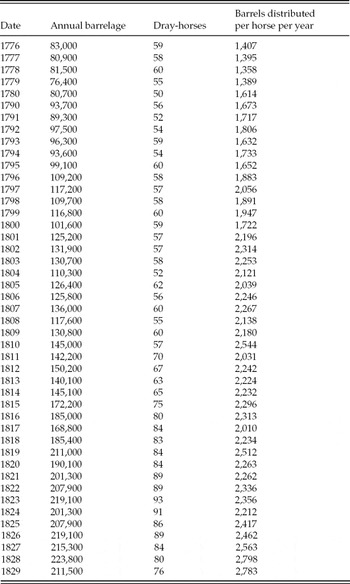
But did the intensity of work performed by dray-horses increase during the industrial revolution, as Voth has suggested it did in the human workforce?Footnote 66 The extant evidence makes statistical assessment difficult but the Truman records provide a useful starting point. Using the company's annual barrelage and dray-horse stock data, I have calculated the approximate number of barrels which each horse distributed per year, from 1776 to 1829. Unfortunately, the available evidence makes it impossible to begin this analysis any earlier and data is missing for the years 1781–89. Nevertheless, as shown in Table 4 and Figure 4, the Truman records convincingly suggest that dray-horse labour intensified by a significant degree during the industrial revolution. This change was somewhat irregular from year-to-year but followed a clear upward trend. In the five years, 1776–80, the average number of barrels distributed per horse was 1,433. By 1825–29, this had risen by a remarkable 82 per cent to 2,605. This finding is even more striking when we compare it to labour intensification in the human workforce. Voth estimated that the annual hours worked by Londoners increased from 2,288 in the 1750s to 3,366 in the 1830s, a rise of 47 per cent.Footnote 67 The use of data based on hours worked and tasks completed may preclude a precise comparison, but it seems reasonable to suggest that dray-horse labour intensified significantly more than human labour. Historians of animal cruelty would hardly be surprised by this finding, but it does not necessarily provide evidence of worsening treatment.
Intensity of work performed by Truman's dray-horses: approximate number of barrels distributed per horse annually, 1776–80, 1790–1829

Source: Mathias, The Brewing Industry, Table 43; LMA, B/THB/B/5–21, Truman brewery rest books.
Intensity of work performed by Truman's dray-horses: approximate number of barrels distributed by each horse per year, 1776–80, 1790–1829
Source: LMA, B/THB/B/5–21, Truman brewery rest books.

As suggested above, selective breeding altered the physical characteristics of dray-horses considerably during the industrial revolution, including improvements in their strength and stamina. There can be little doubt, therefore, that the average London dray-horse was born capable of more and heavier work in the 1820s than it had been 60 years earlier. Furthermore, anecdotal and quantitative evidence suggests that these capabilities were enhanced by significant improvements in nutrition and stable care during the industrial revolution. When Louis Simond visited Barclay Perkins’ dray-horses in the 1810s, he noted that ‘These colossuses are fed with a mixture of clover-hay, straw, and oats.’Footnote 68 Simond recognized that these hard-worked animals demanded a nutritionally rich and highly calorific diet. In the 1830s and 1840s, the average daily calorific consumption for a dray-horse at work was estimated at 38,000 Kcal.Footnote 69 By comparison, an average horse at rest requires between 12,000 and 15,000 Kcal.Footnote 70
Evidence of significant nutritional improvement during the industrial revolution is supported by the Truman brewery rest books, which provide unique insights into the diets of dray-horses from the 1770s and into the nineteenth century. Throughout the 1770s, Truman's animals were fed on hay; chaff (a mixture of cut meadow hay, straw and clover); wheat bran and pollard (reject flour). Yet by 1791, three nutritionally rich foodstuffs had been added to the menu: clover, beans and oats.Footnote 71 The nutritional benefits of these foods were well known by the time John Middleton published his View of the Agriculture of Middlesex (1798),Footnote 72 and in the 1830s, William Youatt wrote that oats afforded ‘the principal nourishment’ for horses and that beans – given principally in winter – added ‘materially to the vigor [sic] of the horse’, without which ‘many . . . will not stand hard work’.Footnote 73 Clover, an energy- and protein-rich legume, was another valuable addition to the dray-horse's diet, and was given in the late spring and summer as a supplement to hay. The introduction of these foodstuffs in the late eighteenth century must have been calculated to increase the muscle bulk and energy levels of Truman's dray-horses. Seen in the context of increased labour intensity, these dietary changes fuelled dray-horses for longer and heavier work.
In addition to improving their horses’ diets, metropolitan brewers provided increasingly sophisticated care for their animals. Major firms employed large teams of dedicated ‘horse keepers’ and draymen. In the 1790s, a third of Barclay Perkins’ workforce dealt directly with horses, a ratio likely to have been typical among its competitors.Footnote 74 Alexander McLeay described the painstaking care demanded of these men in the 1790s. The stables, he observed ‘are daily cleaned and littered, by men whose business it is to attend them night and day . . . they pay the greatest attention to their being and they are well littered at all seasons . . . They are . . . well rubbed down after they come in from work. The racks are always kept full of hay.’Footnote 75 Particular care was taken to protect the hooves of dray-horses, which suffered heavy wear on the streets of the metropolis. This necessitated a continuous programme of regular horse-shoe removal and replacement. In the first quarter of the nineteenth century, Truman's horses consumed approximately 1,200 shoes and 10,000 nails every year.Footnote 76 To make efficient use of their equine workforce, brewers had to maintain a sophisticated stable regime and keep detailed records. It is likely that all major brewers kept a ‘stable book’ of the kind which survives for Barclay Perkins for 1827–39.Footnote 77 Here, the company recorded weekly tallies of sick or lame animals, deaths, total stock and additional notes. In an average week in 1828, the brewery employed 126 horses, of which six had to be rested for reasons of sickness or lameness.Footnote 78 When Louis Simond visited a few years earlier he was impressed to find that none of these horses were sick, which he took as evidence of their superior care.Footnote 79 Yet, with so many animals stabled in close proximity, the rapid spread of disease posed a grave threat. In a single week in December 1827, Barclay Perkins workmen found three horses dead.Footnote 80 With so much capital invested in these animals and income so reliant on their services, brewers made huge efforts to avert the ravages of infection. Trade ledgers reveal that Whitbread spent large sums on medicine and farriery equipment and by the 1790s, he maintained two large ‘farrier's shops’ on-site.Footnote 81 The city's leading brewers constructed large and sophisticated stable complexes, which housed dray-horses in individual stalls and provided infirmaries for the treatment of sick and injured animals. A plan of the Anchor brewery in Southwark, dated 1774, features a sheltered wing for infected animals away from the main stable complex and indicates that large gates were used to seal the area as a further precaution against the spread of disease.Footnote 82
London's dray-horses were better bred, fed and cared for as the industrial revolution progressed but we should not romanticize their treatment. Breweries extracted as much work from their animals for as many years as they could physically deliver. The intensity of work was such that a dray-horse entering a brewer's service at 5 years old was generally worn out by the time it was 11 or 12.Footnote 83 Exploitation and superior care went hand-in-hand.
The brewer's horse in the steam age
As suggested, dray-horse numbers grew substantially in the steam age. The Truman rest books show that 25 years after selling its final mill-horses, the company's stock of dray-horses had almost doubled, from 57 to 103 (see Table 1 and Figure 1).Footnote 84 Such growth was not unusual. In the first quarter of the nineteenth century, Barclay Perkins became the largest brewing concern in London. The company installed its first engine in 1786, followed by another, three times its power, in 1832. The Barclay Perkins stable book indicates that this second engine dramatically increased distribution requirements. In the five years prior to installation, average dray-horse stock was 113. In the subsequent five years, this figure rose by more than a quarter to 143 followed, a few months later, by a sudden and much bigger influx. Between January and April 1839, an additional 30 dray-horses arrived, an increase of more than a fifth in less than four months. Either production had suddenly overtaken distribution levels or, more likely, the owners were planning ahead for future ambitious growth.Footnote 85
Into the second half of the nineteenth century, therefore, the accelerating expansion of London's breweries continued to rely on dray-horses. As noted by Gourvish and Wilson, London's brewers were ‘unable to use the railways for their town deliveries’ – the persistent core of their business – so ‘the number of draught horses went on increasing . . . as barrelages grew’.Footnote 86 Contemporary prints and photographs emphasize that well into the age of steam, these major industrialists were as dependent on horses as they had been in the mid-eighteenth century.Footnote 87
These images also highlight the remarkable extent to which dray-horses dominated the visual spectacle of brewing throughout the industrial revolution. Far from symbolizing a romantic bygone age, these animals advertised a flourishing modernity. This role even extended to a form of ‘industrial tourism’. From the 1780s, metropolitan breweries became must-see curiosities. As guides, brewers presented their stables and engine rooms with equal pride and as the following accounts show, visitors were keen to share in this celebration of the equine.
In May 1787, the London Chronicle reported that George III had visited Whitbread's brewery. Half an hour was spent examining the steam engine which ‘has saved much animal labour. But there remains much labour that cannot be saved. This particularly impressed the King; for he saw . . . 80 horses all in their places . . . [and] accurately guessed the height of [one] . . . which was really remarkable, no less than 17 hands three inches.’Footnote 88 At the turn of the century, a visit to the Meux brewery inspired the Frenchman Marc-August Pictet to write ‘I am still amazed by the things I saw there . . . a steam-engine, of the power of 28 horses . . . and fifty-eight magnificent horses, each worth £50, are employed to carry the beer throughout London and her environs.’Footnote 89 Likewise, on 4 June 1831, Truman hosted a group of politicians led by the prime minister, Lord Grey. After seeing the engine and taking dinner, they went ‘to the stables to see the horses’ where the lord chancellor ‘selected one of the best of them, and pointed out his merits’.Footnote 90
Orthodox accounts of the industrial revolution continue to place great emphasis on the perceived ‘substitution of inanimate for animate sources of power’.Footnote 91 The notion that machinery dispensed with human labour power has, however, been criticized by Raphael Samuel, who demonstrates that ‘hand technology’ and human sweat were central to Britain becoming ‘the workshop of the world’.Footnote 92 Yet, the animals which toiled alongside these people continue to be neglected.Footnote 93
In his recent Energy and the English Industrial Revolution, E.A. Wrigley acknowledges the importance of ‘Animal muscle power’ both in ‘land transport’ and ‘as a source of mechanical energy in industry’ in the eighteenth century. Yet, he argues, these animals also symbolized the ‘constraints of an organic economy’ because ‘muscle energy depended on plant photosynthesis’. Coal, he suggests, provided the critical ‘escape route’: by 1700, half of English energy consumption was supplied by coal, up from a tenth in the mid-sixteenth century, when animal and human power remained dominant. By the end of the eighteenth century, the proportion ‘exceeded three-quarters, and by 1850 was over 90 per cent’. Such calculations leave remarkably little room for the kind of equine usefulness identified in this article. As Wrigley admits, however, there are serious pitfalls in the use of energy consumption data to assess equine utility. Indeed, he acknowledges that ‘the energy output derived from draught animals rose much more substantially’ than current data suggests.Footnote 94 While the crucial significance of coal demands recognition, this need not obscure the accelerating exploitation of equine power long after steam's arrival.Footnote 95 As Roche asserts, the ‘massive increase in energy requirements’ witnessed in the nineteenth century created ‘absolutely no need to shed at a stroke the calorific inputs of the good old horse’.Footnote 96
This article emphasizes the need for ‘use-centred’ approaches to the study of technological progress, to look beyond novelty and to assess established technologies which continued to function alongside new ones. David Edgerton has stressed that even twentieth-century horsepower was ‘not a left-over from a pre-mechanical era; the gigantic horse-drawn metropolis of 1900 was new’.Footnote 97 In this vein, this article has sought to reassert the significance of animal technologies and the power of animals to make profound and far-reaching changes in society.Footnote 98 Since historians have focused so heavily on the triumph of the steam engine, they have too often denied the contribution of the ‘living’, ‘oat-fuelled’ machine.Footnote 99 The increasing use of equine labour well into the industrial age emphasizes that this age-old technology complemented, and was promoted by, the radical new technology of steam.Footnote 100 At the same time, the brewer's horse demonstrates the remarkable extent to which equine muscle underpinned London's often underestimated role as ‘the largest single business and industrial centre . . . of the world's first modern industrial economy’.Footnote 101
Employed across a plethora of metropolitan trades and services, the contribution of horses was vast. Yet, in exchange for these endeavours, they placed heavy demands on their employers and the city in which they lived. Their constant need for shelter, fuelling, grooming, shoeing and healing persistently shaped the architecture and social organization of the eighteenth-century metropolis. They were greedy consumers of urban infrastructures. To meet these requirements, draymen, hostlers, grooms, coachmen, farriers and many other equine workers entered a complex horse–human nexus which permeated the city. Working with horses thus demanded more than an occupational label; it involved a unique set of skills and behaviours, routines, living conditions and social interactions.
Nor was the contribution of horses uniformly positive. They represented a serious urban nuisance, incessantly producing noxious waste (which had to be collected and disposed of), posing a threat to human health and, through their natural recalcitrance, provoking traffic jams and terrible accidents. Horses were integral to London's economic development but their needs and behaviours were also deeply entwined in the social and cultural life of the city. Indeed, there were thousands of non-human animals – including horses, but also cattle, sheep, pigs, dogs, cats and vermin – at large in London in this period, which contributed to and intruded upon every aspect of its daily life. Unsurprisingly, therefore, contemporaries continually referred to these beasts, leaving a wealth of evidence for historians to examine their pervasive influence.
Yet, while ‘environmental historians have taken animals seriously as agents of historical change’ for several decades, there has been a lingering tendency to view cities as being somehow divorced from this process, as if they were produced only by human endeavour and social relations.Footnote 102 Such an approach threatens to exaggerate the artificial characteristics of cities and to downplay their complex relationship with the natural world. Furthermore, the category of the social has rarely acknowledged the extent of human interaction with animals in the city. Hanoverian London still tends to be thought of as the ‘City Full of People’ or the city built by people for people.Footnote 103 Instead, London (and all other historical cities) should be considered as the product of human and non-human animal interactions.