

Introduction
The choice between buying and renting is often a fundamental one. In the traditional view (at least in the USA), buying a house means putting down roots in a community and joining the middle class; renting a house or apartment is for transients. People buy cars to enhance their autonomy; car rentals are for vacations or business trips. Most people try to avoid renting furniture, clothes, and jewelry, though they may rent tuxedos or designer gowns for special occasions. These people seem to prefer the status and convenience of ownership. And while some commentators believe that younger generations are less averse to renting than their elders are, and the magnitude of the status differences of owning versus renting is highly context-dependent, ownership remains a mark of middle-class respectability, at least in the USA.
And yet the distinction between owning and renting is a slippery one. The emotional and cultural meanings of the two practices do not always map onto their economic functions. This creates opportunities for a kind of arbitrage – allowing businesses to extract higher payments from consumers by presenting a transaction as a purchase or rental, depending on what consumers value in the context. The legal structures of the transactions differ in the two cases, as do the labels attached to the transactions, but the transactions are economically identical – in the sense of generating the same cash flows, risks, etc.
A few examples illustrate the slippery distinction between owning and renting and the opportunities for arbitrage that follow:
• The law puts numerous restrictions on credit sales of furniture and other household goods to low-income consumers because of concerns about usurious interest rates and other abuses. However, businesses can avoid some of these restrictions by characterizing the transactions as “rentals,” even if they are functionally credit sales – as illustrated by the ubiquitous term “rent-to-own.”
• New York City encouraged taxi drivers to buy medallions from the city rather than rent them from existing owners. Financiers offered interest-only loans with no down payment that could never be paid off, effectively causing drivers to rent medallions when they thought they were buying them. Some 40% of drivers who bought medallions at an auction filed for bankruptcy.Footnote 1
• Homeownership has become a central component of the “American Dream” (Drew, Reference Drew2014; Reid, Reference Reid2014). Both the Clinton administration and the George W. Bush administration touted what they called the “ownership society,” encouraging people to buy houses on the theory that home ownership would strengthen communities and enable people to accumulate wealth. Regulators relaxed underwriting standards so that low-income people could (or seemingly could) afford homes, and banks offered a range of gimmicky loans – interest-only loans, balloon loans with teaser rates, variable-rate loans, and so on – that made homeownership affordable only in the short term. Ultimately, these policies contributed to a financial collapse and recession. But the Great Recession did little to hamper the cultural aspiration toward homeownership (Bracha & Jamison, Reference Bracha and Jamison2012).Footnote 2
• In the old days, students bought new or used textbooks at the start of school. Today, they face more complex options. On Amazon and university bookstore websites, they are given the choice to “buy” or “rent” textbooks (in both cases, either new or used). Since it is often very easy to resell textbooks that have been purchased, the two types of transactions are essentially identical, yet they are labeled differently with apparently different prices and terms.
Central to these examples is the ambiguous line between owning and renting. In the first example, sellers avoid laws that limit sales opportunities to low-income buyers by re-characterizing the sales as rentals while at the same time hinting that the outcome is ownership after all (“rent-to-own”). In the second and third examples, it appears that governments believed – perhaps naively – that ownership is necessarily better than renting while ignoring the practical economic differences between the two. The fourth example raises the possibility that sellers are using different labels for economically identical transactions, possibly to appeal to different types of buyers. All of the examples suggest the possibility of confusion between the normal or cultural meaning of ownership and the underlying legal terms of a transaction.
In common understanding, a person “buys” a good in order to obtain “ownership.” A person “rents” a good to obtain “possession” – or, more accurately, a possessory interest. In the case of land, the possessory interest is known as a tenancy or leasehold. (Oddly, there does not seem to be a word in common usage that refers to the type of possessory interest usually conferred by a rental or lease at the same level of generality as “ownership” – for example, “possessorship” or “rentership.”) Again in common understanding, a person who “owns” a good has absolute dominion over it or something close to that, and may keep the good indefinitely.Footnote 3 A person who “rents” a good must return it at the end of a period, so that someone else – usually the actual owner – enjoys the residual value. A person who rents also is usually constrained as to how they may use the good during the period of possession so that the owner's interest in its residual value is protected.
However, parties can vary these terms, to the extent of converting nominal rental transactions into actual purchase transactions and vice versa. Consider, for example, a 1-year car lease. The parties can retain the form of the lease while extending the lease period indefinitely by giving the lessee the option to extend the rental period (or to buy the car, converting a possessory interest into ownership) for a nominal amount of money. So that the “lessor” is fully compensated for the loss of residual value, the “rental” payments are increased. Because the lessee will be certain to exercise the option to extend the rental period indefinitely or to buy, the nominal lessee, rather than the nominal owner, has the interest in the residual value and can be expected to protect it whether or not the lease requires them to. Thus, while the legal form of the transaction is one in which the owner of the car leases it to a renter, the economic relationship is a purchase: the original owner transfers the residual value as well as possession to the other party in return for a series of payments over time, with the result that the other party becomes the “economic owner” but not the “legal owner.”
Similarly, the parties can retain the form of a sale while converting the transaction into a functional lease by providing that the “seller” will extend credit to the “buyer,” who makes payments periodically for less than the useful life of the car and by giving the “seller” the right to buy back the car for a nominal amount. Now the sale is functionally a lease, and to preserve the residual value the seller may insist that the buyer agree by contract not to overuse or misuse the property.
It follows that we need to distinguish two elements that are frequently treated together: (1) the nature of the property interest; and (2) the means by which a property interest is transferred from one person to another.
To understand the property interest, consider an item with a useful life of a fixed period, such as 1 year. At the beginning of the period, we can distinguish the current possessor or user of the good and the future possessor or user of the good. If the current possessor and future possessor are different people, we will say that the current possessor has a possessory interest and the future possessor has a residual interest. The current possessor is legally the “tenant” (in the case of land), or lessee. The future possessor is legally the “owner.”
The lessee (as we will call the current possessor, regardless of the type of property) may have acquired the interest in various ways: by making an upfront payment, by promising to make installment payments, by gift, and so on. The lessee may also be more or less constrained in how he or she may use the property. Thus, the essential economic distinction between leasing and owning is the distinction between current and future interests. Although in common language we use the word “owner” to refer to a person who has both interests as well as to a person who owns just the residual interest, this is just shorthand for saying that a single person owns both interests – effectively, an owner who leases to themselves. (This idea is reflected in the use of the term “implicit rent” that a homeowner enjoys.Footnote 4)
The choice between renting and owning reflects this basic distinction. A renter may improve property, or develop an attachment to it, and thus takes the risk of losing it or being held up by the owner at the end of the term. To avoid these costs, a person may prefer to buy. However, a buyer who expects to use the property for less than its useful life must incur the transaction cost of selling it, and also take the risk that the property will lose value. The buyer effectively makes an investment in the property, and thus may need to borrow or give up other investment opportunities (see Henderson & Ioannides, 1983). While the relative attraction of renting and buying thus depends on a range of factors – including the nature of the property, the efficiency of capital markets, transaction costs, and so on – the major determinant boils down to the intuitive one: whether a person who wants to use a property expects to benefit only from short-term use (less than useful life) rather than long-term use (full useful life).
But the psychological, emotional, and public policy issues surrounding ownership suggest that these narrow “rational” factors are not the whole story. The public policy examples above suggest a bias toward ownership, or what we will call “rent stigma”: people put greater value on owning than on leasing because they associate owning with wealth, autonomy, security, and similar advantages, as reflected by historical association (embodied in words such as “landlord”) and current practices (owning houses, jets, etc.). To test this idea, we start with the null hypothesis that people choose owning and leasing in a rational way – based on the economic payoffs of transactions rather than the labels attached to them. Thus, if given the choice between two transactions, one of which nominally involves a “purchase” (or a related term) that confers “ownership” (or a related term) and the other of which nominally involves a “rental” that confers merely a possessory interest, a person confronted with the choice will pick the transaction that produces the highest expected payoff and be uninfluenced by labels. If the two transactions are equivalent in terms of economic payoffs, a person will not prefer one transaction over the other (H0).
In contrast, the rent stigma hypothesis implies that people will choose owning over leasing even when the two transactions are equivalent in terms of economic payoffs (H1). Interestingly, rent stigma may be declining. The rise of “sharing economy” services for cars, houses, and even clothes appears to reflect both new opportunities created by technological developments and the shifting tastes of younger generations. Thus, if rent stigma exists, it may be fading (H2: positive correlation between age and preference for ownership).
But even if rent stigma exists, it is evident that in countless cases people do better by renting, and that they are frequently aware of this, so that they rent rather than buy. Renting is preferable when one expects to use an item for less than its useful life, as it avoids the transaction cost of selling the residual value and the risk of fluctuations in that residual value. We are interested in the questions, suggested by the examples above, of how sticky the rent stigma is and whether businesses can profit by presenting functional leases as purchases – that is, possessory interests as ownership interests – by manipulating the form of the transaction.Footnote 5
We conjecture that a buyer with a long-term interest in an item will prefer a “buy” transaction to a “lease” transaction even if the transactions are economically equivalent (H3). We also conjecture that a buyer who is uncertain about the residual value of a product will prefer renting to buying, even if the transactions are economically the same (H4).
The magnitude of the “rent stigma” may vary across types of properties: the stigma associated with renting houses, cars, and pieces of clothing may be larger than the stigma associated with renting books, music, movies, or computer programs. In the past, an elaborate record collection might elevate the status of a committed music aficionado; today, with the convenience of streaming services, the record collection might seem merely eccentric. Here, we focus on providing evidence for the existence of the “rent stigma” and provide no concrete hypotheses as to how it might vary across types and traits of properties. We thus focus on types of properties in which we suspect that the rent stigma would be greater and thus detectible: houses, cars, and laptop computers.
We test our hypotheses using two experiments. The first experiment is a within-subject lab experiment in which subjects respond to questions about hypothetical scenarios. These scenarios present subjects with economically identical but differently framed transactions (involving cars or houses), and we test whether they are influenced by the framing of a transaction as a purchase or lease. The second experiment is a between-subject field experiment in which participants are asked for their willingness to pay (WTP) for a laptop that is alternatively framed as a rental or purchase, although the transactions are economically identical. Whereas in the first experiment participants respond to hypothetical scenarios, in the second experiment participants perceive their responses as having real monetary implications.
Both experiments offer evidence for the rent stigma hypothesis (H1), but very weak or no evidence for the other hypotheses.
Related literature
There is a large literature on the empirical effects of ownership, especially homeownership (Fu, Reference Fu, Want, Ding, Zou and Zuo2013), but our focus is on the narrow slice of it that relates to the psychology of ownership. These studies have shown that people associate home ownership with safety, privacy, comfort, and autonomy.
In the cognitive psychology and behavioral economics literature, the starting point of discussion has been the endowment effect. In Thaler's (Reference Thaler1980) famous experiment, subjects valued coffee mugs more if they were first given them than if they were given the option to buy them. Thaler interpreted his findings to show that “ownership” of an item produces higher valuations. But as other scholars pointed out, the concept of ownership is ambiguous. Reb and Connolly (Reference Reb and Connolly2007) found in an experiment that the source of the endowment effect was possession rather than ownership in the legal sense. Subjects who possessed an item valued it more than subjects who did not possess it, but a formal ownership interest did not make a difference.
Nash and Stern (Reference Nash and Stern2009) focus on a longstanding debate in the legal literature as to whether private property is better understood as a “discrete asset” or as a “bundle of rights.” The discrete asset model emphasizes the owner's dominion over the property. The bundle of rights model emphasizes the specific legal rights that the property owner enjoys – for example, the rights to occupy, sell, and use. While legal scholars prefer the bundle of rights approach for its conceptual clarity, Nash and Stern hypothesize that when property rights are framed as bundles of rights, people assign less value to them. To test this hypothesis, the authors distributed a survey to incoming students that asked them to evaluate a laptop policy. One group of students were told that they would “own the laptop,” while another were told they would have “a set of rights” to the laptop that were then described, and included all of the normal rights of ownership. The authors find that students assign a higher value to the laptops when told that they own them than when told that they own rights to them.
Rather than examine different models of ownership, we look at ownership versus rental. Our hypothesis is that people associate wealth and status with ownership, and thus attach a stigma to rentals that tends to decrease when they plan to use property for the short term. Like Nash and Stern, we believe that the framing of a person's relationship to a piece of property can affect that person's valuation of it. But our focus is on the way property is characterized in day-to-day transactions rather than the different ways that legal scholars describe property.
Many of the previous studies that explore the factors that affect people's behavior of buying or renting use survey data and focus on actual housing tenure choices that people make. Although survey data provide an opportunity to observe patterns in the entire market, it is difficult to use them to show a “rent stigma” and to explore the factors contributing to it. The reason for this is that it is nearly impossible to rule out the possibility that unmeasured factors besides a stigma influence people's choice between renting and buying. To overcome this inherent limitation of using survey data, we take an experimental approach to explore “rent stigma” and the factors contributing to it.
Experiment 1
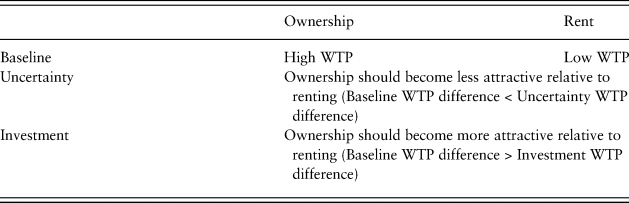
Participants were randomly exposed to one out of six hypothetical scenarios that described to them two economically equivalent options that varied by whether they were framed as ownership (buying) or leasehold (renting). The participants were then asked which option they would prefer (buy, rent, or no preference) and a set of demographic questions. Three of the scenarios involved buying or renting a car and three involved buying or renting a house. They are summarized in Table 1 (see the Appendix for the six scenarios used in the experiment), along with our predictions.
Design and hypotheses for Experiment 1.

The first, “baseline” car and house scenarios provide baselines and test for the rent stigma hypotheses (H1). In the baseline car scenario, participants were told that a company was selling a car that was new and in good condition. The list price was $20,000. The seller gave the buyer two options for acquiring the car:
Option 1: Buy. The customer could “buy” the car by paying $500 per month for 60 months, plus a $2000 administrative fee due on the last day of the 60-month period. At the end of the 60-month period, customers had the option to return the car, in which case the administrative fee would be waived. Thus, the total cash outlay would be $32,000 if customer kept the car and $30,000 if they returned it.
Option 2: Rent. The customer could “rent” the car by paying $500 per month. At the end of the 60-month period, the customer had the option to pay $2000, in which case they would be allowed to keep the car indefinitely. Thus, the total cash outlay would be $32,000 if the customer kept the car and $30,000 if they returned it.
Participants were asked to assume that they were temporarily low on cash so that they would either need to buy the car on credit or rent. They were asked whether, given their current financial circumstances, they would buy the car on credit or rent it. Participants were then asked about the total cash outlay if they kept or returned the car (a manipulation test) and whether and which changes in the administrative fee would affect their decision to buy or to rent.Footnote 6
The second, “uncertainty” car scenario was similar to the baseline scenario, but involved future uncertainties. Subjects were told, “Experts tell us that there is a 50% chance that next year driverless cars will be available, which means that the value of normal cars will decline to almost 0.” The future uncertainty meant that the average respondent would have a short-term interest in the asset; thus, according to H3, the respondent should prefer to rent relative to the baseline preference.
The third, “investment” car scenario involved an additional independent nonrefundable investment that would increase the long-term value of the car for the customer. Subjects were told, “You also plan to custom-paint the car to reflect your personal style.” According to H4, the respondent should prefer to buy, relative to the baseline preference, because the long-term possession of the car through its useful life would enable the customer to recover their investment.
The first house scenario is similar to the baseline car scenario. Participants were told that a company was selling a well-constructed house. They were then informed of the two economically equivalent options that were framed as either buying on credit or renting the house. For both cases, the total cash outlay would be $620,000 if the customer kept the house and $600,000 if the customer vacated it at the end of a 60-month period. Participants were asked to report their preferences and instructed to ignore tax-related issues.
The second house scenario is similar to the first one, but involved more uncertainty about the future (“You know, however, that in a few years your kids will leave home and your needs will change”). The third house scenario involved an independent investment that would increase the long-term value of the house for the client (“You know that when you move to the new house, your kids will have to move to a new school”).
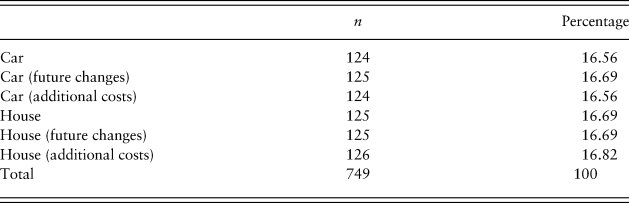
The design of the experiment was a between-person design: each participant was randomly assigned to one of the six scenarios. We implemented the experiment on the Qualtrics platform and administered it in December 2019 to participants who were recruited through RoiRocket – a research services provider. A total of 749 people who were all living in the USA participated in the experiment. Data on the demographics of participants and the allocation of participants across the experimental conditions are reported in the Appendix.
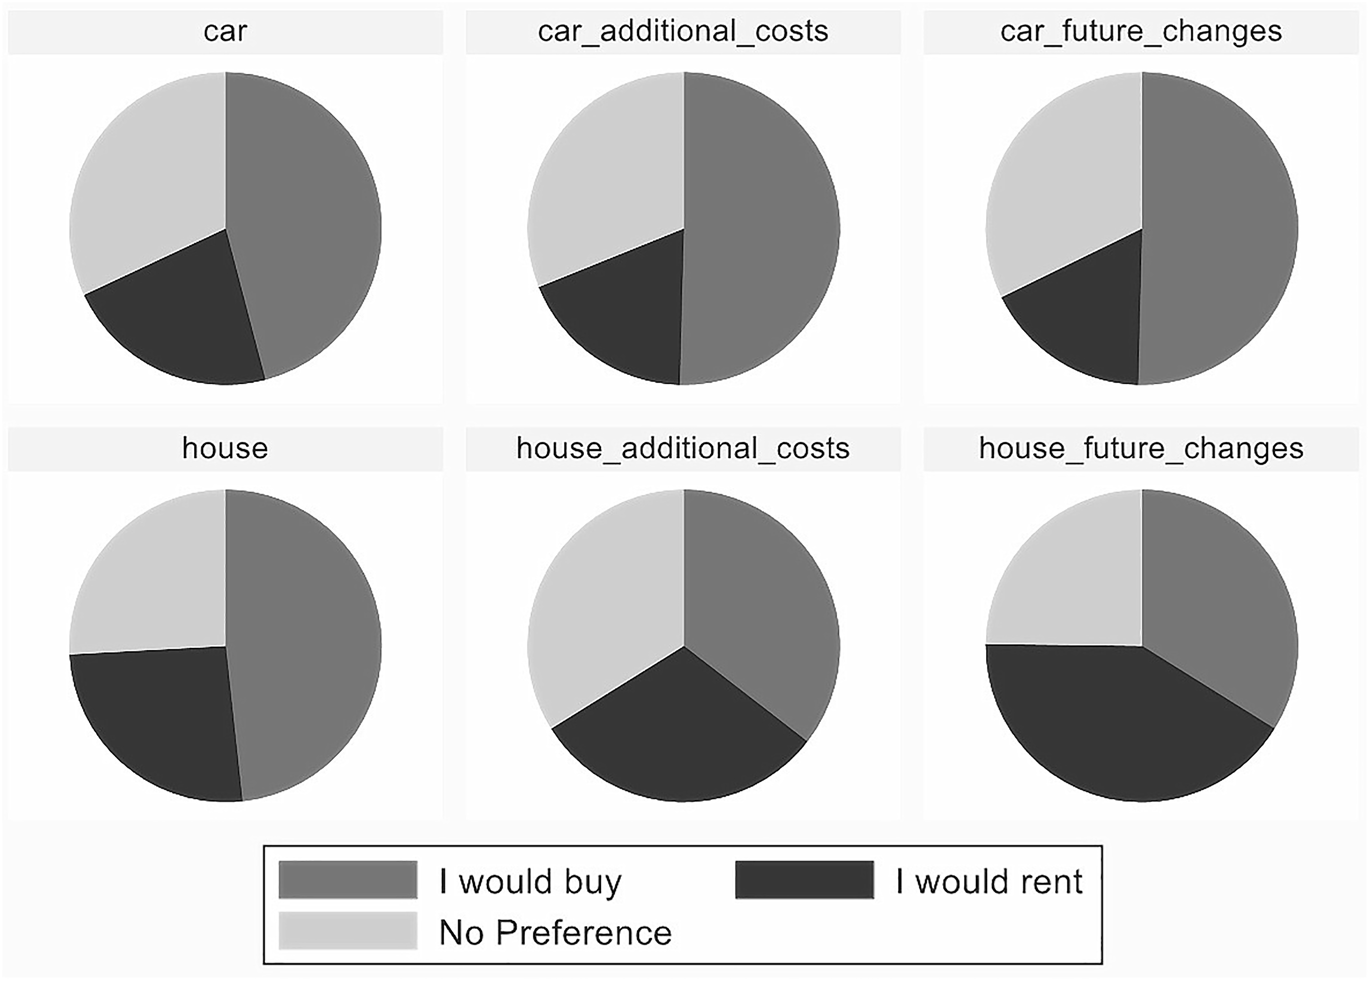
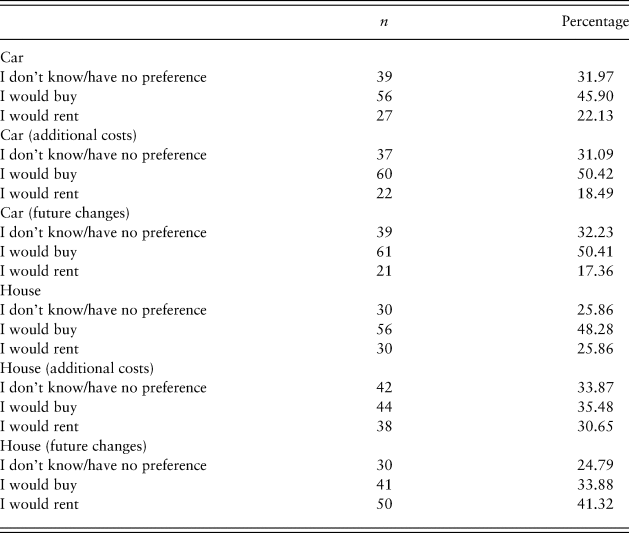
We start with aggregate results across all six scenarios. Although the transactions were economically equivalent, only 15.91% of the participants in the experiments (under all conditions) said that they did not have a preference. Out of the participants who did have a preference, 62.8% preferred buying the product with credit over renting it, and only 37.0% said that they preferred renting the product (z < 0.001 for a z-test comparing the probability of preferring to buy to the probability of preferring to rent; no preference is treated as a missing value). These findings support our hypothesis regarding a “rent stigma” (H1).
We present our results for each scenario in Figure 1.Footnote 7
Participants’ preferences by experimental condition, Experiment 1.

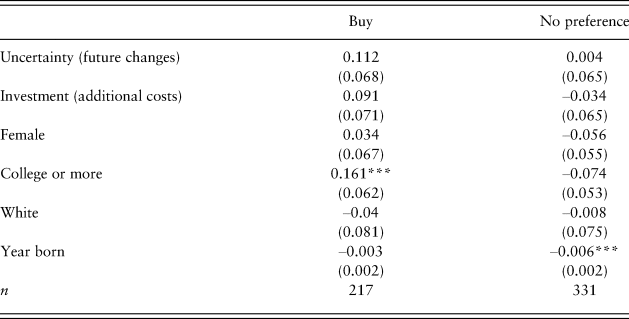
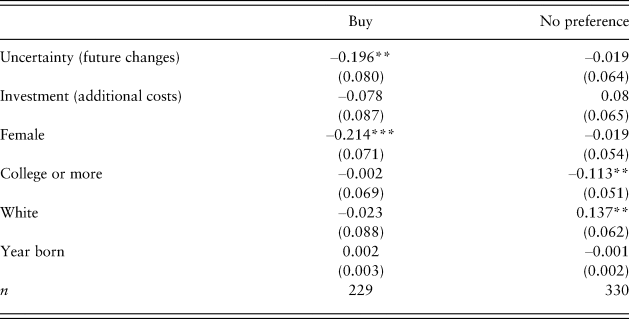
Visual inspection suggests that rent stigma is stronger for the car scenario than for the house scenario, but otherwise the results seem mixed. To test our additional hypotheses that uncertainty increases the incentive to rent and investment increases the incentive to buy, we use the following empirical strategy. We use logistic regression models predicting participants’ tendency to buy or to have no preference by experimental design. We wish to compare participants’ tendencies in the Uncertainty (“future changes”) and the Investment (“additional costs”) conditions to the baseline control conditions. The results of these models are presented in Tables 2 and 3. Table 2 reports the effects for the car scenarios. Table 3 reports the effects for the housing scenarios. Thus, the sample for Table 2 includes only participants who were exposed to one of the three car scenarios. The reference category for this model is the baseline car scenario. The sample for Table 3 includes only participants who were exposed to one of the three house scenarios. The reference category for this model is the baseline house scenario. In both Tables 2 and 3, the samples for the models predicting the tendency to buy exclude the participants who did not have a preference. Both Tables 2 and 3 report marginal effects. Marginal effects can be interpreted as the change in the probability of preferring to buy (compared to preferring to rent) given a one-unit change in the independent variables.
Car results, Experiment I. Logistic regression models predicting the tendency to buy or not to have a preference (car scenarios).
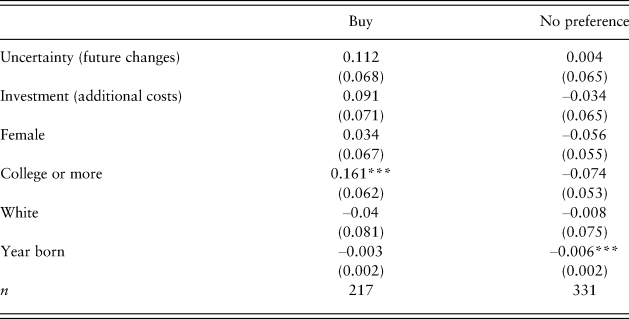
Marginal effects; standard errors in parentheses.
*p < 0.1, **p < 0.05, ***p < 0.01.
House results, Experiment 1. Logistic regression models predicting the tendency to buy or not to have a preference (house scenarios).
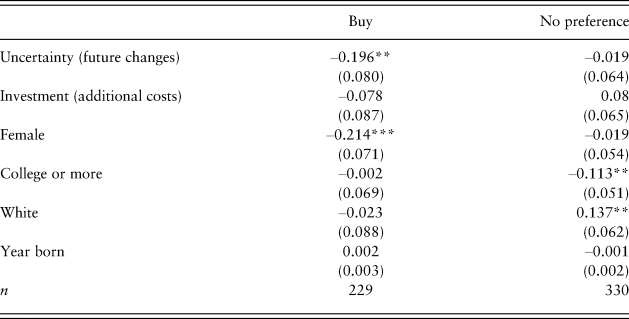
Marginal effects; standard errors in parentheses.
*p < 0.1, **p < 0.05, ***p < 0.01.
We find no support for our age, future change, and additional costs hypotheses in the car scenarios. We next report the results for the house scenarios.
We find that when future uncertainty was made salient, participants were less likely to buy a house (Table 3, model 1, p < 0.05), consistent with H3. Additional associated costs did not significantly affect the tendency to buy; thus, we find no support for H4.
Overall, we interpret our results as providing support for H1, the rent stigma hypothesis, but only weak support for H3 (uncertainty) and none for H2 (age) and H4 (costs). Note that although the transactions were framed as economically identical, we have a minor concern that participants might have not assumed that the economic consequences of the two transactions are economically equivalent – in cases of damages to the property, for example. If indeed participants believed that they would only be responsible for damages to the property if they owned it (but not if they rented it), it would lead them to prefer renting over owning. This would therefore imply that the “rent stigma” is greater than what we observe in Experiment 1.
Experiment 2
The second experiment was a field experiment. A group of 240 first- and second-year law students (1Ls and 2Ls) in an Israeli university were informed that the faculty of law was considering a new policy regarding laptop computers. They were further informed that their input would be valuable and would help the faculty understand the demand for the program and the financial feasibility of implementing it.
We used a between-subject research design with six experimental conditions. The students were asked to report their WTP in order to participate in a program that would enable each of them to receive a new laptop computer (with a market price of about 8000 NIS (about $2250)) at the beginning of their first or second year in law school. The programs presented to the students in the six experimental conditions were economically identical for each group of first-years and each group of second-years. Both groups of students would receive a new laptop computer with a warranty. The first-year students would pay four annual fees at the beginning of each academic year. The second-year students would pay three annual fees at the beginning of each academic year and a fourth fee in the third year. Upon graduation (after 4 years, in Israel), students would be able to return the computers and receive 30% of the total amount they had paid or to keep the computers as owners.
The students were also given the following example: “If the annual fee is 1000 NIS (a total of 4000 NIS), students will be able to return the computers upon graduation and receive a total amount of 1200 NIS. Students who join the program as 2Ls will be asked to pay an additional sum at the end of their fourth academic year. Thus, 2Ls who pay an annual fee of 1000 NIS, for example, will be asked to pay an additional sum of 1000 NIS at the end of their fourth year in law school. Upon graduation, students will be able to return the computers and receive a total amount of 1200 NIS.”
Although the programs were economically identical for each group of students, they were framed differently: in three experimental conditions, students became the legal owners of the laptop computers immediately upon receipt. In the other three conditions, students became the legal owners of the laptop computers only upon graduation (and only if they decided not to return the laptop computer). In order to make sure that the programs are identical, the descriptions of all of the programs made it clear that “a warranty will cover hardware problems that are not caused by the owner, such as defective keyboards, monitor problems, modem problems, or other issues with internal components.”
Two experimental conditions made the uncertainty regarding the economic value of the computer upon graduation salient (“We expect that in four years, new, better models will probably be available in the market”). Two experimental conditions made the additional costs involved salient (“Note: software is not included. Students will purchase the software needed independently”).
The six experimental conditions are summarized in Table 4 (see the Appendix for the six scenarios used in the experiment), along with our predictions.
Design and hypotheses for Experiment 2.
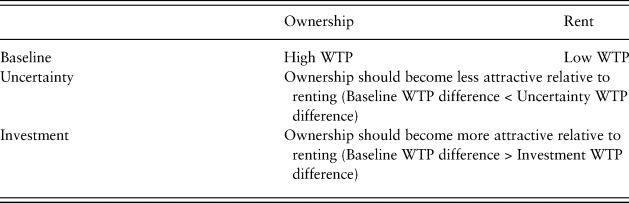
WTP = willingness to pay.
The responses of participants (their WTP) were compared across scenarios. We start with the two baseline cases, and then we compare the Uncertainty scenarios and Investment scenarios. In all three cases, the rent stigma hypothesis (H1) predicts that one's WTP for ownership will be higher than one's WTP for renting.
The Uncertainty scenarios test the hypothesis (H3) that making future changes (uncertainty) more salient decreases the WTP for participating in a program that involves ownership (compared to the control “ownership” condition) relative to renting. The logic is that people do not want to own an item when they are unsure of its future value. Thus, under H3, we predict that the baseline WTP difference between the owning and renting scenarios will decline when uncertainty is introduced.
The Investment scenarios test the hypothesis (H4) that investment decreases the WTP to participate in a program that involves rent (compared to the control “rent” condition). If people expect to invest in an item, they prefer to own it. Under H4, we predict that the baseline WTP difference between owning and renting scenarios will increase when investment is introduced.
Because all participants are law students and are therefore of similar ages, we do not test in this experiment for the effects of age.
Note that because the respondents in this field experiment were evaluating programs that might have real implications for them, their responses have high external validity.
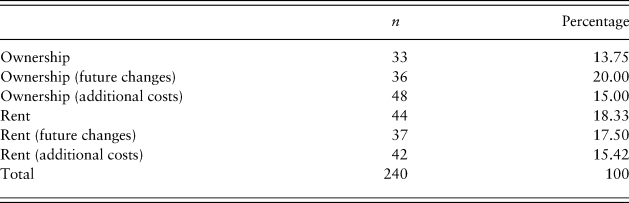
Altogether, 240 law students responded to the survey. A total of 52% of the participants were 1Ls (and 48% were 2Ls) and 61% were women. In the Appendix, we report the allocation of participants across the experimental conditions.
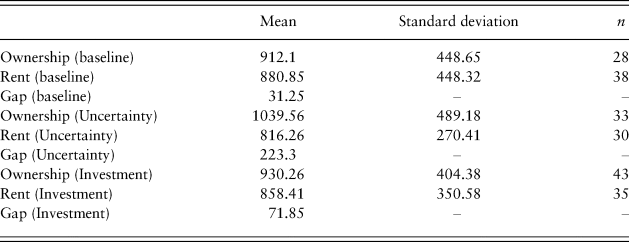
In Table 5, we present our results.
Participants’ willingness to pay by experimental condition (total sums, in USD), Experiment 2.
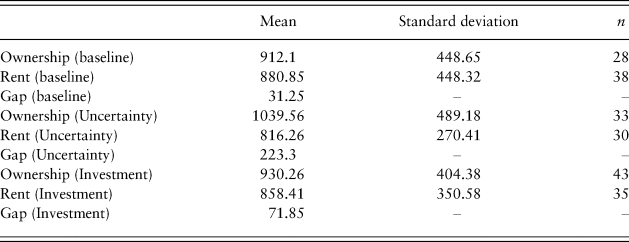
The amounts reported are total amounts (i.e., four times the annual amount) and are presented in Table 5 and in all future analyses in US dollars.
We find strong evidence for the rent stigma hypothesis (H1). Across all three scenarios, respondents pay more to own than to rent, even though the transaction under either option is economically identical. Aggregating across the scenarios, we find that participants who were exposed to one of the “ownership” schemas were willing to pay about $106 more compared to participants who were exposed to one of the “rent” schemas (p < 0.05). As the average WTP for the respondents in the study was $907.49, the magnitude of rent stigma seems economically important.
Our other results are mixed. We predicted that when Uncertainty is introduced, the baseline WTP difference would decline. We found that, contrary to our prediction, the WTP difference was higher in the Uncertainty scenarios ($223) than in the baseline scenarios ($32). To test whether these differences are statistically significant, we ran two separate regression models estimating the effects of “ownership” (compared to “rent”) on the WTP. The sample for the first model included the two baseline scenarios (“ownership” and “rent”). The sample for the second model included the Uncertainty scenarios (“ownership” and “rent”). We then compared the effects of “ownership” on the WTP in the two different models. The difference was not statistically significant (p = 0.1917, Chow test comparing the “ownership” coefficients on the two data sets).
We also predicted that when Investment is introduced, the baseline WTP difference would increase. As predicted, the WTP difference increased from $32 to $72. To explore the positive effects of Investment on the WTP difference, we run two separate regression models predicting participants’ WTP by whether they were exposed to the “ownership” or the “rent” schemas (for the two control conditions and for the two “additional costs” conditions). The analysis reveals that the “ownership” coefficients in the two models are not statistically different (p = 0.7704, Chow test).
Conclusion
In both studies, we find strong evidence for the rent stigma hypothesis. In the first experiment, participants tended to prefer buying over renting, even when the transactions are economically equivalent. In the second experiment, we find that participants are willing to pay more for otherwise economically equivalent “ownership” rights compared to “rent” rights. We find no evidence for the effects of age and weak evidence for the effects of making future changes and additional cost more salient. This may be due to the stickiness of the rent stigma; to insufficient power; to the failure of the scenarios to successfully make future changes and additional costs more salient; or to the failure of the instructions to cause subjects to think carefully about these issues. It is also consistent with the possibility that subjects were unable to think rationally or clearly about these issues, or were insufficiently motivated in the experimental design to do so.
Where does rent stigma come from? We suspect it is a combination of framing effects and cultural meanings. The cultural meaning is the association between ownership and wealth. This cultural meaning then can be manipulated through contractual means. Economic rentals can be framed as sales of ownership interests so as to increase WTP — though, we also note, people might re-characterize a sale as a rental in order to evade legal constraints. We do not see how rent stigma could be economically rational: it is frequently better to rent than to own, as we have explained.
From within a narrowly economic perspective, it is possible to argue that people are “buying” a kind of branding status: “If you pay us more, we'll call this transaction a sale rather than a lease.” But this strikes us as psychologically implausible, and at least missing an important possibility that confusion and fraud are taking place instead. Consider again the policy choice to push down underwriting standards so people could buy homes on credit rather than rent them – so as to create an “ownership society.” Policymakers may have believed (possibly correctly) that people would experience higher utility as “homeowners” rather than renters even though they were taking on greater risk. But is it plausible that people understood that by becoming “owners” they were taking on more risk rather than less? And is it not plausible that policymakers themselves were fooled? By confusing the formal status of ownership with the wealth and stability associated with ownership, policymakers may have believed that by encouraging renters to relabel themselves as owners, they were changing economic reality for the better rather than giving people a temporary shot of dopamine. Indeed, the key to the economic theory is that people both understood the relabeling (and thus were willing to pay for the ownership label by taking on more risk) and that the relabeling actually had sociological and psychological significance, even if everyone understood it as such. That seems very implausible.
Our rent stigma result, if it holds up to additional tests in further work, may have important implications for public policy. As described in the introduction, if people place a higher value on ownership than “possessorship,” even when the economic values of the two interests are the same, then both governments and firms may be tempted to manipulate people by structuring otherwise identical transactions as purchases rather than rentals. In doing so, they take advantage of a framing effect where the popular understanding of a concept may differ from specific legal and economic meanings.
Moreover, as we discussed in the introduction, there are numerous social costs associated with ownership, including homeownership. Government efforts to create an “ownership society” seem questionable, and if such efforts contribute to a norm of rent stigma, they could end up causing people to act against their own interests.
Acknowledgments
We thank Adam Chilton, Lee Fennell, Ariel Porat, Lior Strahilevitz, and two reviewers for their comments, and Michael Christ for research assistance.
Financial support
EAP acknowledges research support from the Russell Baker Scholar Fund.
Disclaimer
This project was approved by institutional review boards at the University of Tel Aviv and the University of Chicago.
Appendix
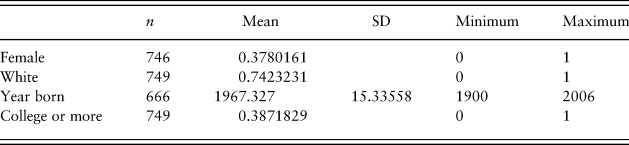
Demographics characteristics of participants, Experiment I.Footnote 8

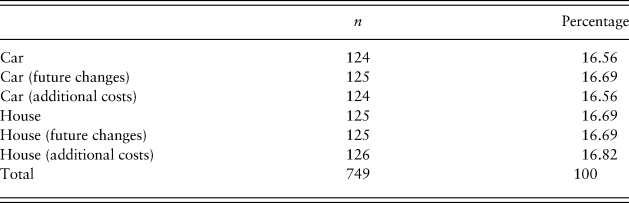
The allocation of participants across experimental conditions, Experiment I.
Participants’ preferences by experimental condition, Experiment 1.

The allocation of participants across experimental conditions, Experiment 2.

Materials
Experiment I
Car (baseline)
A car dealership sells a car. The car is new and in good condition. The list price is $20,000. You may buy the car on credit by paying $500 per month for 60 months (that is, 5 years), plus an administrative fee of $2000 due on the final day. At the end of the 60-month period, you have the option to return the car to the dealership, in which case the administrative fee is waived. Thus, the total cash outlay would be $32,000 if you keep the car, and $30,000 if you return it. The dealership will also rent the car. You may rent the car by paying $500 per month for a 60-month (5-year) term. At the end of 60 months, you have an option to pay an administrative fee of $2000, in which case you can keep the car indefinitely. Thus, the total cash outlay would be $32,000 if you keep the car, and $30,000 if you return it. You need a new car. You are temporarily low on cash so you will either need to buy on credit or rent. Given your current financial circumstances, would you buy the car on credit or rent the car?
Car (Uncertainty)
A car dealership sells a car. The car is new and in good condition. The list price is $20,000. You may buy the car on credit by paying $500 per month for 60 months (that is, 5 years), plus an administrative fee of $2000 due on the final day. At the end of the 60-month period, you have the option to return the car to the dealership, in which case the administrative fee is waived. Thus, the total cash outlay would be $32,000 if you keep the car, and $30,000 if you return it. The dealership will also rent the car. You may rent the car by paying $500 per month for a 60-month (5-year) term. At the end of 60 months, you have an option to pay $2000, in which case you can keep the car indefinitely. Thus, the total cash outlay would be $32,000 if you keep the car, and $30,000 if you return it. You need a new car. Experts tell us that there is a 50% chance that next year driverless cars will be available, which means that the value of normal cars will decline to almost 0. You are temporarily low on cash so you will either need to buy on credit or rent. Given your current financial circumstances, would you buy the car on credit or rent the car?
Car (Investment)
A car dealership sells a car. The car is new and in good condition. The list price is $20,000. You may buy the car on credit by paying $500 per month for 60 months (that is, 5 years), plus an administrative fee of $2000 due on the final day. At the end of the 60-month period, you have the option to return the car to the dealership, in which case the administrative fee is waived. Thus, the total cash outlay would be $32,000 if you keep the car, and $30,000 if you return it. The dealership will also rent the car. You may rent the car by paying $500 per month for a 60-month (5-year) term. At the end of 60 months, you have an option to pay $2000, in which case you can keep the car indefinitely. Thus, the total cash outlay would be $32,000 if you keep the car, and $30,000 if you return it. You need a new car. You also plan to custom-paint the car to reflect your personal style. You are temporarily low on cash so you will either need to buy on credit or rent. Given your current financial circumstances, would you buy the car on credit or rent the car?
House (baseline)
A company sells a house. The house is well constructed. The list price is $400,000. You may buy the house on credit (no down payment) by paying $10,000 per month for 60 months (that is, 5 years), plus an administrative fee of $20,000 due on the final day. At the end of the 60-month period, you have the option to return the house to the seller, in which case the administrative fee is waived. Thus, the total cash outlay would be $620,000 if you keep the house, and $600,000 if you return it. The company will also rent the house. You may rent the house by paying $10,000 per month for a 60-month (5-year) term. At the end of 60 months, you have an option to pay $20,000, in which case you can keep the house indefinitely. Thus, the total cash outlay would be $620,000 if you keep the house, and $600,000 if you return it. You are looking for a new house. You are temporarily low on cash so you will either need to buy on credit or rent. Given your current financial circumstances, would you buy the house on credit or rent the house? (Please ignore tax-related issues.)
House (Uncertainty)
A company sells a house. The house is well constructed. The list price is $400,000. You may buy the house on credit (no down payment) by paying $10,000 per month for 60 months (that is, 5 years), plus an administrative fee of $20,000 due on the final day. At the end of the 60-month period, you have the option to return the house to the dealership, in which case the administrative fee is waived. Thus, the total cash outlay would be $620,000 if you keep the house, and $600,000 if you return it. The company will also rent the house. You may rent the house by paying $10,000 per month for a 60-month (5-year) term. At the end of 60 months, you have an option to pay $20,000, in which case you can keep the house indefinitely. Thus, the total cash outlay would be $620,000 if you keep the house, and $600,000 if you return it. You are looking for a new house. You know, however, that in a few years your kids will leave home and your needs will change. You are temporarily low on cash so you will either need to buy on credit or rent. Given your current financial circumstances, would you buy the house on credit or rent the house? (Please ignore tax-related issues.)
House (Investment)
A company sells a house. The house is well constructed. The list price is $400,000. You may buy the house on credit (no down payment) by paying $10,000 per month for 60 months (that is, 5 years), plus an administrative fee of $20,000 due on the final day. At the end of the 60-month period, you have the option to return the house to the dealership, in which case the administrative fee is waived. Thus, the total cash outlay would be $620,000 if you keep the house, and $600,000 if you return it. The company will also rent the house. You may rent the house by paying $10,000 per month for a 60-month (5-year) term. At the end of 60 months, you have an option to pay $20,000, in which case you can keep the house indefinitely. Thus, the total cash outlay would be $620,000 if you keep the house, and $600,000 if you return it. You are looking for a new house. You know that when you move to the new house, your kids will have to move to a new school. You are temporarily low on cash so you will either need to buy on credit or rent. Given your current financial circumstances, would you buy the house on credit or rent the house? (Please ignore tax-related issues.)
Experiment II
Ownership (baseline)
The TAU Faculty of Law is considering a new policy regarding laptop computers.
Students who wish to participate (first- and second-years) will receive from the law school a new laptop computer at the beginning of the academic year (market price: ~8000 NIS). The students will become the owners of the computers. A warranty will cover hardware problems that are not caused by the owner, such as defective keyboards, monitor problems, modem problems, or other issues with internal components.
For four consecutive years, students will pay the faculty an annual fee that will be paid at the beginning of each academic year. Upon graduation, students will be able to return the computers and receive 30% of the total amount they have paid.
Thus, for example, if the annual fee is 1000 NIS (a total of 4000 NIS), students will be able to return the computers they own and to receive a total amount of 1200 NIS.
Students who join the program as second-years will be asked to pay an additional sum at the end of their fourth academic year. Thus, second years who pay an annual fee of 1000 NIS, for example, will be asked to put an additional sum of 1000 NIS at the end of their fourth year. Upon graduation, students will be able to return the computers they own and to receive a total amount of 1200 NIS.
Please note, we wish to understand the demand for the program and the financial feasibility of applying it. Please provide accurate answers to the questions below.
Ownership (Investment)
The TAU Faculty of Law is considering a new policy regarding laptop computers.
Students who wish to participate (first- and second-years) will receive from the law school a new laptop computer at the beginning of the academic year (market price: ~8000 NIS). The students will become the owners of the computers. A warranty will cover hardware problems that are not caused by the owner, such as defective keyboards, monitor problems, modem problems, or other issues with internal components.
For four consecutive years, students will pay the faculty an annual fee that will be paid at the beginning of each academic year. Upon graduation, students will be able to return the computers and receive 30% of the total amount they have paid.
Note: software is not included. Students will purchase the software needed independently.
Thus, for example, if the annual fee is 1000 NIS (a total of 4000 NIS), students will be able to return the computers they own and to receive a total amount of 1200 NIS.
Students who join the program as second-years will be asked to pay an additional sum at the end of their fourth academic year. Thus, second-years who pay an annual fee of 1000 NIS, for example, will be asked to pay an additional sum of 1000 NIS at the end of their fourth year in law school. Upon graduation, students will be able to return the computers they own and receive a total amount of 1200 NIS.
Please note, we wish to understand the demand for the program and the financial feasibility of applying it. Please provide accurate answers to the questions below.
Ownership (Uncertainty)
The TAU Faculty of Law is considering a new policy regarding laptop computers.
Students who wish to participate (first- and second-years) will receive from the law school a new laptop computer at the beginning of the academic year (market price: ~8000 NIS). The students will become the owners of the computers. A warranty will cover hardware problems that are not caused by the owner, such as defective keyboards, monitor problems, modem problems, or other issues with internal components.
For four consecutive years, students will pay the faculty an annual fee that will be paid at the beginning of each academic year. Upon graduation, students will be able to return the computers and receive 30% of the total amount they have paid.
We expect that in 4 years, new and improved models will probably be available in the market.
Thus, for example, if the annual fee is 1000 NIS (a total of 4000 NIS), students will be able to return the computers they own and to receive a total amount of 1200 NIS.
Students who join the program as second-years will be asked to pay an additional sum at the end of their fourth academic year. Thus, second-years who pay an annual fee of 1000 NIS, for example, will be asked to put an additional sum of 1000 NIS at the end of their fourth year in law school. Upon graduation, students will be able to return the computers they own and receive a total amount of 1200 NIS.
Please note, we wish to understand the demand for the program and the financial feasibility of applying it. Please provide accurate answers to the questions below.
Rent (baseline)
The TAU Faculty of Law is considering a new policy regarding laptop computers.
Students who wish to participate (first- and second-years) will rent from the law school a new laptop computer at the beginning of the academic year (market price: ~8000 NIS). A warranty will cover hardware problems that are not caused by the renter, such as defective keyboards, monitor problems, modem problems, or other issues with internal components.
For four consecutive years, students will pay the faculty a rental fee that will be paid at the beginning of each academic year. Upon graduation, students will return the computers and receive 30% of the total amount they have paid. Students who wish to buy the computers will not receive the 30% and will get to keep the computers (and to own them).
Thus, for example, if the annual fee is 1000 NIS (a total of 4000 NIS), students will return the computers they rent and receive a total amount of 1200 NIS (unless they wish to own them).
Students who join the program as second-years will be asked to pay an additional sum at the end of their fourth academic year. Thus, second-years who pay an annual fee of 1000 NIS, for example, will be asked to pay an additional sum of 1000 NIS at the end of their fourth year in law school. Upon graduation, students will return the computers they rent and receive a total amount of 1200 NIS (unless they wish to own them).
Please note, we wish to understand the demand for the program and the financial feasibility of applying it. Please provide accurate answers to the questions below.
Rent (Investment)
The TAU Faculty of Law is considering a new policy regarding laptop computers. Students who wish to participate (first- and second-years) will rent from the law school a new laptop computer at the beginning of the academic year (market price: ~8000 NIS). A warranty will cover hardware problems that are not caused by the renter, such as defective keyboards, monitor problems, modem problems, or other issues with internal components.
For four consecutive years, students will pay the faculty a rental fee that will be paid at the beginning of each academic year. Upon graduation, students will return the computers and receive 30% of the total amount they have paid. Students who wish to buy the computers will not receive the 30% and will get to keep the computers (and to own them).
Note: software is not included. Students will purchase the software needed independently.
Thus, for example, if the annual fee is 1000 NIS (a total of 4000 NIS), students will return the computers they rent and receive a total amount of 1200 NIS (unless they wish to own them).
Students who join the program as second-years will be asked to pay an additional sum at the end of their fourth academic year. Thus, second-years who pay an annual fee of 1000 NIS, for example, will be asked to pay an additional sum of 1000 NIS at the end of their fourth year in law school. Upon graduation, students will return the computers they rent and receive a total amount of 1200 NIS (unless they wish to own them).
Please note, we wish to understand the demand for the program and the financial feasibility of applying it. Please provide accurate answers to the questions below.
Rent (Uncertainty)
The TAU Faculty of Law is considering a new policy regarding laptop computers.
Students who wish to participate (first- and second-years) will rent from the law school a new laptop computer at the beginning of the academic year (market price: ~8000 NIS). A warranty will cover hardware problems that are not caused by the renter, such as defective keyboards, monitor problems, modem problems, or other issues with internal components.
For four consecutive years, students will pay the faculty a rental fee that will be paid at the beginning of each academic year. Upon graduation, students will return the computers and receive 30% of the total amount they have paid. Students who wish to buy the computers will not receive the 30% and will get to keep the computers (and to own them).
We expect that in 4 years, new and improved models will probably be available in the market.
Thus, for example, if the annual fee is 1000 NIS (a total of 4000 NIS), students will return the computers they rent and receive a total amount of 1200 NIS (unless they wish to own them).
Students who join the program as second-years will be asked to pay an additional sum at the end of their fourth academic year. Thus, second-years who pay an annual fee of 1000 NIS, for example, will be asked to pay an additional sum of 1000 NIS at the end of their fourth year in law school. Upon graduation, students will return the computers they rent and receive a total amount of 1200 NIS (unless they wish to own them).
Please note, we wish to understand the demand for the program and the financial feasibility of applying it.