Introduction
Low-frequency narrow-band antennas are widely used in communication and navigation systems for both manned and unmanned aircrafts, such as very high frequency (VHF) omnidirectional range (VOR), operating from 108 to 117.95 MHz, distance measuring equipment (DME), operating from 962 to 1213 MHz, and so on [Reference Paonessa, Virone, Capello, Addamo, Peverini, Tascone, Bolli, Pupillo, Monari, Perini, Rusticelli, Lingua, Piras, Aicardi and Maschio1, Reference Virone, Lingua, Piras, Cina, Perini, Monari, Paonessa, Peverini, Addamo and Tascone2]. For all these systems, the high precision measurement of antenna is very important.
As is well-known, the measurement of antenna radiation pattern at low frequency cannot be accurately performed in anechoic chambers because of their small size in terms of wavelength and poor absorption performance of their walls, and the multipath signal from the side wall and floor may influence measurement accuracy [Reference Aubin and Winebrand3]. To remove the multipath signal of environment, many approaches are utilized [Reference Yinusa and Eibert4–Reference Foged, Scialacqua, Saccardi, Mioc, Iversen, Shmidov, Braun, Araque Quijano and Vecchi9]. The propagation of multipath signal has normally time lag compared with the antenna radiation signal, the separation of multipath signal with a time gating is an effective method [Reference Mauermayer and Eibert10]. Especially, the vector network analysis (VNA) is widely used, which can transmit stepped-frequency continuous waves and use the inverse fast Fourier transform (IFFT) to change the signal into time-domain response so as to remove clutter with the time gating [Reference Le Fur, Cano-Facila and Saccardi11]. However, when the band of a low-frequency antenna is narrow, and its equivalent time-domain resolution is relatively wide, thus being difficult to obtain the exact time gating to separate the main signal and multipath signal. Ref. [Reference Gregson, Newell and Hindman12] presented a technique named mathematical absorber reflection suppression (MARS) when the antenna measurement is performed in a non-ideal anechoic chamber. Ref. [Reference Kurokawa, Hirose and Ameya13] developed an antenna measurement using an optical fiber link technique to suppress the reflection waves from the coaxial cable. Ref. [Reference Li, Liu and Leou14] developed a method by utilizing the antenna's return lose to compensate for expanding the frequency band of the received signal, but the operation is a bit complex.
This paper proposes a signal processing technique to improve the measurement accuracy of a low-frequency narrow-band antenna. The method is to perform spectral extrapolation at the two ends of the original band using the Burg algorithm, namely to produce a wideband signal and thereby enhances the time-domain resolution. The time gating with the improved time-domain resolution can effectively eliminate multipath signal. ‘Principle of method’ section presents the principle and mathematical formulae of the method. ‘Results’ section gives the simulation results and the data of a low-frequency narrow-band antenna with a multipath signal measured in an anechoic chamber. The results show that the method is effective at improving the measurement accuracy of a low-frequency narrow-band antenna.
Principle of method
The principle of spectral extrapolation
In the antenna measurement with VNA, the relationship between equivalent time-domain resolution dτ and signal bandwidth BW is
 $$d\tau = \displaystyle{1 \over {BW}}.$$
The corresponding range resolution Δd is
 $$\Delta d = c \times d\tau = c/BW,$$
where c is the velocity of light.
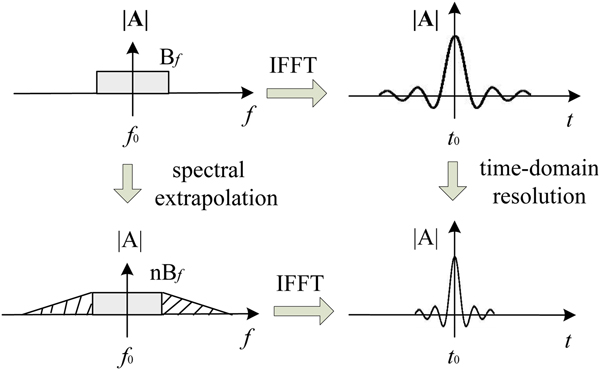
As shown in Fig. 1, if the bandwidth is narrow, then the time-domain resolution and the corresponding range resolution are low, and thus it is difficult to distinguish between the main signal and multipath signals. The frequency domain data are extrapolated on both sides of the band according to the rule of statistics, and then a wideband signal can be obtained, so the time-domain resolution is improved. Based on the improved time-domain resolution, the multipath signal can be accurately separated by a time gating.
The principle of spectral extrapolation.

The algorithm of spectral extrapolation
The spectral extrapolation method is based on the autoregressive model (AR model) in the modern spectral estimation theory. The model parameters are calculated by the Burg algorithm [Reference Ortigueira15]. The core idea is: the period known correlation sequence is extrapolated to obtain the unknown value of the correlation sequence. The correlation function of sequence after extrapolation has the maximum entropy, which is to obtain maximum information of unknown spectrum. The AR model is a kind of linear prediction. For example, if the N points data are known, the data before or after N points can be predicted by the model, which is similar to the interpolation. The AR model is recursive by N points, and the interpolation is derived from two points (or a few points), both of them are to increase effective data. Since the predicted data have the same autocorrelation function as the known data, so the predicted data contain information of the known data. For a linear time-invariant system, its transfer function satisfies the AR model. While the indoor antenna testing can be viewed as a linearly time-invariant process, it is possible to predict before and after data by solving AR model parameters. The detailed formulae are as follows.
According to the definition of the AR model, the current data x(n) can be represented by a linear combination of previous data x(n − 1), x(n − 2), …, x(n–m):
 $$x(n) = - \sum\limits_{i = 1}^m {a_m\,(i)\,x\,(n - i)} + e\,(n),$$
where  $\hat x(n) = - \sum\nolimits_{i = 1}^m {a_m(i)x(n - i)} $ is the prediction data of x(n), e (n) is the prediction error, and a m(i)is the coefficient of linear combination.
For the forward prediction, the prediction data  $\hat x^f(n)$, the forward prediction error e f(n), and the forward prediction error power ρf are as follows:
 $$\hat x^f\,(n) = - \sum\limits_{i = 1}^m {a_m(i)x(n - i)}, $$
 $$e^f\,(n) = x(n) - \hat x^f\,(n),$$
 $$\rho _{}^f = \displaystyle{1 \over {N - m}}\sum\limits_{n = m}^{N - 1} {{\vert {e_{}^f (n)} \vert } ^2}. $$
For the backward prediction, the prediction data  $\hat x^b(n - m)$, the backward prediction error e b(n), and the backward prediction error power ρb are as follows:
 $$\hat x^b(n - m) = - \sum\limits_{i = 1}^m {a_m^ {^\ast} (i)x(n - m + i)}, $$
 $$e^b(n) = x(n - m) - \hat x^b(n - m),$$
 $$\rho _{}^b = \displaystyle{1 \over {N - m}}\sum\limits_{n = m}^{N - 1} {{\vert {e_{}^b (n)} \vert } ^2}. $$
The coefficients a m(i) are calculated using the following recursion formulae:
 $$a_m(i) = a_{m - 1}(i) + k_ma_{m - 1}^ {^\ast} (m - i),$$
 $$a_m(m) = k_m,$$
where k m is a recursion coefficient, and i = 1, 2, …, m − 1.
According to the recursion formulae, the relationships of ef(n) and eb(n) are given by the following formulae:
 $$e_m^f (n) = e_{m - 1}^f (n) + k_me_{m - 1}^b (n - 1),$$
 $$e_m^b (n) = e_{m - 1}^b (n - 1) + k_m^ {^\ast} e_{m - 1}^f (n),$$
 $$e_0^f (n) = e_0^b (n) = x(n).$$
Let the sum of forward and backward prediction error powers is
 $$\rho ^{\,fb} = \displaystyle{1 \over 2}\lsqb {\rho^f + \rho^b} \rsqb .$$
ρfb is only the function of k m, and let ∂ ρfb/∂ k m = 0, we have
 $$k_m = \displaystyle{{ - 2\sum\nolimits_{n = m}^{N - 1} {e_{m - 1}^f (n)e_{m - 1}^{b {^\ast}} (n - 1)}} \over {\sum\nolimits_{n = m}^{N - 1} {{\vert {e_{m - 1}^f (n)} \vert } ^2} + \sum\nolimits_{n = s}^{N - 1} {{\vert {e_{m - 1}^b (n - 1)} \vert } ^2}}}, $$
where m = 1, 2, …, p, and p is the model order.
The steps of obtaining extrapolated data using original data are as follows:
Step 1: Given the initial condition
 $e_0^f (n) = e_0^b (n) = x(n)$, then k 1 is estimated using (16);
Step 2: the model coefficient a 1(1) = k 1 is obtained for m = 1;
Step 3:
$e_1^f (n)$ and $e_1^b (n)$ are obtained by k 1 and (12)–(14), then k 2 is estimated using (16);Step 4: The model coefficients a 2(1) and a 2(2) for m = 2 are calculated using (10) and (11);
Step 5: Repeat steps 2–4 until m = p, all of model coefficients are obtained. Then the forward and backward prediction data can be calculated by the coefficients.


Results
The simulation of method
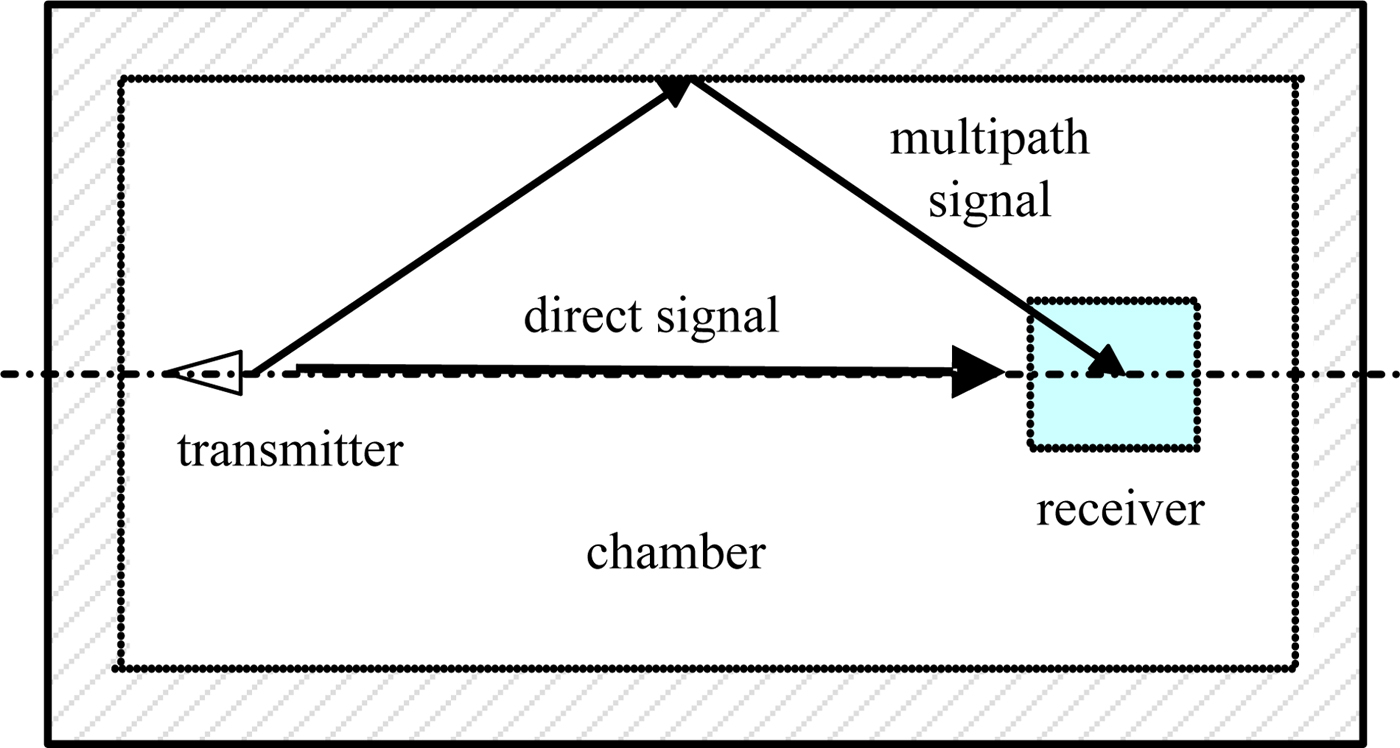
The simulation data are generated in a non-ideal environment as shown in Fig. 2. The propagation distance of a direct signal is 17 m from the transmitter to the receiver; the propagation distance of a multipath signal caused by the wall is 20 m. The distance between two signals is 3 m. The amplitude of the multipath signal is half of the direct signal. The received data are combined by the amplitude and phase related to the propagation distance of two signals. In order to simulate the real measurement, a random signal is added to the received data.
The simulated signals in a non-ideal environment.

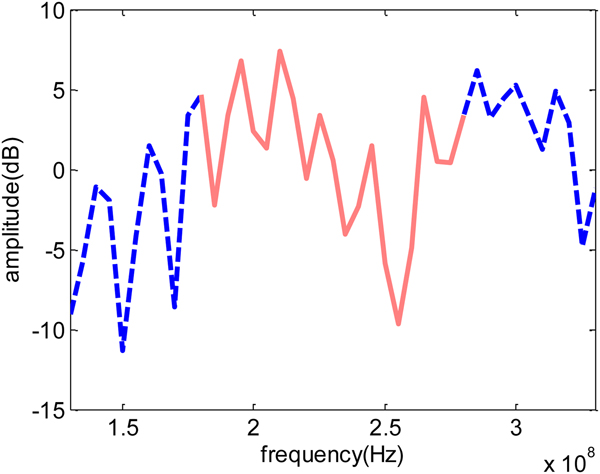
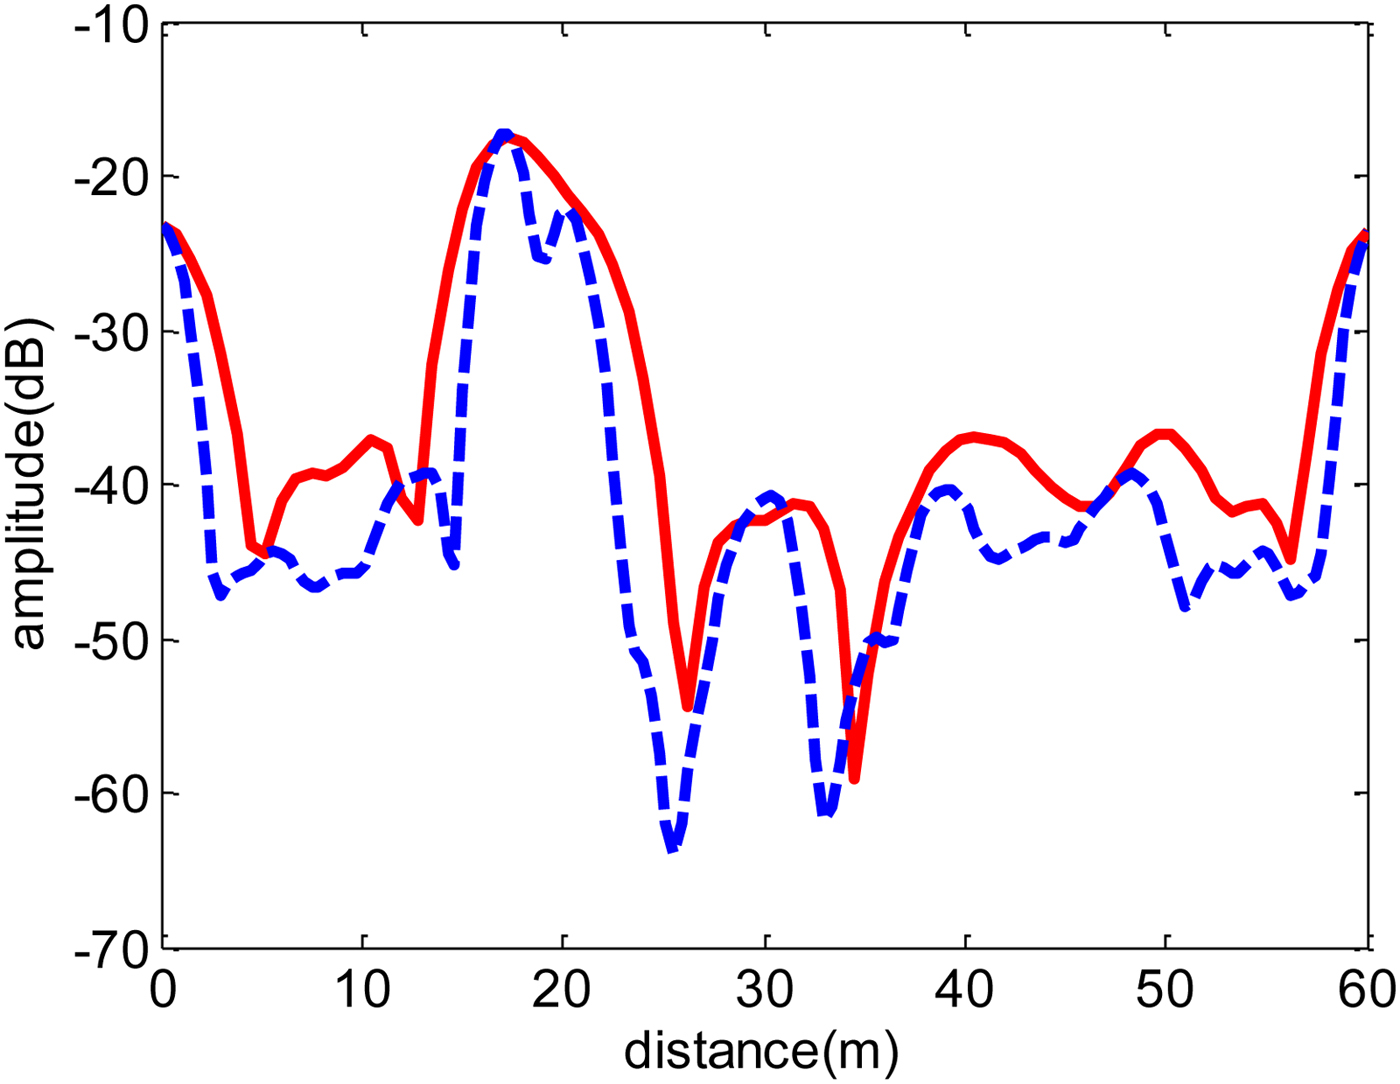
In order to verify the effectiveness of the spectral extrapolation method, the received signal from 180 to 280 MHz is simulated as shown by the solid line in Fig. 3. The interval of frequency is 1 MHz. The received signal fluctuates due to the interference signals. The frequency domain signal is transformed to the time-domain response, which is shown by the solid line in Fig. 4. The bandwidth of 100 MHz corresponds to a range resolution of 3 m, which is almost equal to the distance between two signals, so it is hard to remove the multipath signal with a time gating.
The frequency domain signal before and after extrapolation.

The time-domain response before and after extrapolation.

Next, the frequency range of the received signal is extrapolated to 130–330 MHz using the maximum entropy spectral estimation algorithm, as shown by the dotted line in Fig. 3. The changed trend after extrapolation is consistent with the original frequency domain signal. The IFFT is used in the new frequency domain signal, and the new time-domain curve is obtained as shown by the dotted line in Fig. 4. The time-domain resolution is enhanced doubly, and the corresponding range resolution also reaches 1.5 m. Then, we can see the direct signal and multipath signal clearly, so it is possible to use a time gating to remove the multipath signal.
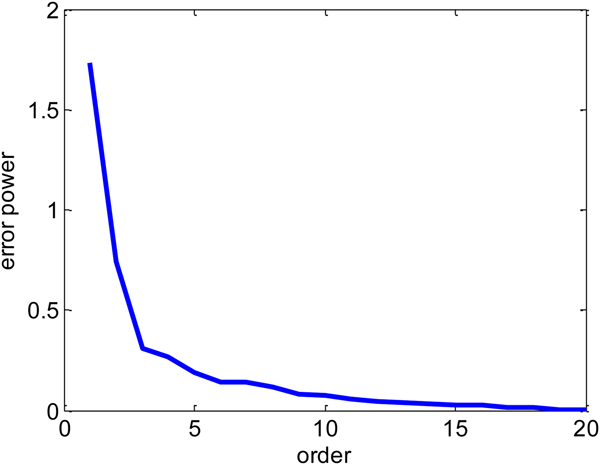
In general, the model order p is not known in advance, and a large value needs to be selected at first and determine during recursion. As shown in Fig. 5, the error power decreases as the order increases. The appropriate order is selected when the error power is essentially constant. As can be seen from the figure, when the order is greater than six, the variation of error power is basically small, so the model order is six.
The variation of error power with the model order.

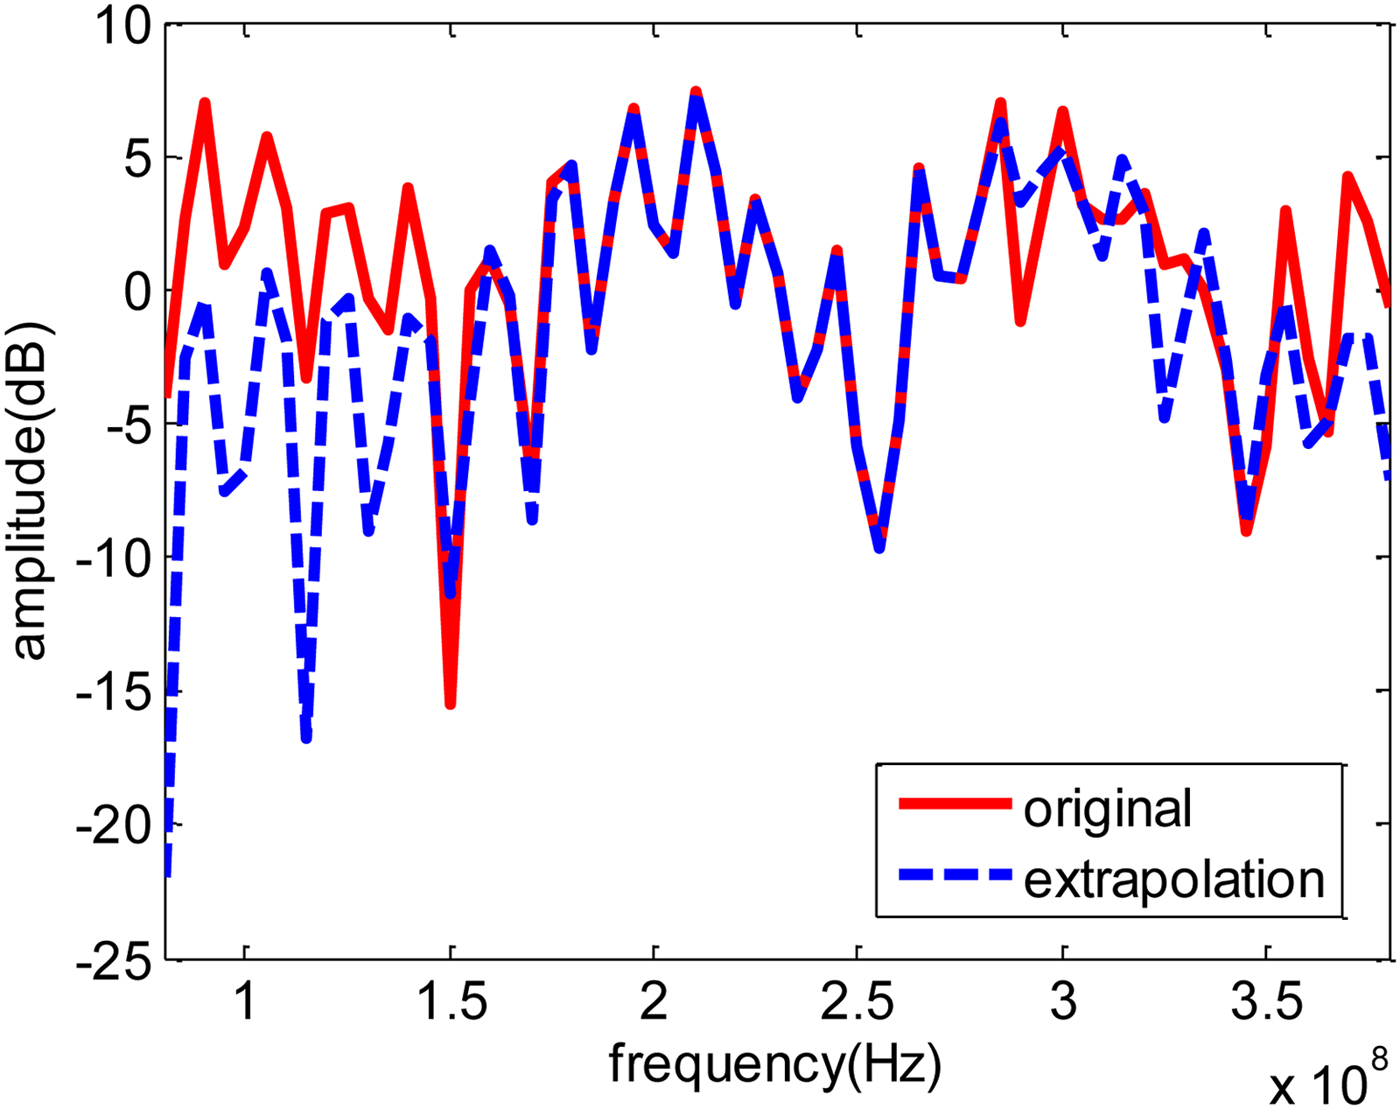
In order to investigate the effective range of extrapolated data, the received signal at 80–380 MHz is simulated, and then the signal from 180 to 280 MHz is intercepted to be extrapolated. The results of the extrapolated signal and original signal are shown in Fig. 6. It can be seen from the figure that most of the extrapolated data from 130 to 350 MHz have the same trend as the original data.
The effective range of extrapolated data.

The experimental results
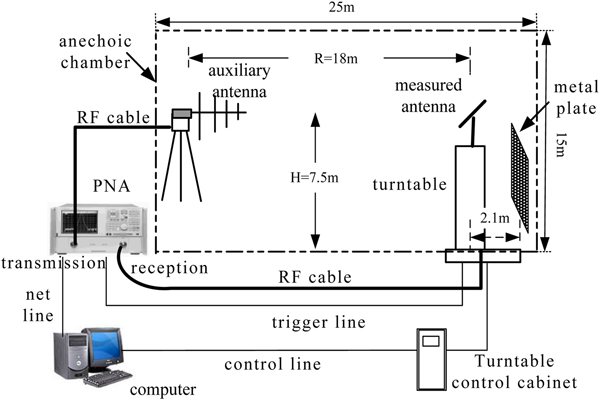
The low-frequency narrow-band antenna measurement system in an anechoic chamber is shown in Fig. 7. A vector network analyzer is used to transmit and receive stepped-frequency signals. The dipole antenna is placed on a turntable to measure the antenna directional pattern. A log-periodic antenna is used as the receiving antenna. Both the transmitted signal and the received signal are coherent signals and therefore the relative phase can be obtained.
Low-frequency antenna measurement with interference.

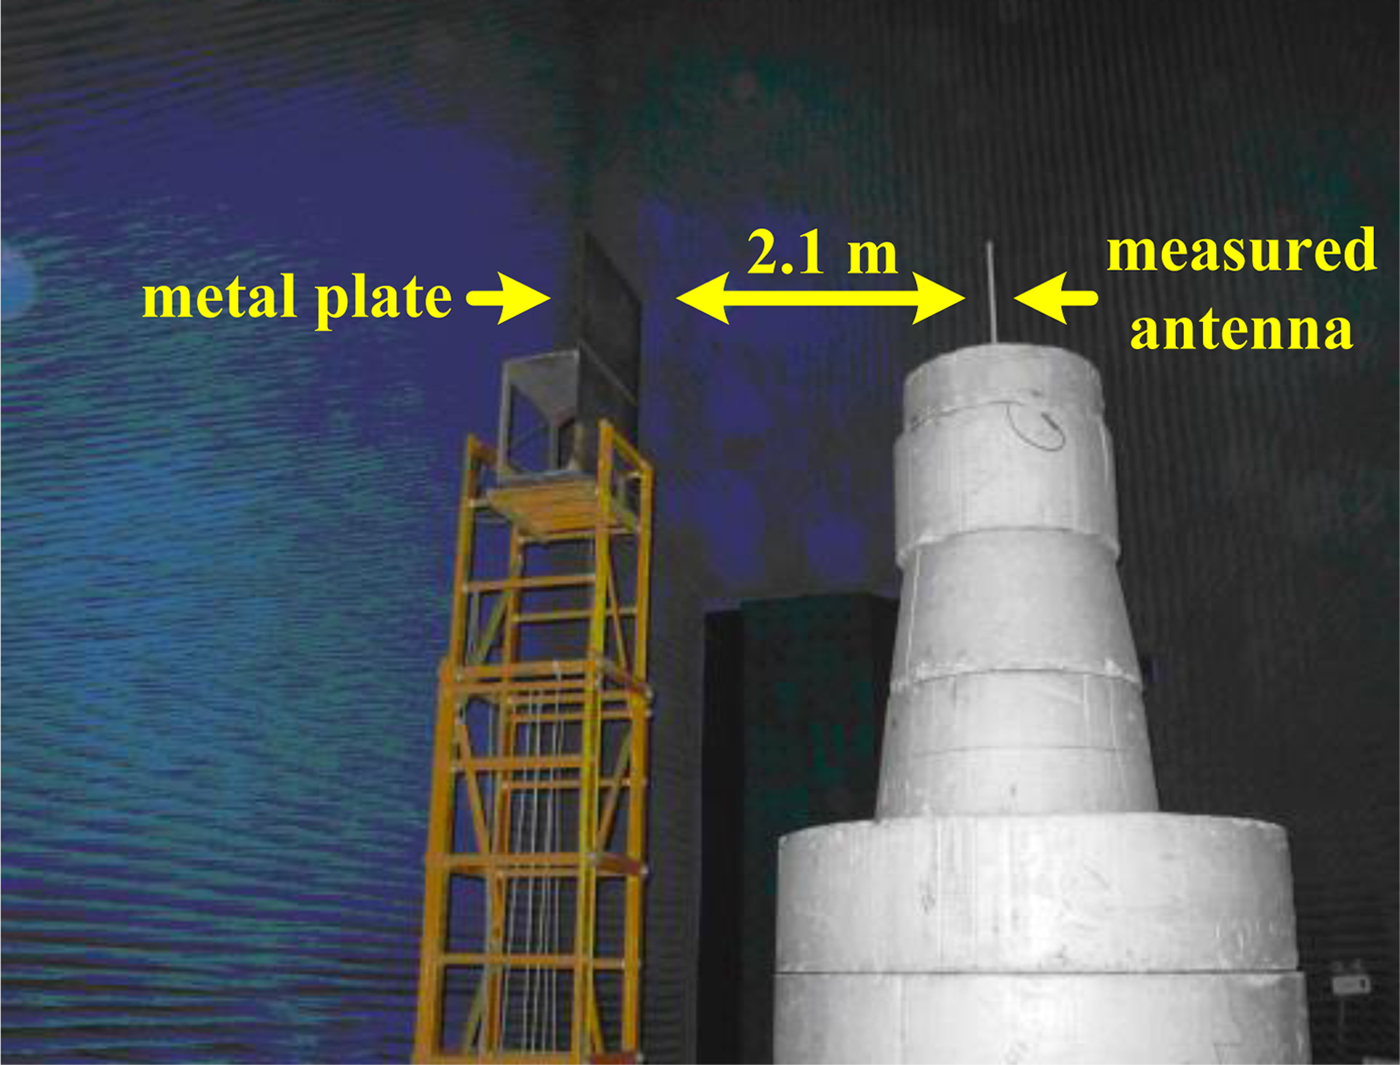
The experimental photograph is shown in Fig. 8. The walls and ground of the anechoic chamber are covered by lots of absorbing material, whose reflectivity is approximately −30 dB at 500 MHz. A dipole antenna with the center frequency 350 MHz is measured. The frequency range of measurement is 300–400 MHz; the frequency interval is 1 MHz. The range of rotational angle is 360°; the angle interval is 1°. A metal plate is placed at the rear of the measured antenna, which is to simulate an interference signal. The distance between the metal plate and the dipole antenna is 2.1 m.
Experimental photograph.

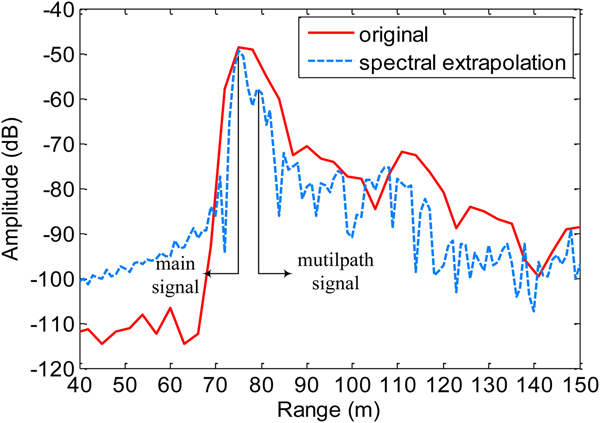
In order to verify the effectiveness of the method, an IFFT is applied to the original bandwidth, and the time-domain response is shown by the solid line in Fig. 9. As can be seen, the time-domain resolution is low and it is difficult to separate the multipath signal of the metal plate and the dipole antenna signal. In order to distinguish the multipath signal, the bandwidth is extended from 200 to 500 MHz using spectral extrapolation. The corresponding range-resolution is 1 m. The time-domain response after extrapolation is shown by the dashed line in Fig. 9. We can clearly see the dipole antenna signal and the multipath signal from the metal plate. The distance between them is about 4 m (two ways). Then a time gating is used to select the measured antenna signal accurately, which removes the multipath signal from the received signal.
The time-domain response of measurement and extrapolation.

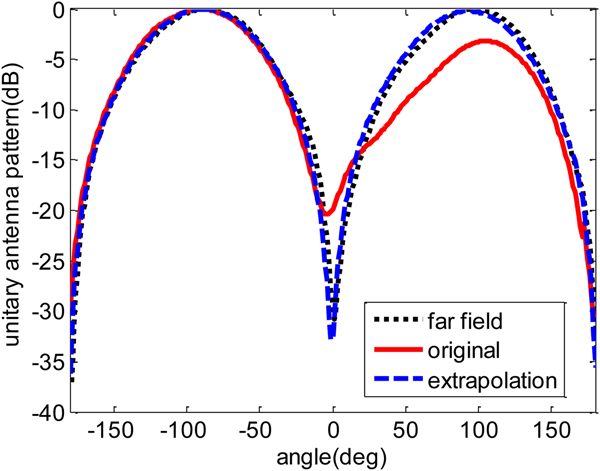
Figure 10 shows the three unitary antenna patterns at 350 MHz. When the metal plate is near the antenna, the antenna pattern is distorted. The main-side lobe is 3–5 dB lower than the measured far-field pattern, and the bottom of pattern is about −20 dB. The unsymmetrical disturbance of antenna is for the reason that the antenna was located outside of the rotation axis. After using the method, the multipath signal of the metal plate is mostly removed. The main-side lobe is <1 dB and the bottom of pattern is >−30 dB. The result almost coincides with the measured far-field pattern, which verifies the effectiveness of the method.
The unitary antenna patterns

Conclusion
This paper presents a signal processing method to improve the measurement accuracy of low-frequency narrow-band antennas. The wideband signal is obtained by extrapolating the original band according to modern spectral estimation theory, the time-domain resolution is also improved after extrapolation; thereby the influence of the multipath signal is eliminated. The simulation and experiment show that the method shows good results. In the method, there are some suggestions for the extrapolated frequency domain range and the selection of model order p. First, if the extrapolated frequency domain range is too small, the time-domain resolution will not be improved obviously. If the extrapolated frequency domain range is too large, it will lead to distortion of time-domain response. We recommend that the frequency domain range after extrapolation is twice than the original bandwidth. Second, when the model order is increasing, the time-domain resolution will be improved. But if the model order continues to increase, the improved effect will not be obvious.
In the actual low-frequency narrow-band antenna measurement, the measured pattern often appears fluctuation. The method can be used to improve the result. Moreover, the method can be applied to higher frequency antenna measurement and used under indoor or outdoor conditions.
Acknowledgements
The authors thank the reviewers for their questions and suggestions. This work was supported by the National Natural Science Foundation of China (no. 61871323 and 61571368).
 C. F. Hu received his B.Sc. in 2004 and M.Sc. in 2007 both from Northwestern Polytechnical University, and obtained his Ph.D. from Northwestern Polytechnical University in 2010. Now he is a vice professor in Science and Technology on UAV Laboratory, Northwestern Polytechnical University. His research interests include antenna measurement and radar imaging and microwave remote sensing.
 N. J. Li received his B.Sc. in 1998 and M.Sc. in 2001 both from Northwestern Polytechnical University, and obtained his Ph.D. from Northwestern Polytechnical University in 2006. Now he is a vice professor in Science and Technology on UAV Laboratory, Northwestern Polytechnical University. His research interests include antenna measurement and radar imaging and microwave remote sensing.