




1. Introduction
Rules make a behavioral expectation explicit. They ‘are principles or maxims that prescribe or proscribe a particular standard of behaviour (…) and come in various forms as orders, regulations and guidelines issued by authorities, as laws and legal statutes, and as informal social and moral norms’ (Gächter et al., Reference Gächter, Molleman and Nosenzo2025, p. 2). In this broader sense, rules are normative. But the rule need not have the purpose to overcome the conflicting will of its addressee. The rule ‘Thou shalt not steal’ does indeed keep individuals in check who might be tempted to appropriate foreign property without the consent of its owner. But the rule ‘You must drive on the right-hand side of the street’ only solves a coordination problem. What makes a rule a rule is the explicit normative call, regardless of its ability to effectively coordinate behavior and promote ethical decision-making (Gross and De Dreu, Reference Gross and De Dreu2021; Mulder et al., Reference Mulder, Jordan and Rink2015).
The normative character of a rule is more visible if the rule comes with an enforcement mechanism. Legal rules can normally be enforced with the help of state authority. Social rules are often backed by the threat of social sanctions, ranging from mere frowning to ostracism (Van Lange and Joireman, Reference Van Lange and Joireman2008). But enforcement is not a precondition for the existence of a rule (Depoorter and Tontrup, Reference Depoorter and Tontrup2016).Footnote 1
1.1. Determinants of rule following
It is precisely the normative call that makes rules useful. A rule does not only guide the behavior of its addressees because it is informative. The rule comes with an explicit legal or social expectation. Experimental evidence shows that individuals often follow rules even when doing so yields no material benefit and may even involve personal costs (Gächter et al., Reference Gächter, Molleman and Nosenzo2025; Kimbrough and Vostroknutov, Reference Kimbrough and Vostroknutov2016). Such behavior can be explained by strong disutility from rule violation—for example due to concerns about social sanctions (Krupka and Weber, Reference Krupka and Weber2013; Schram and Charness, Reference Schram and Charness2015), reputational considerations (Bénabou and Tirole, Reference Bénabou and Tirole2011; Lacetera and Macis, Reference Lacetera and Macis2010), but it may also result from rule-utilitarian convictions (Harsanyi, Reference Harsanyi and Harsanyi1982), or deontological preferences (Alexander, Reference Alexander2008; Zamir and Medina, Reference Zamir and Medina2011). Moreover, individuals are more likely to follow rules when they believe that others do so as well (Desmet and Engel, Reference Desmet and Engel2021), consistent with conditional preferences for cooperation (Engel and Rockenbach, Reference Engel and Rockenbach2024; Fischbacher et al., Reference Fischbacher, Gächter and Fehr2001; Fischbacher and Gächter, Reference Fischbacher and Gächter2010).
From a consequentialist perspective, rule following is conceptualized as a deliberate, ad hoc choice made whenever a rule-relevant situation arises. Deliberation, however, represents only one of two overarching modes of human decision-making (Kahneman, Reference Kahneman2011): In contrast to slow, effortful, and deliberate processing (System 2), heuristics (Gigerenzer et al., Reference Gigerenzer and Todd1999; Gigerenzer and Engel, Reference Gigerenzer and Engel2006) and intuition (Betsch and Glöckner, Reference Betsch and Glöckner2010; Engel and Singer, Reference Engel and Singer2008) rely on fast, experience-based, and cognitively effortless processing. The herein conducted research builds on the latter perspective, where individuals follow rules not because they effortfully evaluate costs and benefits, but because the required behavior aligns with what they have repeatedly done in similar contexts (i.e., routinized decision-making; Betsch and Haberstroh, Reference Betsch and Haberstroh2005; Betsch et al., Reference Betsch, Lindow, Engel, Ulshöfer and Kleber2015). Routines form over time when repeating behavior in comparable situations (Becker and Lazaric, Reference Becker and Lazaric2009; Lally et al., Reference Lally, Van Jaarsveld, Potts and Wardle2010). Accordingly, routines are characterized by consistent behavior across time and situations (Gardner, Reference Gardner2015). Once established, routines are triggered by contextual cues (Wood and Neal, Reference Wood and Neal2009). Although individuals remain free to deviate, the likelihood of repeating past behavior increases when situational conditions are perceived as sufficiently similar (Becker and Lazaric, Reference Becker and Lazaric2009). With repeated exposure, the cognitive association between context and behavior strengthens, reducing the accessibility of alternative actions (Danner et al., Reference Danner, Aarts and De Vries2008). From a rule-following perspective, this is generally advantageous. When routines align with existing rules, there is little risk of an implementation deficit (Lampinen and Uusikylä, Reference Lampinen and Uusikylä1998). Rule-congruent routines are also resilient to others’ noncompliance (Chandler, Reference Chandler2014), as individuals neither question the rule nor rule compliance in general.
1.2. Rule change
A fundamental challenge, however, is that rules are not static: Normative expectations shift, new information emerges, and circumstances change. Rules are therefore frequently revised. If rule following were determined by deliberate choice, rule change would not pose much of a challenge. Addressees could be expected to adjust to the new rule in the same way they had followed the previous rule. Yet there is a challenge if previously rule following had been routinized. There is an inherent tension between behavioral stability and flexibility: RoutinesFootnote 2 that were once adaptive may persist even when they no longer match the updated rule. This is particularly consequential for organizations: What originated as an explicit behavioral expectation gradually transforms into an element of organizational culture that members of the organization routinely comply with and stick to. When existing routines are well aligned with the former rule, individuals have little reason to actively seek updated information. Yet a prerequisite for adaptation is that individuals notice that the rule has changed, and even if they do, adjusting behavior requires effort. Whereas executing routines is cognitively effortless, modifying them requires active, deliberate intervention as it entails both unlearning a routine and establishing a new one. This challenge is the topic of the present paper.
1.3. Determinants of adaptation
How quickly updating occurs may depend on two features that are central to rule-change design. First, rules differ in who benefits from compliance. Many rules address conflicts of interest: They are motivated by collective welfare concerns (Kaplow and Shavell, Reference Kaplow and Shavell2002), but impose time, effort, or other costs on individuals, thereby creating incentives for noncompliance (e.g., waste separation). Other rules are paternalistic in that compliance benefits the individual (Rathje et al., Reference Rathje, Roozenbeek, Van Bavel and Van Der Linden2023) as for instance bans on swimming in shipping ports or seat belt regulations (Bergmann, Reference Bergmann2009; Evans, Reference Evans1986). Together, these examples suggest that who benefits from compliance may shape how readily behavior updates when rules change.
Second, individuals may detect and adapt to rule change via different learning channels. They may (i) receive performance or compliance feedback—either through reduced outcomes in paternalistic contexts or through sanctions when rules address conflicts of interest (see e.g., Fehr and Gächter, Reference Fehr and Gächter2002); (ii) observe peers whom they believe to be subject to the same rule (Bandura, Reference Bandura1986; Betsch et al., Reference Betsch, Lindow, Engel, Ulshöfer and Kleber2015), such that changes in others’ behavior signal a rule change, albeit potentially noisily; or (iii) actively search for explicit information about the rule’s content to verify whether it has changed (which again might yield noisy signals).
We readily acknowledge that the adaptation to rule change may benefit from more generic psychological processes like reinforcement learning (Sutton and Barto, Reference Sutton and Barto1998) and social learning (Bandura, Reference Bandura1986). But these processes are activated in a task that is defined by an explicit normative expectation (i.e., the rule), which participants know is to their personal benefit or to the benefit of a charity. Hence the experiment investigates how the adaptation to a changed rule is aided or impeded by these more generic psychological processes.
1.4. Aim of the present research
The present research investigates how quickly individuals update routinized rule-following behavior when a previously valid rule changes. We focus on the above-described determinants that may be central for the design and implementation of rule change. First, we examine learning channels—that is, how individuals learn that the rule has changed—distinguishing between trial-and-error performance feedback, observing others’ behavior, and actively searching for rule information. While the effectiveness of peer observation as a ‘cue for change’ has already been shown (Betsch et al., Reference Betsch, Lindow, Engel, Ulshöfer and Kleber2015), it remains an open question how this social signal compares to other fundamental learning environments. We address this gap by shifting the focus from the internal mechanics of a single channel to a comparative evaluation of different learning channels. Specifically, we investigate how the effectiveness of social cues (observation) performs relative to both direct experience (feedback) and the active search for explicit information.
Crucially, we investigate the interaction between these learning channels and the underlying motivational structure of the situation. By experimentally varying the beneficiary of rule compliance, contrasting situations in which following the rule exclusively serves the individual (paternalistic/self-benefiting) versus situations in which compliance exclusively benefits a social addressee (mitigating a conflict of interest/externality), we test whether these factors exert independent effects on the speed of adaptation or whether certain learning channels are uniquely suited to facilitate adaptation when rules serve mere self-interest rather than social interests.
The paradigm. We developed a novel experimental design that does not elicit moral intuitions about the appropriate behavior but captures routinized, System-1-based rule following rather than deliberate normative reasoning. Participants move a ball through a two-dimensional grid to reach a goal on the other side of the maze (see Figure 1) by literally navigating square-by-square via keyboard inputs. They are incentivized to traverse the maze with as few ‘steps’ as possible. While there are different solutions to the maze, two paths (‘left path’ and ‘right path’) are dominant because they represent the shortest paths (that are equal in both length and the number of turns). Although the mazes change slightly in each round, these paths remain consistent throughout the experiment but were not visually highlighted.
The paradigm.
Note: The left maze shows an example maze at the start, before any move. The player is represented by a polka-dotted ball (left maze); stepping on a trap changes the ball to a vertical-line pattern (right maze). The goal is the checkerboard field. Environmental feedback (baseline) is displayed below the mazes in all conditions.

Figure 1. Long description
The image consists of two side-by-side panels.
Left Panel (Start State):
* A 21 by 21 grid maze with black and gray squares.
* At the top center is a checkerboard goal icon.
* At the bottom center is a polka-dotted ball representing the player.
* Below the grid, text reads: Use the arrow keys to move through the maze. Number of steps taken: 0. Number of special fields encountered: 0. Your endowment: 100.
Right Panel (Active State):
* The same 21 by 21 grid maze.
* The checkerboard goal remains at the top center.
* The player icon has moved to the middle-left of the grid and changed to a vertical-line pattern, indicating a trap was triggered.
* Below the grid, text reads: Use the arrow keys to move through the maze. Number of steps taken: 19. Number of special fields encountered: 2. Your endowment: 73.
Which of the two paths is preferable depends on the number of ‘trap’ fields. Trap fields are not visible to the subject until stepped on, changing the appearance of the participants’ ball (see also the right-hand side of Figure 1). Trap fields count as five steps, instead of one. The number of traps participants encounter on a path differs across rounds, ranging between one and eight. Still, one path always has less traps. Participants are told in the instructions:
Please note that there are always multiple ways to navigate the maze. However, there is a rule that dictates which path you must take. This rule is not enforced. Therefore, you are free to follow the rule or not. Your payment is based solely on the solution you choose for the mazes. You will not suffer any negative financial consequences for breaking the rule. However, following the rule is in your own [social condition: in the public’s] best interest, as it reveals the path with fewer special squares.
Rules are stylized as ‘You must first take four steps upwards and then one step to the right’. (Right path, rule for the first 50 rounds) or ‘You must first take five steps to the left’. (Left path). In the Individual Policy Problem condition, the rule is paternalistic: the more steps are counted, the less the payout to the individual. By contrast in the Social Policy Problem condition, participants earn a fixed fee. But the more steps they take, the smaller the payout to a charity. Participants could choose one of three charitable organizations to receive the donation: ‘Atmosfair’, a climate-protection organization focused on offsetting and reducing carbon emissions; ‘Deutsches Rotes Kreuz’, the German Red Cross and thus a humanitarian aid organization; and ‘Förderkreis für krebskranke Kinder und Jugendliche Bonn e.V.’, a local association supporting children and adolescents with cancer and their families.
The first 50 rounds were intentionally designed to establish a stable procedural routine. After 50 rounds, the opposite path becomes either individually or socially optimal. Participants are told at the beginning that the rule could change over the course of the experiment but are not informed about the specific point in time. Moreover, participants were not reminded of the rule during task execution.
1.5. Hypotheses
We preregistered our hypotheses at https://osf.io/behqv/overview. Our dependent variable (y) is the speed of adaptation, operationalized as the fourth consecutive trial that a participant has consistently chosen the path in accordance with the new rule after the rule change.Footnote
3
Consequently, with the new rule being established in round 51,
${y}_i=\left\{\;y\;|\;54\le y\le 100\;\right\}$
 : the earliest round in which a participant may have (reliably) changed is round 54.
1.5.1. Learning channel
With regard to the learning channel, we expected:
H 1a : Subjects switch paths earliest if they can actively search for information (versus observing another individual versus receiving environmental feedback only).
This hypothesis relies on the greater trust in information that has been actively sought (versus being passively provided; Anderson and Pildes, Reference Anderson and Pildes2000).
Alternatively, participants may be most responsive to observational evidence, in addition to the performance feedback. Observing peers who potentially deviate from the previously normative choice may alert participants to the possibility of change, facilitating a behavioral update (Bandura, Reference Bandura1986; Betsch et al., Reference Betsch, Lindow, Engel, Ulshöfer and Kleber2015). This motivates our second alternative hypothesis.
H 1b : Subjects switch paths earliest if information is based on observing peers (versus needs to be actively sought versus receiving environmental feedback).
It is finally conceivable that participants dislike authoritative interventions (exhibiting reactance; Brehm, Reference Brehm1966; Engs and Hanson, Reference Engs and Hanson1989) and suspect that imposed feedback about the choices of others is a trap, or not reliable (Krishnan and Carment, Reference Krishnan and Carment1979). If either mechanism were at work, we might actually see.
H 1c : Subjects switch paths earliest if they exclusively experience themselves that the formerly normative path is no longer optimal (i.e., receiving environmental feedback compared with a condition in which they also observe the choices of peers or can explicitly seek information about the rule).
1.5.2. Beneficiary of rule compliance
As second dimension, we manipulate the underlying motivation to change the rule (i.e., the policy problem). The rule either helps the participant make a higher profit, or it makes sure that a charity receives a higher subsidy. Specifically, this design gives participants a choice between three charities (serving general social causes, environmental causes, or children’s health). Every individual participant may pick her preferred recipient.
Being more responsive to rule change in the paternalistic condition may simply be rational, as the participant’s own outcome is at stake (Ballard et al., Reference Ballard, Sewell, Cosgrove and Neal2019; de Puiseau et al., Reference de Puiseau, Glöckner and Towfigh2019; Easton, Reference Easton and Buckley2017; Hart, Reference Hart1961; Tyler, Reference Tyler1997, Reference Tyler2006). Additionally, slower responsiveness when the rule aims to promote a positive externality may be rationalized even if participants feel morally obliged to support the charity. When the exact timing of a rule change is unknown, and individuals are only generally aware that rules may change, the resulting uncertainty may create scope for ‘moral wiggle room’ (Dana et al., Reference Dana, Weber and Kuang2007) to ignore or downweigh cues indicating that the rule has changed. Hence, we predict
H 2a : Subjects switch paths earliest if the underlying policy problem the rule tries to solve is individualistic (versus social).
On the other hand, if the beneficiary is a charity, participants might perceive a call of duty. Prosocial motives (Andreoni, Reference Andreoni1989; Andreoni and Bernheim, Reference Andreoni and Bernheim2009; Andreoni and Miller, Reference Andreoni and Miller2002; Dana et al., Reference Dana, Weber and Kuang2007) and prosocial preferences (e.g., Murphy et al., Reference Murphy, Ackermann and Handgraaf2011; Van Lange, Reference Van Lange1999) may not only correlate with rule compliance in general, but also speed up adaptation, leading to our second alternative hypothesis
H 2b : Subjects switch paths earliest if the underlying policy problem the rule tries to solve is social (versus individualistic).
1.5.3. Interaction between learning channel and beneficiary of rule compliance
We investigate how the nature of the policy problem moderates the effectiveness of different learning channels. Specifically, we expect that the difference in adaptation speed between mere performance feedback and observational feedback or active information search will be more pronounced when rule compliance benefits the participant herself, rather than a charity. This expectation is motivated by the fact that information search requires proactive, costly effort. If a rule change only benefits a charity, participants may refrain from investing resources into active search. They might also pay less attention to the behavior of their peers if spotting rule change swiftly does not increase their payoff. We therefore predict:
H 3a : The responsiveness of speed of adaptation to the learning channel is more pronounced if rule compliance is beneficial for the participant’s personal payoff.
Yet, the opposite effect could also be rationalized. Participants might feel a heightened sense of responsibility when a charity’s payoff is at stake, leading them to feel ‘guilty’ if they do not explore all available options for rule changes. This might motivate participants to pay more attention to additional learning channels. We therefore predict alternatively:
H 3b : The responsiveness of speed of adaptation to the learning channel is more pronounced if rule compliance is beneficial for the charity’s payoff.Footnote 4
2. Method
2.1. Research transparency statement
We preregistered our hypotheses, the corresponding analyses next to an a priori power analysis at the Open Science Framework (https://osf.io/behqv/overview). We make materials and data openly accessible (https://osf.io/pserz/overview). The study has obtained ethical approval from the Max Planck Society (Approval Nr. 2018_3—Renewal 2024_28). The study was programmed in oTree (Chen et al., Reference Chen, Schonger and Wickens2016) and conducted in line with behavioral economics standards (i.e., decisions were incentivized, without deception). Participation yielded an average payment of 18.85 € per participant, with an average duration of approximately 1:30 hour.
2.2. Experimental design and materials
To test our hypotheses, we implemented a 2 × 3 factorial between-subject design. In one dimension we manipulate the underlying motive for the rule change, namely, who benefits from rule following. The rule is either meant to help its addressee to better achieve her own interests (individualistic condition), or the behavior of the addressee comes with the potential of a positive externality (social condition), which is at risk if the addressee’s behavior is suboptimal. In the second dimension we manipulate how the addressee may learn about rule change: merely from performance feedback (baseline) or additionally by observing peers (observation condition) or by actively searching for the explicit content of the rule (information search condition). We apply these manipulations to the newly developed maze task: Over 50 periods, participants have the opportunity to form a routine (how to walk through a maze, such that they minimize cost and risk). After 50 periods, the rule changes, without explicitly telling participants. The order of the mazes was varied in four different ways. As dependent variable, we measure how quickly participants adapt to the new rule.
In the individualistic (versus social) condition, adhering to the rule indicating the path through the maze with smallest number of trap fields maximizes participants’ payoffs. Specifically, participants are endowed with 100 experimental currency units (ECU; €.50) per maze, and one ECU is deducted for each step taken (trap fields count as five steps). Thus, rule following is in participants’ own financial interest.
In the social condition, in contrast, stepping on trap fields has no financial consequences for participants. Instead, participants receive a flat payment of 30 ECU per maze solved, corresponding to the expected per-maze payoff in the individualistic condition. At the same time, a charity is endowed with 100 ECU (€.50) per maze, with deductions of one ECU per step taken (again counting trap fields as five steps). Accordingly, encountering a trap field reduces the donation by .02 €, and rule following maximizes the charitable donation. Participants chose their preferred charity out of three pre-specified organizations prior to the experiment (general social causes, environmental causes, or children’s health).
To manipulate the learning channel through which participants could detect rule change, we implemented three between-subject conditions. In the baseline condition, participants receive no information beyond performance feedback. Specifically, a live counter displays the number of steps taken and traps encountered in the current maze, as well as the final payoff for that maze, to prevent counting errors. In the observation condition, participants additionally see, after each maze, the first seven steps taken by another player who had solved the same maze. These behavioral traces are taken from a pilot study conducted to validate the paradigm (see Supplementary Material). Participants were required to view the seven-step sequence at least once before proceeding but could revisit it as often as they wished. To increase external validity, the observed behavior is not perfectly informative: With 85% probability, the other player adheres to the currently applicable rule. Participants are told that the observed information is not perfectly reliable, but do not learn the exact probability of feedback being correct. They are also not told whether, in a specific maze, they have complied with the rule.
In the information-search condition, participants may request information about the rule’s current content by pressing a button that reveals which path to choose. On each information screen, participants respond ‘Yes’ or ‘No’ to the question whether they want to reveal the rule. Yet information search is costly. The participant’s payoff is reduced by 25 experimental currency units (ECU; €0.125). The total amount of information search costs was deducted at the end of all rounds of the maze paradigm. If a participant chooses to reveal the rule, the information is correct with 85% probability and refers to the previously solved maze. Participants know that the information is not perfectly reliable, but they do not know the exact probability.
To control for individual differences, we assessed conditional rule-following (Desmet and Engel, Reference Desmet and Engel2021), social value orientation (Murphy et al., Reference Murphy, Ackermann and Handgraaf2011), risk aversion (Holt and Laury, Reference Holt and Laury2002), demographics, and video game experience (i.e., daily gaming hours). As preregistered, we tested all hypotheses controlling for these individual differences (see Supplementary Material, chapter 4). Because the results were qualitatively unchanged, we report the parsimonious models in the main text (Figure 2).
The learning channels.
Note: The left panel shows the information screen for observational feedback. In the experiment, the path was presented as an animated GIF, with the ball moving through the maze rather than all steps shown at once. The upper-right panel shows the decision screen in the information-search condition; the lower-right panel shows the rule display shown after participants chose to reveal the rule.

Figure 2. Long description
The interface is divided into three distinct sections.
On the left is a large square grid maze composed of black and light gray tiles. A checkered circular icon is positioned at the top center. Near the bottom left, a sequence of seven circular icons with four dots inside each marks a path moving four steps up and then three steps to the right. Below the grid, text reads, ‘Another person who also had to reach the goal chose the following steps at the beginning. Please note that the first 7 steps are repeated.’
The top-right panel is a white screen with a central pop-up box. Text at the top states, '[...] Please note that retrieving the information costs 25 E C U! [...]'. The central box asks, ‘Would you like to see the rule?’ with two green buttons below labeled ‘Yes’ and ‘No’.
The bottom-right panel shows a grayed-out version of the previous screen with a white overlay in the center. The top text remains the same. The white overlay contains a small gray ‘x’ at the top and the instruction, ‘First, you must take four steps up and then one step to the right.’ A green ‘Next’ button is located at the bottom center of the panel.
2.3. Experimental procedure
The experimental procedure is summarized in Figure 3. After arriving in the lab, participants were informed about schedule, pay-out processing, and data handling and provided written consent. Afterwards, they were presented with instructions for the task at hand and had to pass a comprehension check. Participants were able to re-read the instructions after the initial instructional phase via a pop-up window, triggered through a button on the decision screen. They were not able to retrieve the rule after the instructive phase. After participants read the instructions, they solved the mazes in the respective, randomly allocated experimental condition. Between each maze, there was a short loading bar, serving as a visual disruptor. After completion of all mazes, individual differences in risk preferences, social value orientation, conditional rule following, randomized in their order, and demographics were assessed. Finally, subjects received a detailed overview of their payoffs and provided payment information, stored separately from their scientific data. In addition to the outcome of the maze paradigm, one of the three individual difference measures (i.e., SVO, risk aversion, and conditional rule following) was randomly chosen for payment.Footnote 5 After the study concluded, the sum of donations was transferred to the corresponding charity. Proof of the final donation amount was accessible for participants.
Experimental procedure.
Note: Dotted lines refer to information that is only displayed in the applicable treatments.

Figure 3. Long description
The diagram follows a central diagonal arrow pointing from the bottom-left to the top-right, with numbered grey circles marking the sequence.
* At the base is a rounded rectangle describing between-subject assignment to experimental conditions, instructions, and comprehension checks.
* Step 1: Random session-wide treatment assignment and random individual maze order assignment. Task instructions and comprehension check.
* Step 2: Participants solve a maze with two solutions of equal length and turns. This is part of a block repeated 50 times where the rule indicates the right path.
* Step 3: An information screen corresponding to the treatment (in treatments 2, 3, 5, and 6). This is grouped with environmental information available in all treatments and optional costly or free information about other players.
* Center: A horizontal bar labeled Rule change, flanked by two warning triangle icons.
* Step 4: Participants solve a maze with two solutions of equal length and turns. This is part of a second block repeated 50 times where the rule indicates the left path.
* Step 5: An information screen corresponding to the treatment (in treatments 2, 3, 5, and 6). Similar to step 3, this includes environmental information and treatment-specific information choices.
* Step 6: Individual assessment of Social Value Orientation, risk preference, Conditional Rule Following, demographics, and gaming experience elicitation.
Dotted lines indicate information only displayed in applicable treatments, such as costly information choices in treatments 3 and 6, or video information in treatment 2.
2.4. Participants
We conducted an a priori power analysis to determine the required sample size for the presumably smallest effect, the interaction effect (H3). Calculations were performed in R (version 4.4.0) (R Core Team, 2024), using the pwr.f2.test function (Champely et al., Reference Champely2020). We conservatively assumed a small-to-medium-sized effect (f2 = .07) for the interaction effect in a multiple linear regression model. The significance level was set at α = .05, and the power was 1 − β = .85. We preregistered the inclusion of 13 predictors, including the interaction effect of the manipulated variables, yielding a required sample size of N = 281 participants. Adding a small buffer in case of dropout during the experiment, N = 288 participants started the study, and N = 288 (thereof n female = 163, n diverse = 6, n unspecified = 3) completed it, which is why we had n = 48 participants per each of the six treatments. The average age of participants was 23.71 years (SD = 4.42).
3. Results
3.1. Deviations from preregistration
We have to explain two deviations from our preregistration: (a) the definition of the dependent variable and (b) the estimation strategy (i.e., the statistical models that were used).
3.1.1. Outcome definition (learning point)
We preregistered the learning point as the fourth post-change round in which participants chose the newly normative path for four consecutive rounds. While this captured the intended transition for most participants, it failed to reflect stable learning for a substantial subset: 61 participants met the criterion but subsequently reverted to the original path for four consecutive rounds (see Supplementary Table S4 for the distribution across treatments). Thus, the preregistered measure did not reliably distinguish learning from exploratory switching.
We therefore adopted a stricter definition. In all analyses, the learning point is defined as the fourth consecutive choice of the newly indicated path provided that participants do not later revert to the old path for four consecutive rounds. For example, if a participant reaches four consecutive new-path choices in round 62 but later returns to the old path for four consecutive rounds, and only again achieves four consecutive new-path choices in round 85, the learning point is coded as round 85 (not round 62). This adjustment aligns with standard definitions of learning as a process yielding long-lasting changes in behavioral potential (Anderson, Reference Anderson2000).
3.1.2. Estimation strategy
We preregistered linear regression models and based the power analysis on this approach. However, under the updated learning definition, 66 participants did not show learning within the experiment. Of these, 48 never chose the new path four times consecutively, and 18 did so but subsequently reverted to the old path for at least four consecutive rounds and did not return to consistent new-path use (see Supplementary Table S5 for the distribution across treatments). Linear regression would therefore require excluding these cases or assigning imputed placeholder values that do not reflect the observed behavior. To avoid that the statistical method not doing justice to the observed behavioral patterns, we analyzed time-to-learning using Kaplan–Meier curves (for descriptive visualization) and Cox proportional hazards models (for inferential statistics).
Kaplan–Meier curves are a nonparametric method for estimating the survival function, i.e., the estimated probability that an event has not yet occurred at a given point in time and are commonly used in survival analysis (Kaplan and Meier, Reference Kaplan and Meier1958). While typically applied in medical research to model survival over time, they are equally useful in the present setting as well, where the event is the point at which participants adapt to the new rule. Importantly, Kaplan–Meier curves account for right-censored observations—cases in which the event has not occurred by the end of the observation period (here: no adaptation to the new rule by the final trial). The curve represents, at each time point, the probability that a participant has not yet adapted to the new rule, allowing descriptive comparisons across experimental conditions. Drops in the curve correspond to participants adapting, such that the y-axis shows the probability of participants who have not yet adapted, plotted against time (rounds) on the x-axis. Hence, lower Kaplan–Meier curves indicate faster adaptation: At any given round, a lower value on the y-axis means a smaller share of participants has not yet adapted (i.e., more participants have adapted by that point). Likewise, a steeper decline reflects a higher rate of adaptation, because the probability of not yet having adapted decreases more quickly. Note that, unlike typical medical applications where the ‘event’ is undesirable (e.g., death), the event here—adapting to the new rule—is desirable; accordingly, interpreting the curve as ‘survival’ (not yet adapting) may feel counterintuitive at first.
For inferential analyses, we employ Cox proportional hazards models (Cox, Reference Cox1972). The Cox model relates predictors to the hazard rate, defined as the instantaneous rate of adapting in a given round, conditional on not having adapted yet. Thus, it assesses how the learning channel and the beneficiary predict adaptation. We report hazard ratios (HR, exponentiated coefficients), interpreted relative to the reference category (HR = 1). Hazard ratios above 1 indicate faster adaptation—that is, a higher instantaneous likelihood of adapting in a given round—whereas hazard ratios below 1 indicate slower adaptation. To illustrate, an estimated hazard ratio of 1.60 means the hazard of adopting the new rule is 60% higher than in the reference category, conditional on not having adopted earlier. A hazard ratio of .70 implies that the hazard is 30% lower than in the reference category. In our analyses, we use the baseline learning channel (mere performance feedback) and the charity beneficiary condition as reference categories. Note that the Cox model does not predict a specific adaptation time nor specify the functional form of the underlying base hazard of adapting; rather, it estimates whether participants in a given condition tend to adapt earlier within the observation window (in our case, within the second 50 mazes) compared to the reference category.Footnote 6
Analyses using the preregistered outcome definition and linear regression models are reported in Supplementary Tables S1–S3.
3.2. Descriptives
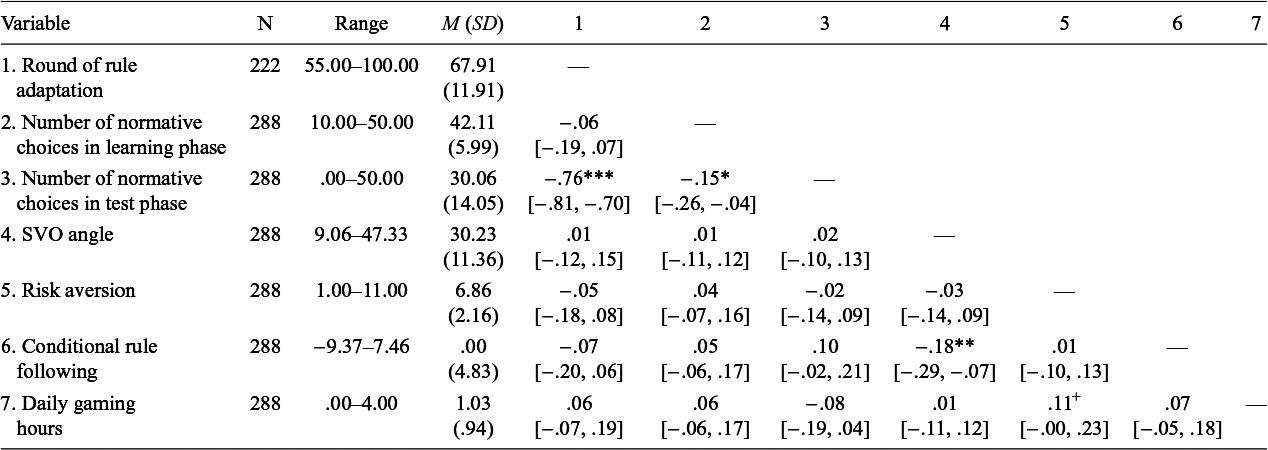
Table 1 provides an overview of means, standard deviations and bivariate correlations of our key variables. Figure 4 displays the speed of adaptation conditional on learning channels.
Means, standard deviations, and bivariate correlations of key variables

Table 1. Long description
The table consists of 11 columns: Variable, N, Range, M (S D), and numbered columns 1 through 7 for correlations.
* Row 1: Round of rule adaptation; N = 222; Range = 55.00–100.00; M (S D) = 67.91 (11.91).
* Row 2: Number of normative choices in learning phase; N = 288; Range = 10.00–50.00; M (S D) = 42.11 (5.99); Correlation with Variable 1 = minus .06.
* Row 3: Number of normative choices in test phase; N = 288; Range = .00–50.00; M (S D) = 30.06 (14.05); Correlation with Variable 1 = minus .76 (p < .001); Correlation with Variable 2 = minus .15 (p < .05).
* Row 4: S V O angle; N = 288; Range = 9.06–47.33; M (S D) = 30.23 (11.36); Correlations with Variables 1, 2, and 3 are .01, .01, and .02 respectively.
* Row 5: Risk aversion; N = 288; Range = 1.00–11.00; M (S D) = 6.86 (2.16); Correlations with Variables 1 through 4 range from minus .05 to .04.
* Row 6: Conditional rule following; N = 288; Range = minus 9.37–7.46; M (S D) = .00 (4.83); Correlation with Variable 4 = minus .18 (p < .01).
* Row 7: Daily gaming hours; N = 288; Range = .00–4.00; M (S D) = 1.03 (.94); Correlation with Variable 5 = .11 (p < .10).
Note: S V O stands for social value orientation. 95 percent confidence intervals are provided in square brackets for all correlation coefficients.
Note: SVO = social value orientation; daily gaming hours are right-censored, i.e., 4 = more than 3 daily hours; Range = min–max; + p < .10, * p < .05, ** p < .01, ***p < .001 (two-sided). 95% confidence interval in squared brackets.
Kaplan–Meier curves for learning channels.
Note: Drops in the curve relate to participants adapting to the new rule. A lower curve is associated with more participants adapting. A faster decline is associated with earlier adaptation.

Figure 4. Long description
The line graph plots Survival Probability on the Y axis from 0.00 to 1.00 against Time i.e. Round Number on the X axis from 50 to 100. A horizontal dashed line marks the 0.50 median survival threshold. Three stepped curves descend from left to right.
* Baseline represented by a solid black line remains the highest curve throughout the plot. It crosses the 0.50 probability threshold at approximately round 76 and ends near 0.30 at round 100.
* Info Search represented by a dashed line sits in the middle. It crosses the 0.50 threshold at approximately round 70 and ends near 0.20 at round 100.
* Observed Feedback represented by a dotted line is the lowest curve indicating the fastest adaptation. It crosses the 0.50 threshold earliest at approximately round 66 and ends slightly below 0.20 at round 100.
Vertical dashed lines drop from the 0.50 intersection point of each curve to the X axis to highlight the median adaptation time for each group.
Participants in the baseline condition adapted most slowly, as reflected by the consistently higher survival curve. In contrast, those who could observe others adapted the fastest, with their survival curve declining most steeply and reaching the median adaptation point earliest. The costly information-search group occupied an intermediate position—dropping earlier than the baseline but later than the observation group. Notably, because the information-search condition required proactive acquisition, we examined the actual search behavior: among the 96 participants with access, only 53 individuals (i.e., 55.21%) searched at least once, totaling 160 searches. Overall, the survival curves reveal a clear hierarchical order in adaptation speed: observation was fastest, followed by information search, with the baseline being the slowest.
Figure 5 shows that adaptation is considerably faster if the participant’s own payoff is at stake, compared with every additional step in the maze reducing the payout to the charity.
Kaplan–Meier curves for policy treatments.
Note: Drops in the curve relate to participants adapting to the new rule. A lower curve is associated with more participants adapting. A faster decline is associated with earlier adaptation.

Figure 5. Long description
A line graph with a light gray grid background. The Y-axis is labeled Survival Probability, ranging from 0.00 to 1.00 in increments of 0.25. The X-axis is labeled Time i.e., Round Number, ranging from 50 to 100 in increments of 10.
Two stepped curves begin at a survival probability of 1.00 at round 50 and remain flat until approximately round 55.
* The Social Policy Problem curve, represented by a solid black line, descends in a series of steps. It crosses the 0.50 survival probability threshold at approximately round 75. By round 100, the survival probability is approximately 0.30.
* The Individual Policy Problem curve, represented by a dotted black line, descends more rapidly than the solid line. It crosses the 0.50 survival probability threshold earlier, at approximately round 68. By round 100, the survival probability is lower than the social treatment, at approximately 0.15.
Horizontal and vertical dashed reference lines intersect at the 0.50 survival probability mark for both curves to highlight the median adaptation time. A legend at the bottom center identifies the Treatment Groups as Social Policy Problem (solid line) and Individual Policy Problem (dotted line).
3.3. Confirmatory analyses
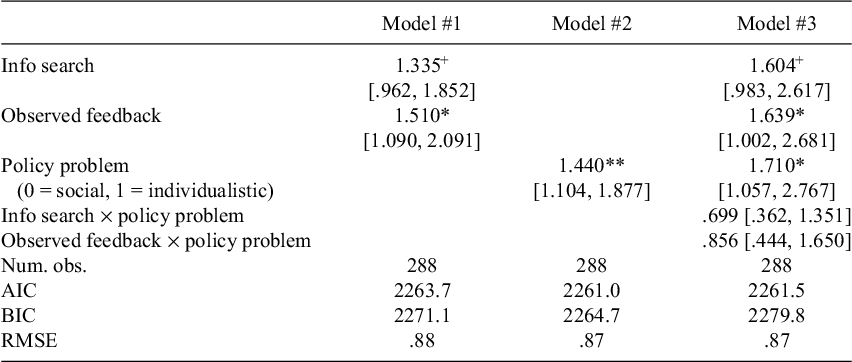
Table 2 presents the results of the Cox proportional hazards survival model. To test H1, we focus on the effect of learning channels, tested against the baseline (i.e., performance feedback) condition (see Table 2, model 1). As can be seen, the option to search for costly information increased the hazard of adaptation by 33.5% compared to relying solely on trial-and-error (hazard ratio = 1.335). That is, at any given round, conditional on a participant not having adapted yet, the instantaneous rate of switching to the new norm was 1.335 times as high in the treatment, compared with the baseline condition. Yet this effect was not significant at conventional levels (p = .084). However, the opportunity to observe other participants significantly increased the hazard of adaptation by 51.0% (p = .013). We therefore see Hypothesis H1b confirmed and conclude.
Cox proportional hazard model predicting the change in instantaneous risk to adapt to the new rule

Table 2. Long description
The table presents Hazard Ratios and 95 percent confidence intervals in brackets across three models.
Row 1: Info search. Model #1 is 1.335 plus [.962, 1.852]. Model #2 is empty. Model #3 is 1.604 plus [.983, 2.617].
Row 2: Observed feedback. Model #1 is 1.510 asterisk [1.090, 2.091]. Model #2 is empty. Model #3 is 1.639 asterisk [1.002, 2.681].
Row 3: Policy problem (0 equals social, 1 equals individualistic). Model #1 is empty. Model #2 is 1.440 double asterisk [1.104, 1.877]. Model #3 is 1.710 asterisk [1.057, 2.767].
Row 4: Info search times policy problem. Model #1 and #2 are empty. Model #3 is .699 [.362, 1.351].
Row 5: Observed feedback times policy problem. Model #1 and #2 are empty. Model #3 is .856 [.444, 1.650].
Row 6: Num. obs. All models show 288.
Row 7: A I C. Model #1 is 2263.7. Model #2 is 2261.0. Model #3 is 2261.5.
Row 8: B I C. Model #1 is 2271.1. Model #2 is 2264.7. Model #3 is 2279.8.
Row 9: R M S E. Model #1 is .88. Model #2 is .87. Model #3 is .87.
Note: plus indicates p less than .1, asterisk indicates p less than .05, and double asterisk indicates p less than .01.
Note: + p < .1, *p < .05, **p < .01. We report the exponentiated regression coefficient (i.e., the Hazard Ratio). As Hazard Ratios compare the outcome in a treatment with the outcome in the reference category, the model does not have a constant. 95% confidence intervals in squared brackets.
Result 1 (learning channel): If participants are informed about the choices by one other randomly chosen participant, rather than just receiving performance feedback, they adapt faster to rule change.
To test whether the beneficiary of rule compliance affects the speed of adaptation (H2), we compared conditions in which the rule indicated the option that maximized participants’ individual payoffs versus conditions in which it maximized a charitable donation. Participants adapted significantly faster when their own payoff was at stake (see Table 2, model 2, p = .007). We therefore see H2a as confirmed and conclude.
Result 2 (beneficiary of rule compliance): If the rule informs participants about the choice that maximizes their individual profit, they adapt faster to a change of the rule than if the rule informs them about the choice that maximizes the donation to a charity.Footnote 7
To test whether the effect of learning channel on the speed of adaptation depends on the beneficiary (H3), we estimated models that included both manipulations—learning channel and policy problem—and their interaction terms. The interaction effects were not statistically significant (see Table 2, all p > .28). Thus, we find no evidence that the advantage of observation or information search (relative to baseline feedback) differs between the individual-payoff and charity conditions. Instead, the results are consistent with additive effects: Learning channels and beneficiary structure each affect adaptation speed, but do not interact with one another.Footnote 8
3.4. Exploratory analyses
Previous research showed that with increasing routine strength, individuals are more likely to maintain their routine despite information suggesting that deviation would be beneficial (Betsch et al., Reference Betsch, Haberstroh, Glöckner, Haar and Fiedler2001). We aimed to conceptually replicate this finding by examining whether stronger rule compliance before the rule change predicted slower adaptation afterwards. The rationale is that repeated compliance with the initial rule may foster routinized responding, which could impede updating once the rule no longer applies. If so, participants who followed the initial rule more consistently should show lower compliance with the new rule during the test phase, controlling for our experimental manipulations.
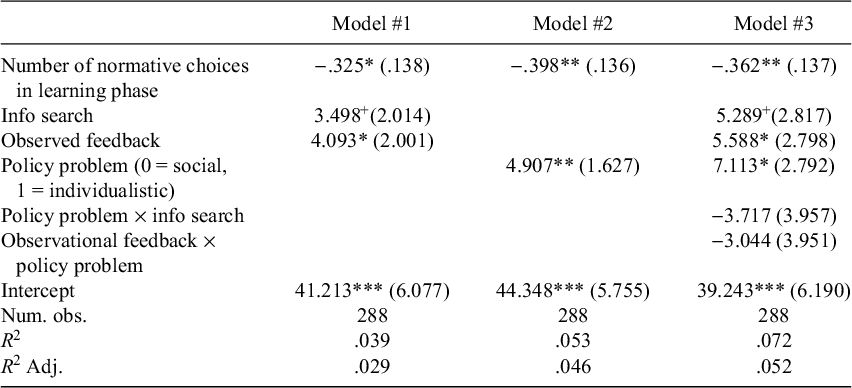
To test this, we regressed rule compliance after round 50 (i.e., the number of normative choices in the test phase) on pre-change routine strength via the number of normative choices during the learning phase (rounds up to and including round 50), controlling for the learning channels, (2) the beneficiary of rule compliance (policy problem), and (3) their interaction. Results are reported in Table 3. Indeed, normative choices in the learning phase were a strong and statistically significant negative predictor of normative choices in the test phase.Footnote 9 Thus, the more consistently participants complied with the initial rule, the more difficult it was for them to adjust to the new rule later. This pattern is consistent with the interpretation that stronger routines are accompanied by greater inertia, which in turn hinders adaptation.Footnote 10
Linear regression of the normative choice in the test phase (i.e., after round 50)

Table 3. Long description
A table presenting unstandardized b-coefficients and standard errors for three linear regression models.
Columns are Model #1, Model #2, and Model #3.
Rows include:
* Number of normative choices in learning phase: Model #1 is minus .325 (standard error .138); Model #2 is minus .398 (standard error .136); Model #3 is minus .362 (standard error .137).
* Info search: Model #1 is 3.498 (standard error 2.014); Model #3 is 5.289 (standard error 2.817).
* Observed feedback: Model #1 is 4.093 (standard error 2.001); Model #3 is 5.588 (standard error 2.798).
* Policy problem (0 = social, 1 = individualistic): Model #2 is 4.907 (standard error 1.627); Model #3 is 7.113 (standard error 2.792).
* Policy problem times info search: Model #3 is minus 3.717 (standard error 3.957).
* Observational feedback times policy problem: Model #3 is minus 3.044 (standard error 3.951).
* Intercept: Model #1 is 41.213; Model #2 is 44.348; Model #3 is 39.243.
* Number of observations: 288 for all models.
* R-squared: Model #1 is .039; Model #2 is .053; Model #3 is .072.
* Adjusted R-squared: Model #1 is .029; Model #2 is .046; Model #3 is .052.
Note: + p < .1, *p < .05, **p < .01, ***p < .001. We report unstandardized b-coefficients and standard errors in parenthesis. The learning phase is up to and including round 50.
4. Discussion
Rules foster coordination within groups and across society because they guide behavior and reduce uncertainty. At the same time, rules may need to change as circumstances shift, new information emerges, or normative standards evolve. Yet rule changes are only effective if individuals update previously learned routines. This has substantial implications, not least for organizations: Over time, explicit rules can become an element of organizational culture that members routinely follow and continue adhering to, even though the rule is outdated. The speed of adaptation is therefore a key bottleneck of rule change: Slow updating can prolong implementation gaps, undermine the intended benefits of revised rules, and create periods in which behavior remains anchored in outdated routines (see e.g. Betsch et al., Reference Betsch, Haberstroh, Glöckner, Haar and Fiedler2001).
Against this background, we examined how learning channels and the beneficiary of rule compliance shape adaptation speed after a rule change. We examine these factors in the context of routinized rule-following where repeated exposure and reinforcement have established stable patterns of either compliant or violating behavior over time. Prior research on adaptation speed has focused exclusively on peer observation as a learning channel (see Betsch et al., Reference Betsch, Lindow, Engel, Ulshöfer and Kleber2015). We extend this work in two ways: First, we introduce information search as an additional learning channel, allowing for a direct comparison between social learning and individual exploration within the same paradigm. Second, we examine whether the beneficiary of rule compliance matters—that is, whether adaptation unfolds at differential speed when following the rule benefits oneself versus a charity. Most importantly, this also allows us to test whether learning channel and beneficiary structure interact: One might expect that the social frame inherent in peer observation and a prosocial beneficiary (donation to charity) would mutually reinforce each other—a dual social framing where both the source of information and the purpose of rule compliance are socially oriented, producing an effect beyond their additive contributions.
Three key findings emerged. First, social learning via observing others’ behavior increased the speed of adaptation relative to baseline performance feedback. By contrast, information search did not significantly speed up adaptation. Third, adaptation was faster when rule compliance benefitted the individual rather than a social addressee (i.e., charity). Against our expectations, we found no interactions between learning channels and beneficiary structure. Thus, the beneficiary manipulation appears to shift adaptation speed generally, rather than selectively amplifying the effectiveness of specific learning channels. Taken together, these results indicate that both how people become aware of rule changes and who benefits from compliance systematically affect how quickly behavior updates.
Notably, nearly half of the participants in the information-search condition refrained from using the search option. This pattern is unlikely to be driven by excessive costs: On average, the investment would have paid off if participants had adapted roughly three rounds earlier as a result. The reluctance to acquire information rather mirrors forms of deliberate ignorance (Hertwig and Engel, Reference Hertwig and Engel2016) that have been documented across domains, including social decision-making. The limited willingness to acquire information about a potential rule (change) should caution policymakers against assuming that people will proactively seek out whether rules have changed. At the same time, our analyses on the full sample point in the expected direction, suggesting that with a larger sample (i.e., greater power) or higher uptake of information search, the overall benefit of providing access to explicit information might become large enough to outweigh the necessarily slower adaptation among participants who did not acquire information. Future research could systematically investigate interventions aimed at increasing information uptake. One possible avenue may be to further strengthen the framing of information avoidance as increasing the risk of violating the rule. While we implemented a comparatively strong rule framing through formulations such as ‘You must go left’, we did not directly assess whether participants psychologically perceived efficient maze navigation as a form of rule-following, which may have affected their willingness to search for information.
Focusing on the observation condition, the robust effect raises the question of what drives its effectiveness. Several factors inherent to observational learning could contribute to faster adaptation: the social nature of the information (learning from another person rather than abstract feedback), a cost advantage (the sequence was displayed at no cost, whereas feedback in the search condition had to be purchased), the unavoidability of the information (the behavioral sequence was automatically displayed, whereas in the search condition participants could choose not to acquire information at all), or demand characteristics (participants may have felt implicitly encouraged to use prominently displayed information). Our design does not allow us to isolate which of these factors—alone or in combination—accounts for the observed benefit. Future research could address this through systematic control conditions, for instance by comparing observation of another participant’s behavior with observation of a computer-generated sequence, thereby isolating the specifically social component of observational learning.
In supplementary analyses, we focused on a related question: Does the increased speed of adaptation in the observation condition capture genuine rule learning, or merely imitation of observed behavior? We operationalized adaptation as the point at which participants began to follow the new rule consistently, which could in principle reflect copying without understanding. We took two steps to reduce this concern. First, both observation-based information and information-search feedback were provided only after participants had completed a maze; thus, all information referred to the previous decision environment, and participants knew that environments would change every period. Second, if participants were blindly copying, they should also copy when the observed information was incorrect. However, only 34.32% did (see Supplementary Table S8), indicating that participants continued to follow the correct rule even when the feedback in the previous round was wrong. This speaks against blind imitation as the driver of the observation effect (Betsch et al. (Reference Betsch, Lindow, Engel, Ulshöfer and Kleber2015) also exclude mere imitation).
As final point, we discuss the interpretability of non-adaptation: Following the new rule implies learning, whereas failure to follow it does not necessarily imply the absence of learning. Non-adaptation may also reflect a general unwillingness to follow rules, or failure to process information indicating the rule change. The first explanation is not supported by our data though, as participants generally followed the rule during the initial learning phase. Among the 66 non-adapters, 23 continued to strictly follow the outdated rule in the test phase, consistent with insufficient processing of change-relevant information. The remaining 43 showed frequent switching during the test phase, indicating exploration and attempts to infer the new rule. Thus, non-adapters still provide diagnostic information about why rule adaptation did not take place.
Future research could test whether these findings generalize beyond our student sample and laboratory setting. Replications in non-WEIRD populations would strengthen conclusions about the robustness and generalizability of the observed effects. Beyond population generalizability, it will be important to examine whether similar results emerge across different classes of rules and compliance environments. Our paradigm captures adaptation in a controlled and rather stylized setting. Extending this framework to richer contexts (e.g., organizational procedures, safety regulations, digital-platform policies, or legal norms) would clarify when observation, feedback, and information search are most effective—and how institutional features such as enforcement, accessibility of information, and communication practices shape the speed of adaptation.
5. Conclusion
A central question for organizations and societies is how quickly people update well-learned routines of rule following when rules change—and which levers can accelerate this adaptation. Our results underscore that the speed of adaptation hinges on how people come to recognize the new rule, and who benefits from compliance. Trial-and-error learning can eventually produce adaptation, but adaptation is faster when individuals can draw on social observation. Crucially, this channel comes with a constraint: Observation requires visible models, which can make the initial phase of a rule change harder because a critical mass of compliant behavior must first emerge. In turn, information search failed to increase adaptation speed. This lack of effect likely stems from the requirement that participants actively seek information—a step many refrained from taking, even though the initial search costs were outweighed by the long-term benefits of faster adaptation. We therefore interpret the weak intention-to-treat effect of the information-search condition (relative to the baseline) as being primarily driven by low uptake. Because a substantial portion of participants did not utilize the search option, the mere availability of explicit rule information did not reliably translate into accelerated adaptation.
For policymakers and organizations, this implies that effective rule change cannot rely on a single channel. Early in a transition, social learning is limited because few people provide reliable behavioral exemplars. Conversely, making accurate information available is insufficient if individuals do not consult it. A practical implication is therefore to design rule-change environments that (a) lower barriers to active information acquisition and increase its salience, and (b) enable rapid diffusion once a subset of individuals has updated—by making compliant behavior observable and easy to emulate. In this sense, the key is not that everyone searches, but that a sufficiently large group becomes informed early on; once such a critical mass exists, social learning can propagate the new rule through the wider population.
Supplementary material
The supplementary material for this article can be found at http://doi.org/10.1017/jdm.2026.10050.
Data availability statement
The Data, code, and materials of this study are publicly available on OSF (https://osf.io/pserz/overview). Pilot data used for eliciting routine building in the maze environment are available at the OSF (https://osf.io/vsd89/overview).
Acknowledgment
The authors are grateful to Tilmann Betsch for his helpful and constructive comments on an earlier version of the manuscript and thank Michael Seebauer for his continued support in preparing and conducting the data collection.
Author contributions
The authors jointly delineated the hypotheses and research design. T.H. conceived the paradigm, programmed the study, and collected and curated the data. T.H. and C.E. analyzed the data. The authors jointly wrote the manuscript.
Funding statement
The authors received no financial support for the research, authorship, and/or publication of this article. Open access funding provided by Leiden University.
Competing interest
The authors declared no potential conflicts of interest with respect to the research, authorship, and/or publication of this article.
Ethical standards
This study was approved by the Ethics Council of the Max Planck Society (approval no. No: 2018_3—Renewal 2024_28). All research activities complied with ethical regulations of the Max Planck Society.
Declaration of generative AI
During the preparation of this work, the authors used ChatGPT 5.2 in order to suggest improvements to the writing and analysis code. After using this service, the authors reviewed and edited the content as needed and take full responsibility for the content of the published article.






 Open access

