Introduction
A welfare state is the public provision of cash and in-kind benefits to protect and improve the well-being of its citizens (Esping-Andersen, Reference Esping-Andersen1990). As Garfinkel et al. (Reference Garfinkel, Rainwater and Smeeding2010) put it, ‘welfare states . . . are primarily capitalist states with large, selective doses of socialism’ (p. 2). An explicit redistributive mechanism, the welfare state usually aims at improving certain subgroups’ economic well-being and overall social justice through the reallocation of resources (Alesina and Glaeser, Reference Alesina and Glaeser2004; Hills, Reference Hills2004; Titmuss, Reference Titmus1958). The size, structure and redistributive effects of a welfare state reflect a country's core social values as well as its political will and power to achieve those values (Barr, Reference Barr2001; Lampman, Reference Lampman1971).
Much of the existing welfare state literature concentrates on western developed countries. Relatively little has been done to examine the features of the developing welfare states, despite the growing research on some Latin American and East Asian countries in recent decades (e.g., Goodman et al., Reference Goodman, White and Kwon1998; Gough and Wood, Reference Gough and Wood2004; Lustig, Reference Lustig2001). With the world's second largest economy, China holds a uniquely important position in the world. While there are several recent books that examine various aspects of the Chinese welfare system (for example, Carrillo and Duckett, Reference Carrillo and Duckett2011; Chan et al., Reference Chan, Ngok and Phillips2008; Saich, Reference Saich2008), very few use quantitative data to gauge its size, structure and redistributive effects. This article provides quantified evidence on the change in the size and structure of the Chinese welfare state and its impact on income inequality.
One unique feature of the Chinese social welfare system is its sharp urban–rural contrast: the urban system is much more comprehensive and generous while the rural one is minimal and residual. This difference is rooted in China's urban–rural Household Registration System (Hukou) implemented at the outset of the communist regime, and has been much documented. In this article, we build on two recent studies to extend this body of literature. Gao (Reference Gao2010) used the China Household Income Project (CHIP) 1988, 1995 and 2002 data and provided quantitative evidence on the differences in size, structure and progressivity of the urban and rural social welfare systems. In this article, we update the empirical evidence from Gao using a newer wave of data to track these differences over a longer time period. Enabled by the availability of CHIP data collected among the growing rural-to-urban migrant population, this article also provides unprecedented empirical evidence on the basic features of social benefits for migrants and how they have changed over time. The analysis in this article is thus data-driven; it is based on and enabled by the use of the CHIP data, but also limited by what the data allow us to do and say.
Another study (Shi, Reference Shi2012) used data from qualitative interviews with expert scholars and officials from various cities to analyse the recent trend toward urban–rural harmonisation in China's social welfare system. The author found that a more inclusive social citizenship has emerged through this trend of harmonising the urban–rural divide, and the pivotal criterion for claiming social benefits has shifted from one's official urban or rural Hukou status to actual local resident status. While impressive progress toward such harmonisation has been made in selected localities (notably Chengdu, the focus of the article), the author also acknowledges that it is a long and complicated journey before China achieves complete urban–rural harmonisation, given the long history of the Hukou system and the fragmentation in the social welfare system. In this article, we provide quantitative results to complement the qualitative evidence provided by Shi (Reference Shi2012) regarding the urban–rural difference and possible harmonisation in social welfare. Our data capture an earlier time period (1988–2007) than examined by Shi (2008–2011) but make unique contributions by providing a national picture of social welfare provisions measured at the household level and tracking changes over time.
China: from welfare socialism to welfare capitalism
Is China a welfare state? If so, what does it look like and how big an impact does it have on income inequality? This article examines these questions both conceptually and empirically. We argue that China is indeed a welfare state, or at least very close to becoming one. It is, however, a highly divided welfare state along urban–rural lines: it is generous and progressive in urban China but marginal and regressive in rural China.
The Chinese welfare system before the market reforms launched in the late 1970s was embedded in its socialist ideology and planned economy. The paternalist Chinese government assumed responsibility for the welfare needs of all urban citizens. Under the full-employment policy, nearly all urban citizens were entitled to job security and employment-based comprehensive coverage of social benefits, including pensions, health care, housing, food and education (Gao, Reference Gao2006). Rural citizens, however, were asked to overcome living hardships by the following means: ‘rely on the masses, rely on the collective, regeneration through production, mutual help and mutual relief, supplemented by necessary relief and development aid from the government’ (Wong, Reference Wong1998: 94). As a consequence, the social welfare system for urban citizens was comprehensive and generous, while that for rural citizens was meagre.
The rapid market reforms launched in the late 1970s and expanded ever since have, in effect, shifted China from a socialist to a capitalist society, despite the government's insistence on its socialist ideology. China has become a welfare state which is primarily capitalist but with large, selective doses of socialism, as is the case in western welfare states. The main difference is that the capitalism in China is ‘state capitalism’ (Bremmer, Reference Bremmer2010; Huang, Reference Huang2008; McGregor, Reference McGregor2012; Tsai, Reference Tsai2007) in which the state is an active and dominant economic player, as opposed to the free market strategy adopted in most western capitalist nations. A second important difference between China and western nations is the sharp urban–rural divide in China that has continued from the socialist era into the capitalist era and will take time and fundamental reform to eradicate.
State capitalism, while producing remarkable economic growth and productivity for China, also comes with the inevitable challenges of a market economy, including the ups and downs of the economic cycle and fierce market competition in which some are less likely to survive and thrive than others. Because of these challenges, a comprehensive welfare state is needed more than ever. Some may argue that true welfare states are only possible in democratic societies, and China therefore is not a welfare state because of the authoritarian nature of its government. We argue that China is facing mounting democratising pressure and, in turn, has institutionalised local elections (mostly limited to the village level though), allowed some degree of freedom of speech (though far from full freedom) and faced a splurge of collective action. In the process, the Chinese government is gradually yielding to some public demands, especially in meeting the welfare needs and rights of the disadvantaged, and moving the country toward a more democratic direction.
Two other important forces have also helped transform China into a welfare state. First, the welfare state has always played an important role in maintaining social order and stability, despite the fact that this is rarely acknowledged and discussed in the western welfare state literature (see Piven and Cloward, Reference Piven and Cloward1972). In China, however, maintaining social order and stability has been an explicitly stated goal of the state's social welfare programmes. Second, the rapid urbanisation in China during the recent decades has also helped expedite China's transformation into a welfare state. By 2011, over half the population of China live in urban areas. In general, urbanisation is associated with easier access to information, more attention to inequality and more voicing of opinions, thus leading people to becoming more pro-democracy (Garfinkel et al., Reference Garfinkel, Rainwater and Smeeding2010). In recent years, rural-to-urban migrants have also been entitled to more social benefits in the cities (usually employment-based, see Gao et al., Reference Gao, Yang and Li2012).
China has been the frontrunner in the reduction of absolute poverty during the past decades, though mostly through economic growth and much less through welfare transfers. In turn, the development of the capitalist welfare system in China has helped reinforce the growth and efficiency of the Chinese economy. Social welfare programmes, especially social insurance, have also helped improve social integration and cohesion in Chinese society. This, however, is an achievement only notable within the respective urban and rural areas, but a growing strain on the ever prominent urban–rural disparity as shown below through our empirical analysis. In addition, both social insurance and social assistance are integral parts of the Chinese welfare state, despite being drastically different for urban and rural citizens.
The China Household Income Project (CHIP) Data
We use the China Household Income Project (CHIP) 1988, 1995, 2002 and 2007 survey data to provide empirical evidence on the changes in the size and structure of the Chinese welfare state and its impact on income inequality. CHIP is a repeated cross-sectional study designed by a team of Chinese and western economists and currently carried out by the School of Economics and Business Administration at Beijing Normal University. It is widely considered to be among the best available national survey data on household income, expenditures and programme participation (Bramall, Reference Bramall2001; Gustafsson et al., Reference Gustafsson, Terry and Li2008; Li et al., Reference Li, Sato and Sicular2013; Riskin et al., Reference Riskin, Zhao and Li2001). As noted by Khan and Riskin (Reference Khan and Riskin2005), CHIP remains ‘the only available source of (almost) nation-wide household-level data on income and other individual and household characteristics . . . (and) the only comprehensive data base for the application of an income definition that helps overcome the limitations of the official definition underlying the published income data in China’ (pp. 356–7). With the high stability and continuity of the CHIP research team during the four waves of study, CHIP data have been found to be highly consistent in study design, data collection methods and data quality (Li et al., Reference Li, Sato and Sicular2013). To assess data quality, the CHIP team randomly selected about 200 households in the most recent wave for return interviews. Information re-collected among these households consistently matched the original data collected from them, verifying the high reliability of the CHIP data.
CHIP particularly fits the analytical needs of this study. On the one hand, it provides detailed information on the various cash and in-kind social benefits received by all urban, rural and migrant households, along with a detailed accounting of other income sources; on the other hand, questions on income and benefits were asked largely consistently across the four waves of CHIP surveys, allowing the tracking of changes and comparisons over time. The use of the unprecedented 2007 data allows us to provide a more updated, comprehensive picture of the Chinese welfare state and to draw implications for China's ongoing and future social policy reforms.
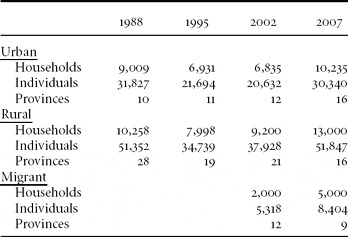
Samples of the CHIP study were drawn from larger National Bureau of Statistics urban and rural samples using a multistage stratified probability method to achieve national representativeness. The sample households were drawn from lists of households with official local urban or rural Hukou. Because in-person interviews were conducted with each participating household, the respondent had to be actually residing in the household. CHIP contains sample provinces from eastern, central and western regions (see Eichen and Zhang, Reference Eichen, Zhang, Griffin and Zhao1993, for a detailed description of the initial CHIP sample design and procedures and Li et al., Reference Li, Sato and Sicular2013, for an update on the most recent wave). Table 1 presents the CHIP sample sizes for 1988, 1995, 2002 and 2007, the four years for which data are available for this study.
Sample sizes of the China Household Income Project (CHIP) study by year

Source: Authors’ calculations using CHIP data.
Rural-to-urban migration has been a steady trend in China since the early 1980s and has shown significant growth in recent years. The term ‘migrant’ refers to those with an official rural household registration status but actually residing in an urban area, mostly to earn a living and pursue better life opportunities. In 2010, there were an estimated 153 million migrants, making up 20 per cent of all urban residents and 11 per cent of the national population. CHIP 2002 included, for the first time, a sub-survey of 2,000 migrant households, with the sample conveniently drawn from the same cities as those included in the urban survey. CHIP 2007 used a more systematic approach and purposively chose the cities most populated by migrant families to be in the migrant sample, yielding a sample size of 5,000 households from fifteen cities. The analysis in this article will examine the mutually exclusive urban, rural and migrant groups separately.
The Chinese welfare state
Size and structure
In the welfare state literature, two main approaches are used to measure the size and structure of welfare states: the macro-level measure estimates the percentage of GDP (or total government expenditure) spent on social welfare based on official statistics, while the micro-level measure examines, from household survey data, the percentage of social benefit income in the household final income. The macro measure is more widely used in the western welfare state literature, partly because most government expenditure data are easily accessible via official statistics (and also compiled by the OECD) and partly because they are more clearly defined than household survey data and thus can be consistently estimated across countries. In recent years, more welfare state studies have adopted the micro-level measure, thanks to the availability of harmonised cross-national household survey data. The two measures do not always coincide, but taken together they often yield consistent conclusions about trends within a country and comparisons across countries (Garfinkel et al., Reference Garfinkel, Rainwater and Smeeding2010).
The micro measure has two unique advantages over the macro measure. First, the micro measure captures the actual income transfers and in-kind goods and services received by family members that can directly translate to material well-being, while the macro measure captures government spending at the aggregate level and does not always correspond to the actual benefits received by families. Second, because the micro measure captures social benefits at the household level along the income distribution and across various types of households, it enables scholars to estimate the redistributive effects of the welfare state, a goal unattainable by using the macro aggregate measure. In this article we will mainly rely on the micro measure based on the CHIP data, but will also supplement these main results using estimates from macro data on government welfare expenditures.
The size of the welfare state is measured as the amount of social benefits received by families as a percentage of their household final income. We adopt a comprehensive measure of total household per capita income (or final income), which includes market income, cash and in-kind social benefits, private transfers and other transfers less taxes and fees paid (Gao, Reference Gao2010; Gao and Riskin, Reference Gao, Riskin, Davis and Wang2008; Li et al., Reference Li, Sato and Sicular2013). Market income includes wage income, income from private enterprises/individual business, property income and rental value of owner-occupied housing. Social benefits include social insurance (mainly pensions and unemployment insurance), in-kind benefits (health care, housing and food) and public assistance (mainly minimum living standard assurance, or Dibao, the primary safety-net programme targeting the poor). The shares of the various social benefits in the total social benefit package measure the structure of the social benefit system.
We have a few important inclusions and exclusions in the measurement of social benefits that deserve some explanation. First, following the predominant tradition in the welfare state literature (Garfinkel et al., Reference Garfinkel, Rainwater and Smeeding2010; Hacker, Reference Hacker2004; Lampman, Reference Lampman1984), employer-provided benefits are included. This is particularly important in the Chinese case as the urban welfare system is heavily employment-based. These benefits are an integral part of the welfare state as they are mostly mandated by the government and the costs are shared by employers and the government. Including such benefits is also important for estimating the redistributive effects of the welfare state as these employment-based benefits tend to be more regressive than others.
Second, we include in-kind benefits – an important yet often omitted or undervalued component – in the social benefit package (Smeeding, Reference Smeeding1982). In-kind benefits are mostly estimated at their self-reported cash values. In all waves, participants were asked to estimate the rental value of the public housing that they occupied and the cash value of food items that they received. In 1995, 2002 and 2007, as well as in the 1988 rural surveys, participants were also asked to report the medical-care expenses covered by their employers, the government or the collective and estimate the cash value of in-kind health services, the sum of which became the value of total health benefits received by families. In the 1988 urban survey, however, the value of health benefits was not directly asked for and this is thus imputed using administrative data on provincial per capita public expenditure on employee health care. The administrative data differentiate public health expenditures on employees and retirees, respectively, by three types of employers – state (including public institutions), collective and other enterprises. Provincial per capita health expenditures on current or retired employees are obtained by dividing provincial total health spending by number of employees or retirees according to employer type. The administrative data are then imputed to individuals according to their employment status and type (Gao, Reference Gao2006). This imputation undermines the redistributive effect of health benefits for urban 1988, but is essential for the inclusion of this benefit for the entire study period.
Third, education, an important component of the welfare state, is not included in the calculation of the size of the Chinese welfare state using the CHIP data. Because the values of education benefits received were not directly asked about in the CHIP surveys, we would need to impute the values of education benefits using administrative data on government spending on education. This is doable but the results will underestimate the distribution of education resources and benefits across income groups and localities because of the lack of detailed education spending data at various levels of income and localities.
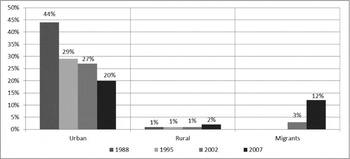
Figure 1 presents the share of social benefit income in household final income in urban and rural China respectively using CHIP 1988, 1995, 2002 and 2007 data and among the rural-to-urban migrants for 2002 and 2007. A few important findings are revealed by this figure.
Shares of social benefit income in household final income
Source: Authors’ calculations using CHIP data.

First and foremost, it shows that there exists a huge gap between urban and rural social benefits, or, the urban and rural welfare states. In 2007, urban social benefits made up 20 per cent of household final income, while that share was only about 2 per cent for rural residents. If they are indeed treated as separate urban and rural welfare states, the size of the urban welfare state would be comparable to those of western industrialised countries (Garfinkel et al., Reference Garfinkel, Rainwater and Smeeding2010), while the size of the rural welfare state would be among the world's smallest and similar to those of the least developed countries. Empirical evidence on the welfare systems of developing countries is scarce. Grosh et al. (Reference Grosh, del Ninno, Tesliuc and Ouerghi2008) studied safety-net programmes in seventy-two developing countries. They found that government spending on safety-net programmes as a percentage of GDP averaged only 1.9 per cent, ranging between 0.2 per cent in Senegal and 7.7 per cent in Mauritius.
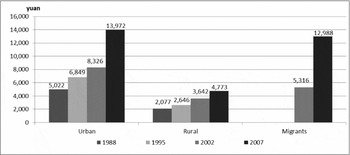
It is important to note that our measure – social benefits as a percentage of household final income – is a relative one. In fact, the sharp urban–rural gap revealed above is even greater when the actual levels of household income are considered. Figure 2 shows the levels of household per capita final income in annual yuan in urban and rural China and for rural-to-urban migrants (in 2007 value). Income levels rose significantly for all three groups during the study period, but the gap between the urban and rural areas remained large and became even larger in 2007. The urban-to-rural household final income ratio was 2.4 in 1988 and rose to 2.9 by 2007. In 2007, the ratio between the urban and rural levels of household per capita social benefits was 29, astonishingly high and much higher than the 20 per cent vs. 2 per cent difference when measured as a percentage of household final income as shown in Figure 1. However, our main analyses below still rely on the relative measure that we set out to use, as it is widely used in the international welfare state literature. Using this measure is also helpful for us to understand the different features of the urban and rural ‘welfare states’ within China. The income levels presented in Figure 2 can serve as a helpful contextual reference for understanding the remaining results.
Household per capita final income (annual yuan in 2007 values)
Note: All income levels are converted to 2007 values using official urban and rural CPIs. Income levels for urban citizens and migrants are converted using the urban CPI, while those for rural citizens are converted using the rural CPI.
Source: Authors’ calculations using CHIP data.

Second, as also shown in Figure 1, the urban social benefits measured as share of household final income shrunk significantly during this period. In 1988, social benefit income on average made up 45 per cent of household final income in urban China. That share, however, kept decreasing: to 29 per cent in 1995, 27 per cent in 2002 and 20 per cent in 2007. The cutbacks in social benefits in urban China took place alongside reforms of state-owned and collective enterprises. Before the economic reforms, under the full-employment policy, nearly all urban citizens had job security and comprehensive coverage of social benefits provided for by their employers. However, the financing of these social benefits became a heavy burden for employers and a hindrance to overall economic growth. To promote economic growth and efficiency, state-owned and collective enterprises were reformed to reduce or remove the welfare burden. As a result, the financing responsibility of pensions and health care has shifted from resting solely on employers to now being shared by employers, employees and the government. Housing and food benefits have been almost eliminated.
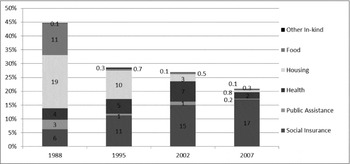
Consistent with these policy changes, empirical evidence based on the CHIP data in Figure 3 shows that, among the urban social benefits, social insurance increased steadily while all other benefits declined as a share of household final income from 1988 to 2007. Social insurance income, mainly made up of pensions and unemployment insurance, increased from 6 per cent of household final income in 1988 to 11 per cent in 1995, 15 per cent in 2002 and 17 per cent in 2007. This trend partly reflects the strengthening of social insurance programmes through broad employer and employee contributions, and partly population ageing, which is raising the portion of pension income in total society income.
Shares of various types of social benefit income in household final income in urban China
Source: Authors’ calculations using CHIP data.

On the other hand, all other benefits dropped as a share of household final income. Specifically, health care benefits initially increased from 4 per cent in 1988 to 5 per cent in 1995 and 7 per cent in 2002, reflecting the dramatic rise in health care costs and increased health consciousness among the public rather than a more generous health care system per se. From 2002 to 2007, health benefits as a share of household final income dropped to only 2 per cent, but this is an underestimation of the actual health benefits urban citizens receive. This is mainly because our estimate of health benefits in 2007 only captures in-kind health care and medical expenses paid by the work unit, but not the general benefits of participating in socialised medical insurance, including the Urban Workers Basic Medical Insurance (UWBMI) covering workers and the retired and the Urban Residents Basic Medical Insurance (URBMI) for urban residents not covered by the UWBMI, including children, students and older persons without an employment history. By the end of 2007, there were more than 180 million urban workers in the UWBMI scheme and nearly 43 million in the URBMI scheme, with a coverage rate of less than 50 per cent for both groups (Ministry of Human Resources and Social Security [MHRSS], 2008). Moving the health benefits from employer-based health care to social pooling helped to increase the health care coverage and shift the distribution of health benefits to being more equal among urban citizens.
Housing, food, other in-kind benefits and public assistance all decreased steadily from 1988 to 2007, as evident in Figure 3. Specifically, housing had been privatised, largely through subsidised purchasing over the years, yielding a sharp decrease in its share in household final income (from 19 per cent in 1988 to 10 per cent in 1995, 3 per cent in 2002 and only 0.8 per cent in 2007). Food assistance plummeted from 11 per cent of household final income to 0.7 per cent in 1995 and kept falling to only 0.3 per cent in 2007. Other in-kind benefits remained about 0.1 per cent of household final income during this period. Despite recent expansions in the Dibao programme, public assistance also decreased from 3 per cent of household final income in 1988 to 1 per cent in 1995 and 2002 and then dropped to only 0.2 per cent in 2007, suggesting that such public assistance programmes remain residual in the overall urban welfare state and on average only play a small role in contributing to total household income.
The third striking finding from Figure 1 is the consistently trivial welfare benefits in rural China. Social benefit income on average remained only 1 per cent of household final income for rural citizens from 1988 to 2002 and increased slightly to 2 per cent in 2007. In contrast to the much more comprehensive and generous social benefits in urban China, rural social benefits has always been marginal in coverage and minimal in provision. Only a very small privileged group of rural residents has had access to pensions due to their prior employment in state-owned or collective enterprises. The pre-reform, community-based rural health financing and provision system provided basic health services and wide coverage to rural residents. It was jointly funded by family contributions, a portion of the collective welfare fund and sometimes the government. The system collapsed after the rural economic reforms were launched in 1978, leaving many rural residents unable to afford the dramatically increasing health care expenses.
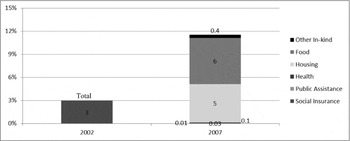
Lastly, Figure 1 shows that the social benefits for rural-to-urban migrants expanded substantially between 2002 and 2007. As a percentage of household final income, social benefits for migrants increased significantly from 3 per cent in 2002 to 12 per cent in 2007. Figure 4 further illustrates the structure of the social benefits for migrants in 2007. Nearly all social benefit income for migrants was from in-kind benefits, including food (6 per cent) and housing (5 per cent). These two kinds of benefits refer to catering and accommodation provided by their work units, or allowances for meals or accommodation deducted from their salary. Therefore, this may represent part of their salaries in the form of in-kind payment rather than more generous social benefits per se. Indeed, if these in-kind payments of food and housing are not counted, the share of social benefits in migrants’ household final income is reduced to a bare 1 per cent, very close to that for their rural peers. This reveals the still seriously lacking conditions of social benefits for migrants. Health benefits for migrants were minimal, mainly because migrants did not qualify for urban health insurance due to their lack of local city Hukou. Cash transfers received by migrants were also minimal, indicating that the current pension system and unemployment insurance covered only very few migrants. Migrants were also ineligible for Dibao benefits due to their lack of local city Hukou.
Shares of various types of social benefit income in household final income for rural–urban migrants in China
Source: Authors’ calculations using CHIP data.

How do these trends based on the micro measure using the CHIP data compare to those using a macro measure? Below we use estimates from macro-level government welfare expenditure data to supplement the results presented above. Before we do so, it is important to note a few important defects of the administrative data. First, the available administrative data mostly only include government expenditures but exclude employer-provided benefits, an important component that we are able to capture using the CHIP data. Second, the administrative data do not differentiate government welfare expenditures by urban and rural areas or for migrants. Therefore, we are only able to obtain a crude estimate of the size and structure of the Chinese welfare state as a whole, but not by subgroups. Third, as mentioned earlier, the administrative data do not help with the analysis of the redistributive effects of social benefits.
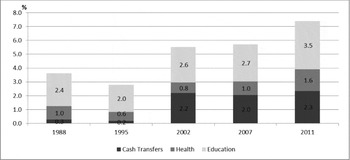
Figure 5 shows the trends in social welfare expenditures as a percentage of GDP in the four years covered by CHIP and in 2011, the latest year for which data are available. Only government expenditures on cash transfers (including pensions and social assistance), health and education are included. Housing and food benefits are not captured due to data unavailability. Overall, total government expenditure on cash transfers, health and education as a percentage of GDP has been increasing since 1995, reaching 5.7 per cent by 2007 and 7.4 per cent by 2011. Among the three categories, cash transfers had significant increases from only 0.3 per cent in 1988 to 2.3 per cent in 2011, mirroring the similar trend revealed by CHIP data in Figure 3 (as cash transfers were mostly available only in urban China). Health expenditures also increased, reaching 1.6 per cent in 2011, echoing the similar trend shown in Figure 3 (as noted earlier, CHIP data in 2007 did not fully capture the health benefits). Education, a benefit that we are unable to analyse using CHIP data, was the largest of the three expenditures and saw a steady increase over the years, reaching 3.5 per cent of GDP in 2011. Unfortunately, the two main in-kind benefits – housing and food – that dominated the declining trend of urban social benefits from 1988 to 2007 as shown using CHIP data are unavailable for analysis using administrative data. If the data were available, we suspect that the results would be consistent with the policy changes during this period and very similar to those based on CHIP data.
Shares of government social welfare expenditure in GDP
Source: Authors’ calculations using official statistics from National Bureau of Statistics [NBS] (various years).

Impact on income inequality
How big is the impact of the Chinese welfare state on income inequality? We investigate whether and to what extent the income redistribution through social benefit transfers has raised or reduced the overall income inequality by comparing the pre- and post-transfer Gini coefficients. The greater the reduction in the Gini coefficients due to the social benefit transfers, the greater their redistributive effect.
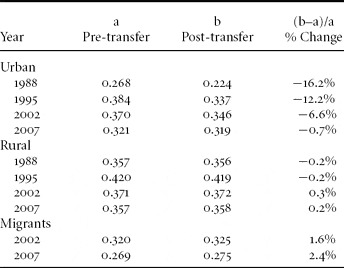
Table 2 presents the results on the impact of social benefits on income inequality as measured by the Gini coefficient.Footnote 1 Overall, urban social benefit transfers helped reduce income inequality through the period 1988 to 2007. However, their impact kept declining over time. Rural social benefits had only negligible effects, turning from slightly reducing income inequality in 1988 and 1995 to slightly increasing it in 2002 and 2007. Social benefits for migrants raised income inequality in both 2002 and 2007, though to a small extent.
Impact of social benefit transfers on income inequality as measured by the Gini coefficient

Source: Authors’ calculations using CHIP data.
Specifically, in 1988, urban social benefits reduced the overall income inequality as measured by the Gini coefficient from 0.268 to 0.224, a reduction of 16 per cent. However, urban social benefits reduced the overall income inequality by 12 per cent in 1995, 7 per cent in 2002 and only 0.7 per cent in 2007, suggesting that the equalising role of urban social benefits kept declining during this period and reached a minimal level by 2007. Rural social benefits were only able to have little impact on the overall income inequality given their small size. Rural social benefits reduced income inequality by 0.2 per cent in 1988 and 1995, but raised income inequality by 0.3 per cent in 2002 and 0.2 per cent in 2007. For migrants, social benefits actually helped raise the income inequality levels in both 2002 and 2007, and the increase was greater in 2007 (2.4 per cent) than in 2002 (1.6 per cent), indicating that social benefits for migrants were distributed more unevenly than pre-transfer income itself. Indeed, the majority of social benefits for migrants were food and housing provided by their work units, especially in 2007. These benefits were more likely to go to those with better jobs than their less advantaged peers, therefore further skewing the income distribution among the migrants.
Progressivity (or regressivity)
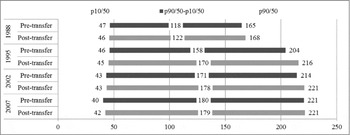
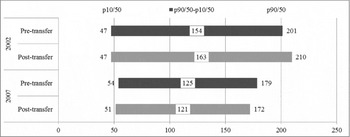
Across the developed and developing worlds, social benefits are one of a nation's primary mechanisms for redistribution of resources and achieving social justice. What is the redistributive nature of the Chinese welfare state? Is it regressive (i.e., favoring the rich) or progressive (i.e., favoring the poor)? We compare the economic distances at the bottom and the top of the income distribution between pre- and post-transfer incomes to address this question. We estimate the economic distances between households at three different points (10th, 50th and 90th percentiles) of the income distribution, representing the poor, the median and the rich households in the society respectively. Specifically, the economic distance between the bottom- and middle-income households will be captured by the P10/P50 ratio, with the P90/P50 ratio reflecting the economic distance between the top- and middle-income households. By comparing these two ratios, the income inequality gap between the bottom and the top of the distribution is revealed vividly (Gao, Reference Gao2010; Garfinkel et al., Reference Garfinkel, Rainwater and Smeeding2010). A progressive social benefit system implies that resources are reallocated from the rich to the poor, narrowing the economic distance between the rich and the poor. If the economic distance is enlarged at both ends, the social benefit system is clearly regressive. If social benefits reduce the economic distance at the bottom (indicating progressivity) but increase it at the top (indicating regressivity), the redistributive nature is ambivalent and the extent of progressivity or regressivity is determined by which of the two effects dominates.
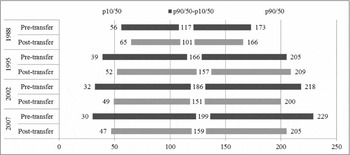
Figures 6–8 show the changes in the redistributive effects of social benefits for urban, rural and migrant populations respectively from 1988 to 2007. The length of the bars represents the economic distance between low- and high-income households, with the value of the P10/P50 ratio at the lower end and the value of the P90/P50 ratio at the higher end. For urban residents, social benefits shortened the economic distance between the poor and the rich and were progressive in all years. Furthermore, the reduction of the economic distance became greater over time, suggesting that urban social benefits have become even more progressive in recent years.
Impact of social benefits on economic distance between low- and high-income households in urban China (length of bars represents economic distance between low- and high-income households)
Source: Authors’ calculations using CHIP data.

Impact of social benefits on economic distance between low- and high-income households in rural China (length of bars represents economic distance between low- and high-income households)
Source: Authors’ calculations using CHIP data.

Impact of social benefits on economic distance between low- and high-income households for rural-to-urban migrants in China (length of bars represents economic distance between low- and high-income households)
Source: Authors’ calculations using CHIP data.

Rural social benefits were redistributed regressively from 1988 to 2002, as indicated by the elongated economic distance bars from pre- to post-transfer income, but they became slightly progressive in 2007 because the relative position of the poor was lifted slightly by the social benefits in that year. Social benefits for migrants followed the same trend as that for rural citizens. They were clearly distributed regressively in 2002, with the poor staying intact in their relative position in the overall income distribution and the rich gaining through social benefits. In 2007, social benefits were redistributed partly regressively and partly progressively: they lowered the relative income of the poor but also reduced the relative income of the rich. Because the decrease at the top was larger than that at the bottom, social benefits for migrants appeared to be more progressive than regressive in 2007.
Conclusion and discussion
Based on empirical evidence from the CHIP 1988–2007 data, this article analyses the size, structure and redistributive effect of the Chinese welfare state. We find that the Chinese welfare state is highly divided along urban–rural lines: the urban social benefit system, or the urban welfare state, stands among the more comprehensive and generous ones, similar to those in western industrialised countries, while the rural system is minimal and residual and similar to those in the least developed countries. The urban system has consistently reduced income inequality – albeit to a lesser extent in recent years – and has remained progressive over time. The rural system has had little impact on reducing income inequality and has been largely regressive. It is, however, moving toward a more progressive direction as indicated by the 2007 results. Social benefits for migrants saw significant increases between 2002 and 2007 and played an increasingly larger redistributive role – moving also in a more progressive direction.
While the urban–rural divide is admittedly not new and is indeed embedded in China's longstanding Hukou system, these results allow us to gain new insight into its scale and persistence. The large gaps in the provision, generosity and progressivity of social benefits between the two areas suggest that a more balanced and integrated Chinese welfare state is needed to diminish and ultimately eliminate the urban–rural divide. Recent policy changes suggest that China is taking action to move toward harmonising the urban and rural systems (Shi, Reference Shi2012). To address unequal social insurance coverage among its citizens and ensure social stability, the government has made efforts to broaden the coverage of several social insurance programmes. In rural China, agricultural taxes were eliminated nationwide in 2006, Dibao was implemented nationwide in 2007, and Rural Cooperative Medical Insurance was fully restored by the end of 2008. The government also began piloting a rural pensions programme in 2009, which was expanded to cover 40 per cent of all counties by 2011 (Gao, Reference Gao2010; Lardy, Reference Lardy2012). To broaden the social insurance coverage for migrant workers, the 2008 Labour Contract Law stipulated that employers must sign labour contracts with migrant workers and provide social insurance coverage for this group, yielding a significant increase in the social insurance participation rate for the migrant workers (Gao et al., Reference Gao, Yang and Li2012). In urban China, the number of workers covered by various social insurance programs – including pensions, medical insurance, unemployment insurance, workers’ compensation and maternity insurance – witnessed significant increases between 2004 and 2010. In 2007, a pilot programme was unveiled to provide basic health insurance to those working in the informal sector, including migrant workers. This programme was expanded nationwide by 2010, covering 195 million urban workers (Lardy, Reference Lardy2012).
Moving forward, balancing and integrating the divided worlds within China remain the biggest challenge for the Chinese welfare state. A move from fragmentation to integration can be observed in the history of many other welfare states. While the urban–rural divide in China is uniquely pronounced, we are cautiously optimistic that this obstacle will be overcome and China will be on the road to becoming a modern welfare state. As suggested by the international historical analysis (Garfinkel et al., Reference Garfinkel, Rainwater and Smeeding2010; Lindert, Reference Lindert2004), three important political and demographic trends – democratisation, urbanisation and population ageing – are likely to drive China into becoming a more integrated, generous and progressive welfare state. Though still under authoritarian rule, China is facing serious pressure to become more democratic. Democracy promotes welfare states, as citizens – especially those more disadvantaged – gain increasingly larger forums to express their concerns, demand equal rights and claim their social citizenship (Shi, Reference Shi2012). The Chinese government is also moving to fundamentally reform the Hukou system in order to gradually dismantle the institutional basis for this urban–rural division. The new Premier Li Keqiang has indicated that urbanisation will be the main driver for China's future economic growth, with reforming the Hukou system the essential step toward facilitating this urbanisation (Xinhua News Agency, 2012). Lastly, with a rapid population ageing trend, old age insurance in both urban and rural China will have to expand further, especially to the currently under-insured rural citizens and migrants, becoming the most important component of the Chinese welfare state to trump the urban–rural divide.
Acknowledgements
We are grateful for helpful comments from Shuqiang Chen, Enid O. Cox, Irwin Garfinkel, Yeun-Wen Ku, Stein Ringen, Tony Saich, Dorothy J. Solinger, Feng Wang, Tianfu Wang, Christine Wong, Fuhua Zhai, Jian Zhang, the editors, anonymous reviewers, participants of the Social Welfare Development and Governance Transformation in East Asia International Workshop co-sponsored by the Harvard–Yenching Institute and Central China Normal University and held on 17–18 May 2012 in Wuhan, China and participants of a seminar held at the Tsinghua–Brookings Institution on 30 May 2012, in Beijing, China. We thank the Chiang Ching-Kuo Foundation for International Scholarly Exchange for awarding Gao a Scholar Grant to work on this research. We acknowledge the Asian Development Bank, the Australian government (Australian Research Council and AusAID), the Ford Foundation, Institute for the Study of Labor (IZA) and the Swedish International Development Agency who funded the surveys that provided the data for this research.