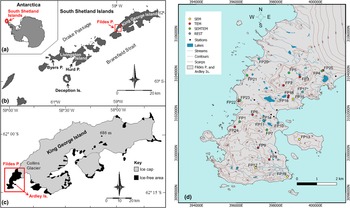
In the northern Antarctic Peninsula region, periglacial, fluvial and pedogenic processes are predominant in ice-free areas that are not covered permanently with ice (López-Martínez et al., Reference López-Martínez, Serrano, Schmid, Mink and Linés2012). These ice-free areas occur mainly along the coastal regions and are particularly interesting in terms of their terrestrial biodiversity of flora and fauna (Lee et al., Reference Lee, Raymond, Bracegirdle, Chadès, Fuller, Shaw and Terauds2017), but these are also susceptible to human activities deriving from nearby research stations. This study was conducted in Fildes Peninsula, which covers an area of >30 km2, making it the third largest ice-free area within the South Shetland Islands. Only Byers Peninsula on Livingston Island and Deception Island are larger (Fig. 1).
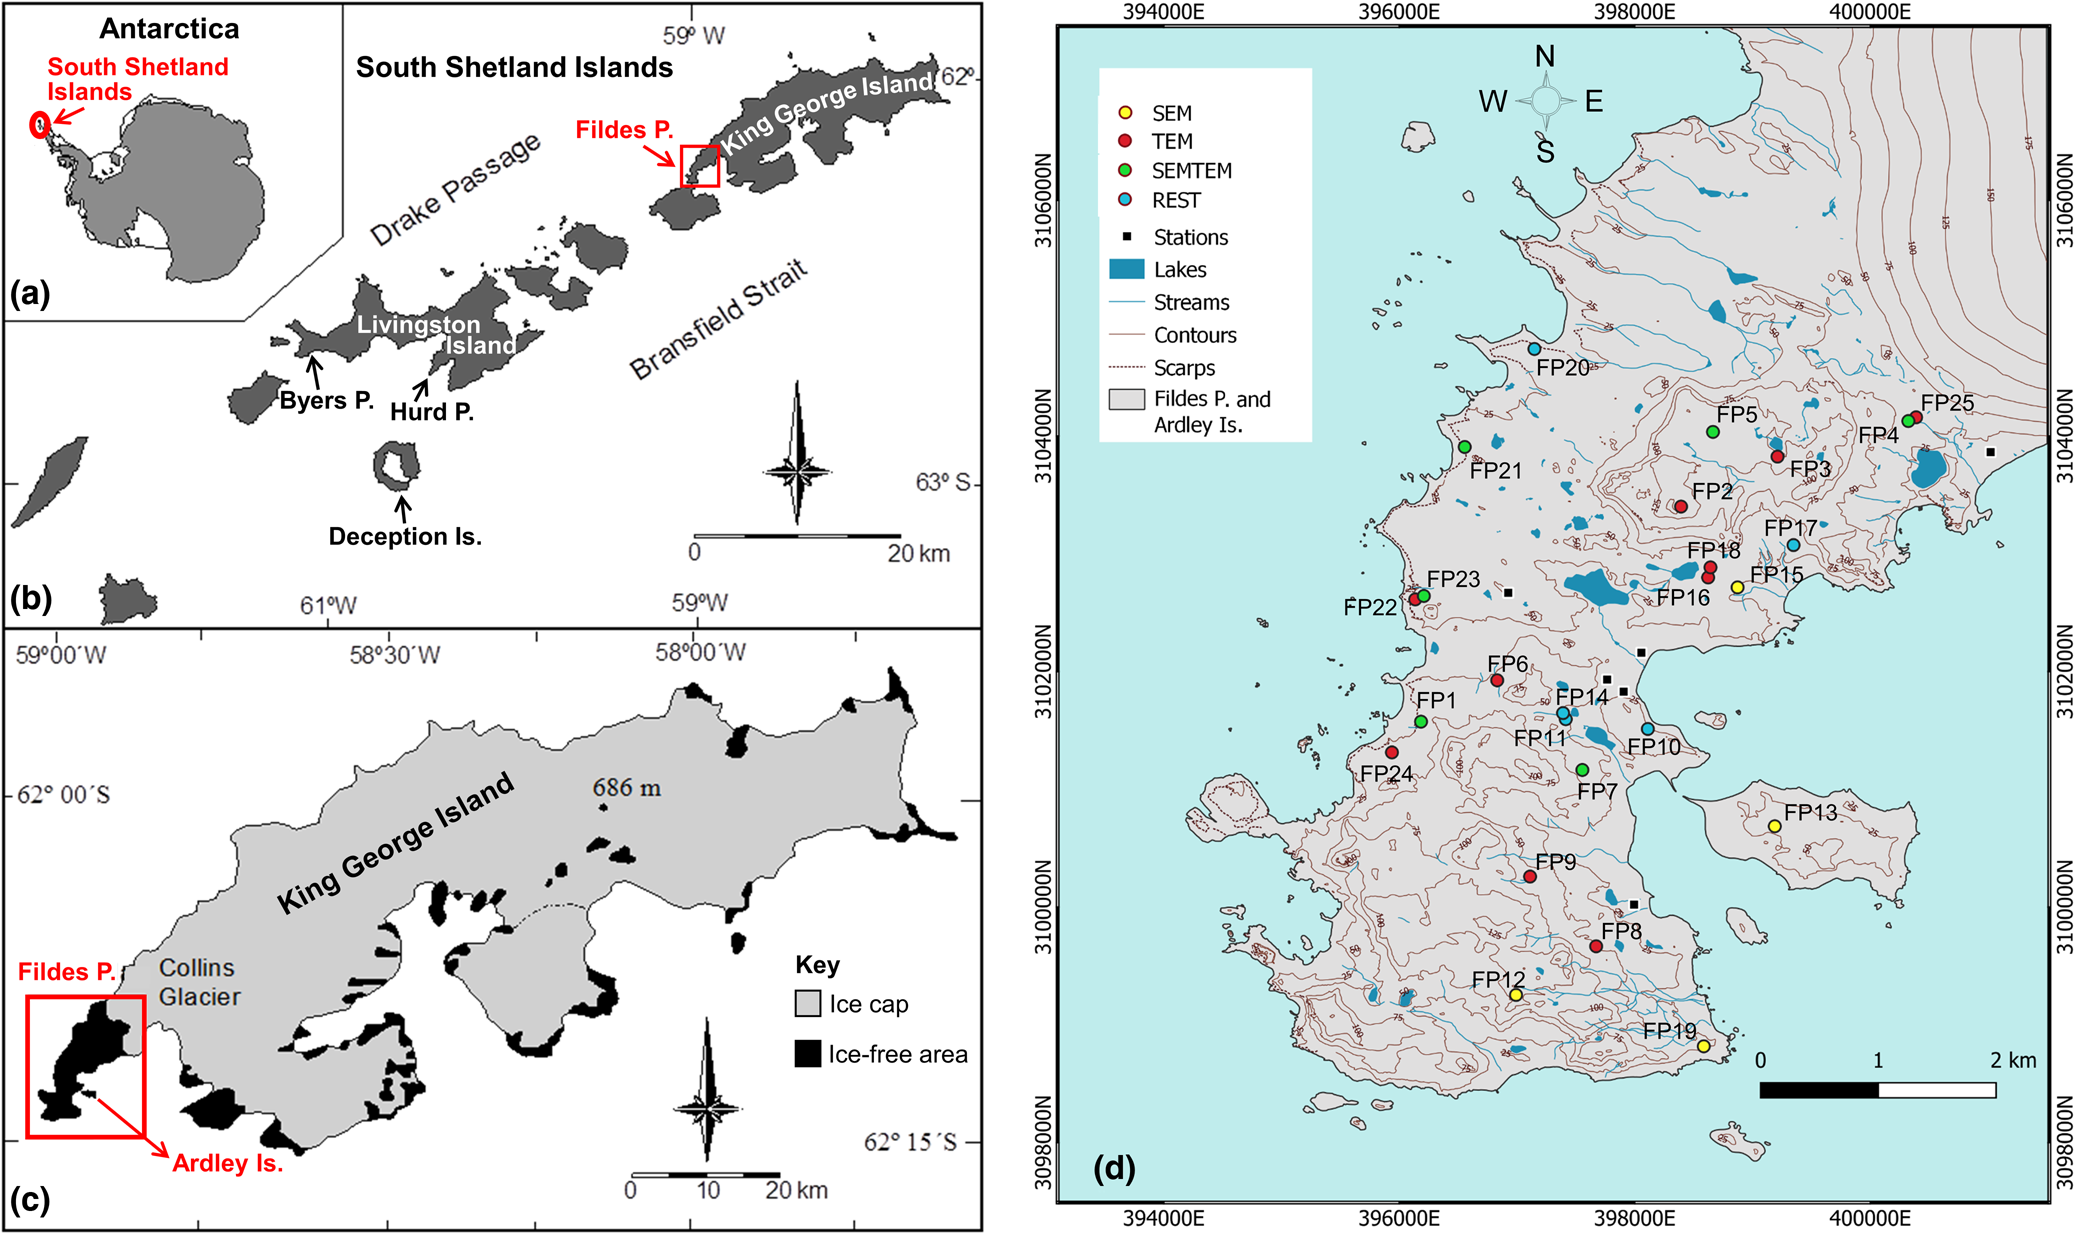
Location of the study area in (a) Antarctica within (b) the South Shetland Islands, on (c) the south-western end of King George Island. (d) Soil sample distribution on Fildes Peninsula (based on maps from IGM & INACH, 1996). Samples were analysed using SEM, TEM or both (SEMTEM); other samples were not studied with either SEM or TEM (REST). Is. = Island; P. = Peninsula.
These ice-free areas, particularly in the South Shetland Islands, are characterized by a Maritime Antarctic climate. The region has seen the greatest warming trends recorded in Antarctica over the past 60 years (Turner et al., Reference Turner, Barrand, Bracegirdle, Convey, Hodgson and Jarvis2014), with a mean annual air temperature of –2.2°C and precipitation ranging between 350 and 1000 mm year–1 (Simas et al., Reference Simas, Schaefer, Michel, Francelino, Bockheim and Bockheim2015). The mean summer air temperature is 1.2°C (Oliva, Reference Oliva, Navarro, Hrbáček, Hernández, Nývlt and Pereira2017) and is >0°C for up to 4 months, which means that water will be available for biological activity, chemical and physical weathering and hydrological and geomorphological processes (Michel et al., Reference Michel, Schaefer, López-Martínez, Simas, Haus, Serrano and Bockheim2014a; Simas et al., Reference Simas, Schaefer, Michel, Francelino, Bockheim and Bockheim2015). A predominance of summer temperatures above freezing within the Maritime Antarctic region, with frequent freeze–thaw cycles, produces cryoclastic weathering and cryoturbation in these ice-free areas (Navas et al., Reference Navas, López-Martínez, Casas, Machín, Durán and Serrano2008; Balks et al., Reference Balks, López-Martínez, Goryachkin, Mergelov, Schaefer and Simas2013). The presence of permafrost is related closely to the distribution of periglacial features and is mainly discontinuous in the South Shetland Islands within the altitudinal range of 25–150 m above sea level (a.s.l.; Bockheim et al., Reference Bockheim, Vieira, Ramos, López-Martínez, Serrano and Guglielmin2013). Together with the parent material and soil biological processes, the distribution of permafrost affects soil development and results in great pedodiversity (Simas et al., Reference Simas, Schaefer, Michel, Francelino, Bockheim and Bockheim2015).
Summer temperatures being frequently above freezing, abundant soil water availability, the presence of bird colonies and the corresponding increase in soil microbial activity are more favourable to soil development than in Continental Antarctic areas, and this is reflected in the mineralogy of the clays present (Michel et al., Reference Michel, Schaefer, Simas, Francelino, Fernandes-Filho, Lyra and Bockheim2014b). The South Shetland Islands are among the areas with the greatest precipitation in Antarctica, generally >600 mm year–1 (Bockheim, Reference Bockheim and Bockheim2015). Glacier retreat due to climate change has increased the extension of ice-free areas in the region and has led to the development of paraglacial environments (Ruiz-Fernández et al., Reference Ruiz-Fernandez, Oliva, Nyvlt, Cannone, Garcia-Hernandez and Guglielmin2019). Temporal gradients of soil development formed by glacier retreat can be observed where plant succession and soil development are increasing (Boy et al., Reference Boy, Godoy, Shibistova, Boy, McCulloch and de la Fuente2016). A key factor in the development of these soils is the stability of surfaces to allow sufficiently long periods for significant clay neoformation. The ice-free areas of the South Shetland Islands have been occupied by glaciers until relativelly recently (Hall, Reference Hall2007). In the case of Fildes Peninsula and Ardley Island (Fig. 1), the last deglaciation due to the retreat of the Collins glacial dome occurred between 8000 and 5000 years before present (BP; Mäusbacher et al., Reference Mäusbacher, Muller, Munnich and Schmidt1989), and the deglaciation of local domes culminated between 6000 and 4000 years BP (Watcham et al., Reference Watcham, Bentley, Hodgson, Roberts, Fretwell and Lloyd2011). Therefore, this reduced time of exposure of the rock since the deglaciation and the constant reworking and erosion of the landscape due to glacier oscillations and periglacial processes have inhibited soil formation in many parts of Fildes Peninsula (Michel et al., Reference Michel, Schaefer, López-Martínez, Simas, Haus, Serrano and Bockheim2014a).
The ice-free areas in Maritime Antarctica have been the subject of numerous pedological studies focused on the characterization, genesis and classification of soils (e.g. Campbell & Claridge, Reference Campbell and Claridge1987; Tatur, Reference Tatur1989; Ye & Tianjie, Reference Ye and Tianjie1996; Jie et al., Reference Jie, Zitong and Blume2000; Michel et al., Reference Michel, Schaefer, Dias, Simas, Benites and Mendonça2006; Simas et al., Reference Simas, Schaefer, de Melo, Albuquerque-Filho, Michel and Pereira2007; Zhu et al., Reference Zhu, Sun, Liu, Gong and Sun2011). A soil geomorphological map at 1:10,000 scale of Fildes Peninsula and Ardley Island has been compiled with a total of 130 sampled pedons (Lupachev et al., Reference Lupachev, Abakumov, Goryachkin and Veremeeva2020).
Early studies on weathering in Antactica demonstrated the mineral alteration processes in soils (Ugolini & Anderson, Reference Ugolini and Anderson1973; Ugolini, Reference Ugolini1976). Research on clay mineralogy in Maritime Antarctica is scarce and relatively new in comparison to other studies on soils in the region which have focused mainly on weathering patterns and the possible origins of these minerals (Jeong & Yoon, Reference Jeong and Yoon2001; Lee et al., Reference Lee, Lim and Yoon2004; Simas et al., Reference Simas, Schaeffer, Melo, Guerra, Saunders and Gilkes2006; Mendonça et al., Reference Mendonça, Melo, Schaefer, Simas and Michel2013; Spinola et al., Reference Spinola, Pi-Puig, Solleiro-Rebolledo, Egli, Sudo, Sedov and Kühn2017).
Previous studies suggest that the clay minerals of King George Island's soils formed mainly via two separate mechanisms: (1) through physical weathering of rocks and increases of fine material via particle-size reduction due to freeze–thaw cycles; and (2) through palaeohydrothermal alteration of volcanic rocks (Park, Reference Park1990; Jie et al., Reference Jie, Zitong and Blume2000; Jeong & Yoon, Reference Jeong and Yoon2001). Other authors have pointed out that chemical weathering is also an important process in these types of soils, in particular for forming clay minerals such as kaolinite and hydroxy-interlayered smectite (Tatur & Barczuk, Reference Tatur, Barczuk, Siegfried, Condy and Laws1985; Tatur, Reference Tatur1989; Blume et al., Reference Blume, Beyer, Kalk, Kuhn, Beyer and Bölters2002, Reference Blume, Chen, Kalk, Kuhn and Kimble2004; Simas et al., Reference Simas, Schaeffer, Melo, Guerra, Saunders and Gilkes2006; Mendonça et al., Reference Mendonça, Melo, Schaefer, Simas and Michel2013).
The objective of this work was to characterize the clay minerals in soils from Fildes Peninsula and Ardley Island and relate them to periglacial and paraglacial processes that can be used as indicators of initial pedogenic processes. The soils considered in this work are representative of various landforms such as patterned ground, stone fields, slope debris and till deposits on valley floors, elevated platforms and hillslopes. These landforms are subjected predominantly to periglacial and glacial processes and are affected by permafrost. This work focuses on the determination of soil clay mineralogy, including textural, mineralogical and crystallochemical analysis, along with the determination of the physical and chemical soil properties and field morphological data. In particular, the presence and distribution of smectite are considered as indicators of soil-forming processes at an initial stage.
Study area
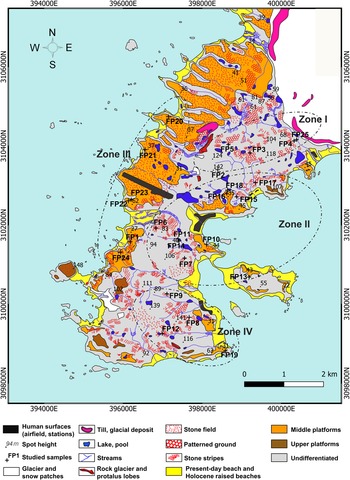
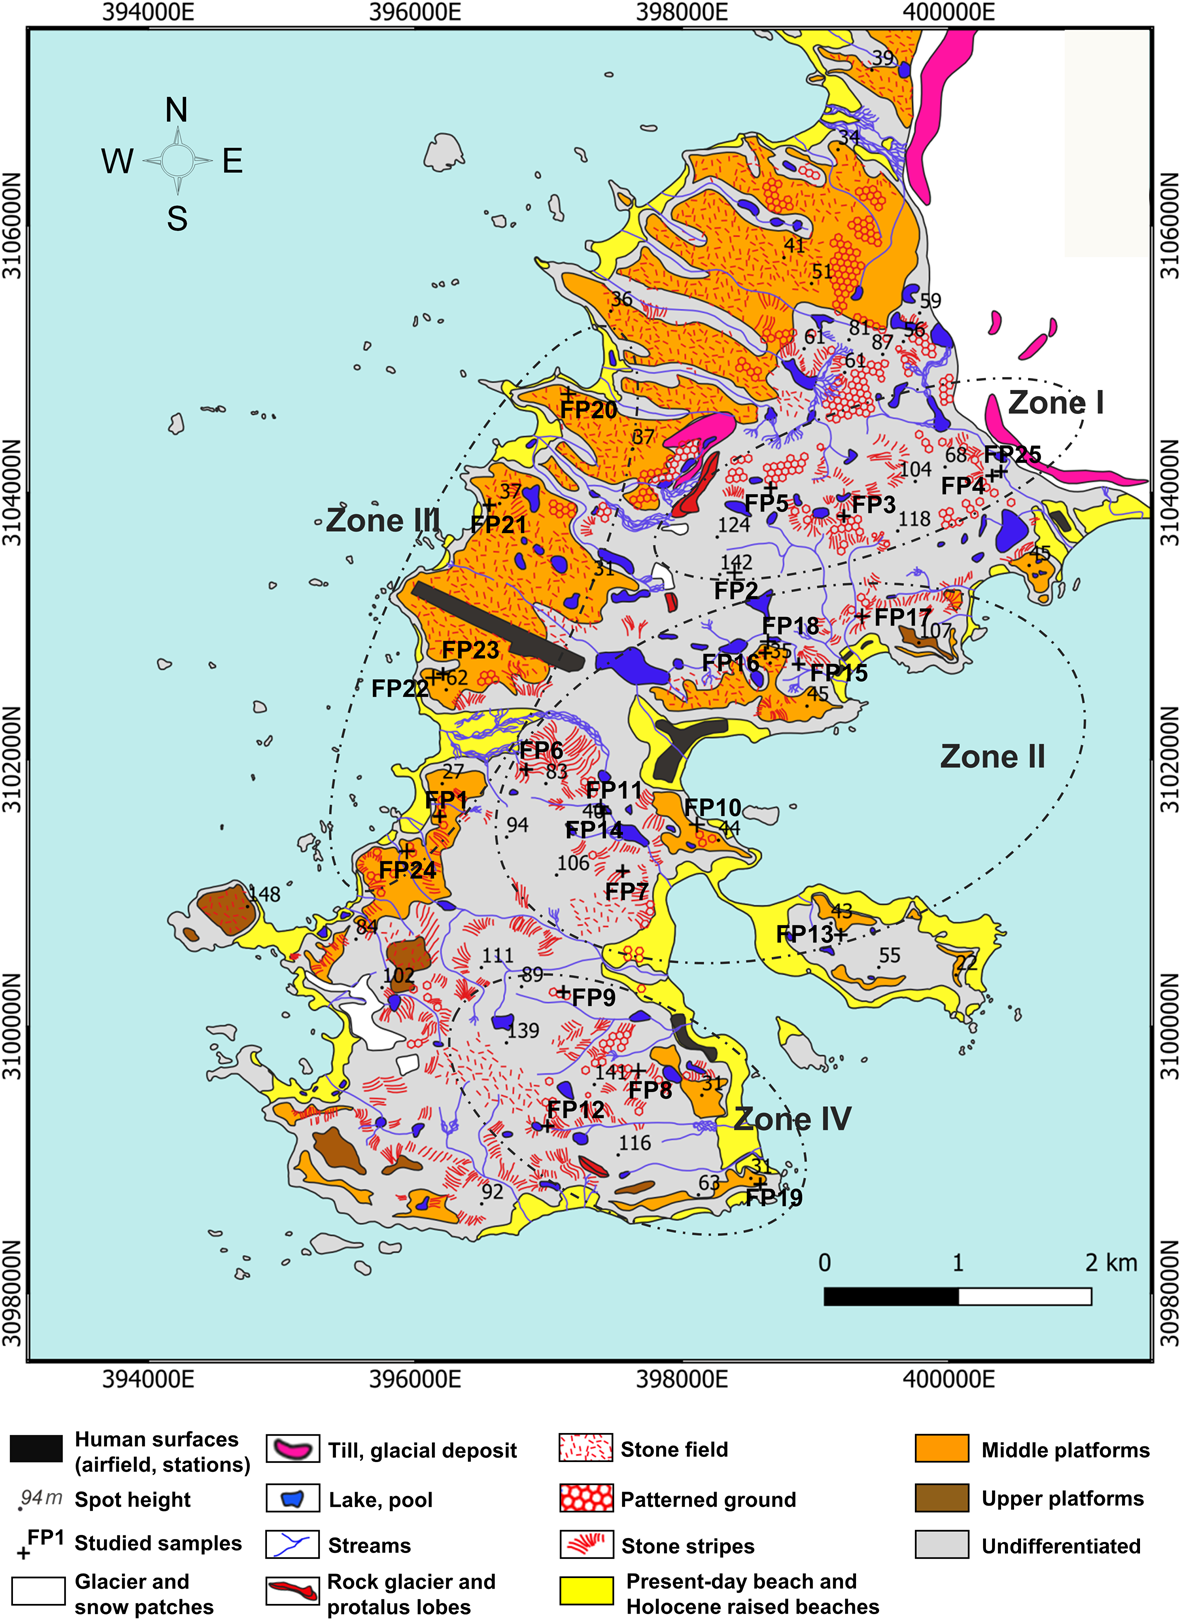
Fildes Peninsula and Ardley Island are located at the south-western end of King George Island (~62°11´S and 58°58´W) in the South Shetland Islands, northern Antarctica Peninsula region (Fig. 1a,b). Ardley Island is ~400 m to the south-east of Fildes Peninsula (Fig. 1c,d). Jointly, they constitute the most extensive ice-free area on King George Island, at ~30 km2, limited by the Collins Glacier to the north-north-east (Fig. 1c). Fildes Peninsula (Fig. 1d), with five scientific stations and one airport operational all year round, has, perhaps, the largest number of personnel present in the region every year. There are two elevated areas located in the central long axis of the peninsula at 142 and 141 m a.s.l., situated to the north (within zone I) and to the south (within zone IV), respectively, and a central depression area (Fig. 2).
Locations of the studied samples and of the four zones described in the paper marked on the geomorphological map of Fildes Peninsula and Ardley Island (modified from Serrano & López-Martínez, Reference Serrano and López-Martínez2012).
The climate of Fildes Peninsula is described as cold maritime, approximating the tundra climate according to the Köppen (Reference Köppen1936) classification, with daily summer temperatures frequently >0°C (Rakusa-Suszczewski, Reference Rakusa-Suszczewski, Beyer and Bölter2002). During the summer, the total snow cover melts, and there are ~122 potential freeze–thaw cycles during this period (Rakusa-Suszczewski, Reference Rakusa-Suszczewski, Beyer and Bölter2002). Precipitation of 350–1000 mm year–1, with rainfall during the summer period, high relative air humidity (80–90%) and melting of the winter snow, implies high water availability to soils and sediments in the summer (Michel et al., Reference Michel, Schaefer, López-Martínez, Simas, Haus, Serrano and Bockheim2014a).
Fildes Peninsula is occupied mainly by Palaeocene–Eocene basaltic and andesitic–basaltic rocks with volcaniclastic intercalations (Birkenmajer et al., Reference Birkenmajer, Narebski, Nicolleti and Petrucciani1983; Pankhurst & Smellie Reference Pankhurst and Smellie1983; Soliani et al., Reference Soliani, Kawashita, Fensterseifer, Hansen and Troian1988). Most soils have been developed on the mentioned andesitic basalts and basaltic rocks and less so on volcanoclastic rocks and fluvioglacial sediments (Michel et al., Reference Michel, Schaefer, Dias, Simas, Benites and Mendonça2006; Machado et al., Reference Machado, de Lima, Chemale, Alexandre, Sommer, Figueiredo and de Almeida2008).
The main geomorphological features on Fildes Peninsula and Ardley Island (Fig. 2) are periglacial (patterned ground, stone fields, stone stripes, rock glaciers and protalus lobes), glacial (moraines, till) and coastal (present-day beaches and Holocene raised beaches; Serrano & López-Martínez, Reference Serrano and López-Martínez2012). Periglacial processes are dominant in the elevated areas above ~25 m a.s.l. and diminish towards the lowland areas and beaches of the peninsula. Permafrost is sporadic or absent below 25 m a.s.l. and is discontinuous up to 150 m a.s.l. (López-Martínez et al., Reference López-Martínez, Serrano, Schmid, Mink and Linés2012; Bockheim et al., Reference Bockheim, Vieira, Ramos, López-Martínez, Serrano and Guglielmin2013).
The terrestrial vegetation is widespread and adapted to the relief, where sheltered areas give greater protection and where there is soil moisture, as well as nutrient input from litter and possibly from animal excrements. There are areas covered densely with moss carpets and lichens. The peninsula area contains ~175 lichen species, mainly Usnea antarctica and Usnea aurantiaco, and 40 moss species, with Polytrichastrum alpinum, Brachythecium and Sanionia sp. being the most abundant (Peter et al., Reference Peter, Buesser, Mustafa and Pfeiffer2008). The only Antarctic vascular plants – Antarctic hair grass (Deschampsia antarctica) and Antarctic pearlwort (Colobanthus quitensis) – are present (Peter et al., Reference Peter, Buesser, Mustafa and Pfeiffer2008).
Large areas of Fildes Peninsula contain poorly developed shallow soils at <20 cm thick, composed of a top A horizon and underlying C and CR horizons. The soils manifest their parent rock clearly, as well as the paraglacial and periglacial processes that contributed to their development. Conditions for soil formation are more favourable during the short austral summer when temperatures oscillate at ~0°C and frequent freeze–thaw cycles increase alteration of rocks and fine-grained material. Soils influenced by the presence of permafrost are known commonly as Cryosols or Gelisols according to the World Reference Base for Soil Resources (WRB) and US Soil Taxonomy Classification Systems, respectively (Michel et al., Reference Michel, Schaefer, Poelking, Simas, Fernandes Filho and Bockheim2012, Reference Michel, Schaefer, Simas, Francelino, Fernandes-Filho, Lyra and Bockheim2014b). Soils without permafrost influence were identified as Leptosols/Entisols, Arenosols/Entisols, Gleysols/Gelaquents and Cambisols/Inceptisols according to the same classification systems (Michel et al., Reference Michel, Schaefer, López-Martínez, Simas, Haus, Serrano and Bockheim2014a).
Materials and methods
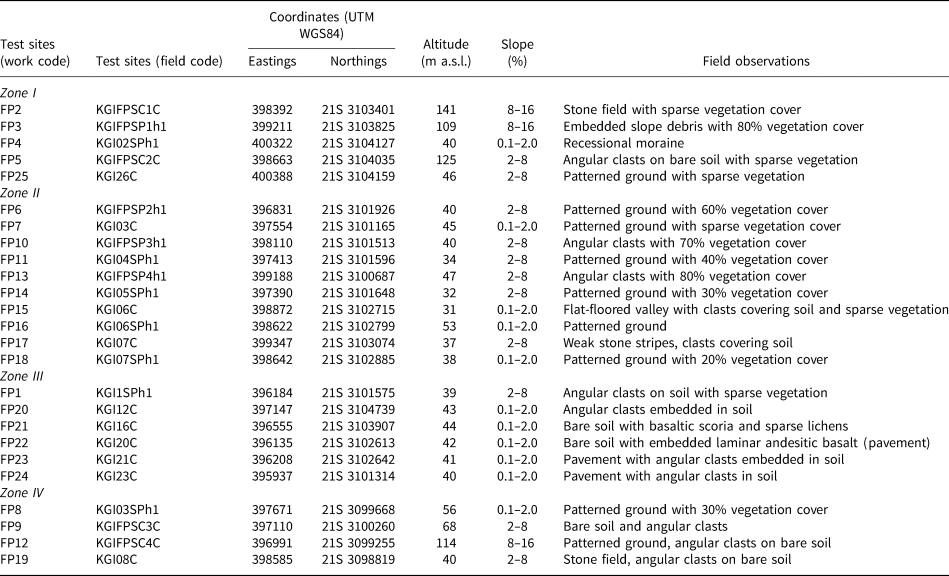
A total of 25 samples were collected from soil surface horizons throughout Fildes Peninsula during the 2012/2013 and 2016/2017 field campaigns (Fig. 1). The sampling sites were situated in the ice-free region from the more recently exposed areas that are closest to the Collins Glacier and from areas that have been ice-free over a longer time at a greater distance from the Glacier, as described by Boy et al. (Reference Boy, Godoy, Shibistova, Boy, McCulloch and de la Fuente2016). The sites represent various surface-cover types according to fieldwork observations. They are located at altitudes of 10–141 m a.s.l. and occur on flat terrain and slopes of between 8 and 16% (Table 1). The majority of the sites are covered with both moss and lichens. The soil covers are represented by the following geomorphological features: periglacial and nival landforms and deposits such as patterned ground, stone stripes, stone fields and slope debris; marine landforms and deposits such as upper and middle platforms; and Holocene raised beaches (Fig. 2; Serrano & López-Martínez, Reference Serrano and López-Martínez2012). Detailed field observations and descriptions identified the surface cover at each site, the location and altitude were registered using a GPS device and the slope was estimated using topographical maps.
Geographical coordinates, altitude and general description of the studied soil samples from Fildes Peninsula.
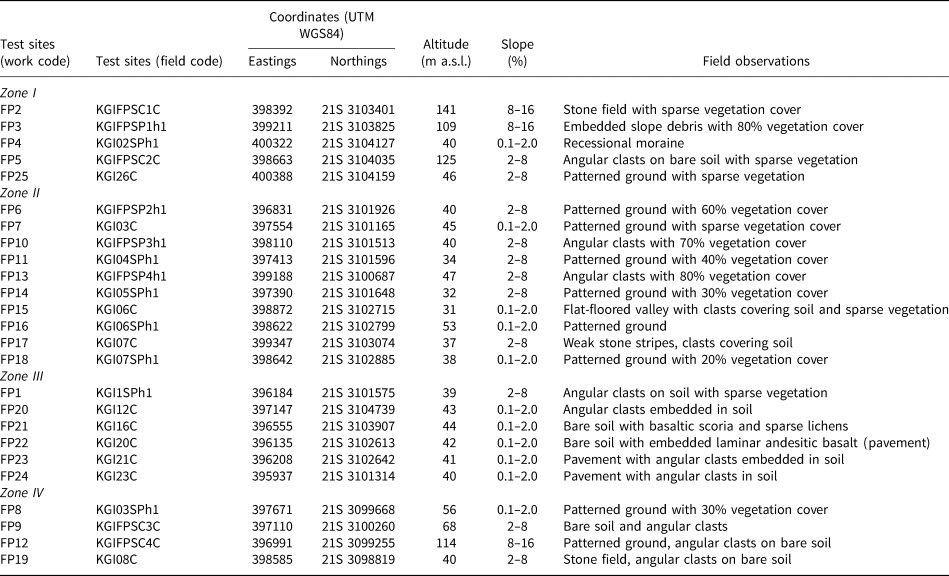
The samples have been grouped into four zones (Fig. 2) as follows: Zone I includes samples FP2, FP3 and FP5 on the Northern Meseta (at altitudes of 109–141 m a.s.l.) and FP4 and FP25 in the vicinity of the Collins Glacier front (at altitudes of 40–46 m a.s.l.). The rocks are mainly agglomerates and volcaniclastics interbedded with basalt and basaltic andesite lavas (Smellie et al., Reference Smellie, Pankhurst, Thomson and Davies1984). In this zone, moraine deposits are well preserved and adjoining areas are influenced by periglacial features and paraglacial till deposits. Soils have been developed in areas occupied by stone fields, slope debris, patterned ground and recesional moraine at the northermost part of the peninsula.
Zone II covers a wide area in the central part and east coast of Fildes Peninsula, where samples FP6, FP7, FP11, FP13, FP14, FP15, FP17 and FP18 are on undifferentiated material and samples FP10 and FP16 are on middle marine platforms at altitudes of 10–53 m a.s.l. The zone shows a variety of lithological, geomorphological and topographical characteristics that influence soil development. The rocks are mainly basaltic andesite, lapillistone and tuffs and volcaniclastic rocks to the north-east (Smellie et al., Reference Smellie, Pankhurst, Thomson and Davies1984).
Zone III lies on the west coast of Fildes Peninsula, where samples FP1, FP20, FP21, FP22, FP23 and FP24 are situated at ~40 m a.s.l. on the middle platforms and on basaltic and andesitic basaltic rocks. In this case, the initial glacier retreat left exposed areas that were influenced by coastal processes, which were overtaken by isostatic processes, causing an overall uplift of the terrain (Fretwell et al., Reference Fretwell, Hodgson, Watcham, Bentley and Roberts2010).
Zone IV is situated to the south of Fildes Peninsula, where samples lie furthest from the Collins Glacier front. The ice-free area is therefore older than in the other zones. Sample FP9 came from soils over patterned ground. Samples FP8 and FP12 are the most southern samples from undifferentiated and patterned ground surfaces, respectively. Sample FP12 is from 114 m a.s.l. within the Southern Meseta. Sample FP19 was found within a stone field with angular clasts. The rocks are porphyritic basalt and basaltic andesite with local deposits of coarse conglomerate in beds (Smellie et al., Reference Smellie, Pankhurst, Thomson and Davies1984).
Samples of ~1 kg each were collected from the top A horizon. The sampling depth depended on the depth of the A horizon and how clearly defined it was. Each sample represents a single collection point. The samples were placed in plastic bags, kept at a constant temperature (4°C) and transported to the laboratory, where they were air dried and sieved to a fine earth fraction (<2 mm) according to usual soil-preparation practice (Soil Survey Staff, Reference Staff2014).
The physical and chemical soil analyses were carried out as follows:
(1) pH: determined in a 1:2.5 ratio where 10 g of sieved soil of <2 mm was added to 25 mL of distilled water. Two separate soil suspensions were prepared that were placed in a reciprocating shaker (Stuart SSL2) set for 1 h at 180 strokes min–1. Thereafter, the suspension was stirred and a pH electrode connected to a pH meter (HACH Sension+™ pH3) was inserted into the stirred soil suspension and the pH was recorded (Rowell, Reference Rowell1994). An average pH value was obtained from the measurements of the two separate suspensions. The quantification limits were 0–14 pH and with an absolute uncertainty of ± 0.2 pH units.
(2) Electrical conductivity (EC): using the above soil suspensions prepared for the pH measurements, another 25 mL of distilled water was added to each of the two preparations to obtain a 1:5 soil:water ratio. The suspensions were shaken by hand (10 times). Once the suspension was settled, an EC electrode connected to a conductivity meter (HACH Sension+ EC7) was inserted into the suspension without disturbing the sediment (FAO, 2021). An average EC (μS cm–1) value was obtained from the two readings at 25°C from the measurements of the separate suspensions. The quantification limit was 0.01 μS cm–1 to 12 mS cm–1, with an absolute uncertainty of ±0.02 μS cm–1.
(3) Soil organic matter (SOM) content: obtained by multiplying the soil organic carbon (SOC) by 1.724 (Allison, Reference Allison and Black1965), which was determined via wet acid oxidation and applying a recovery factor of 1 (Walkley & Black, Reference Walkley and Black1934). The quantification limit is 0.02% w/w with an absolute uncertainty of ±0.01% w/w. A 2 g sample of sieved soil (<2 mm) was weighed and deposited in a 250 cc flask. Then, 20 mL of concentrated sulfuric acid (H2SO4) followed by 10 mL of 1 N potassium dichromate (K2Cr2O7) were added and stirred slowly. Thereafter, the solution was allowed to stand for 30 min to complete oxidation of the organic matter. The mixture was then diluted to 200 mL with distilled water and the oxidation was stopped by adding 10 mL of phosphoric acid (H3PO4). Titration was carried out using a compact titrator (Metrohm 916 Ti-Touch) that was connected to a dosing unit (Metrohm 800 Dosino) containing Möhr's salt (Fe(NH4)2(SO4)2(H2O)6) to determine the amount of organic carbon in a given sample.
(4) Calcium carbonate (CaCO3) content: determined using the Bernard calcimeter method (Page et al., Reference Page, Miller and Heeney1987). A sieved sample (<2 mm) of 1 g was introduced into a conical flask. A glass tube containing 10 mL of 4 N HCl solution was introduced into the conical flask whilst avoiding contact between solution and sample. The conical flask was then capped with a rubber plug connected to the graduated column and tube so that the fluid levels were set at 0 cm3. Then, the conical flask was shaken gently so that the HCl solution came into contact with the soil sample. The liberated CO2 entered the graduated column, displacing the filling solution. The final CO2 volume was recorded. The quantification limit was 0.2% w/w, with an absolute uncertainty of ±0.1% w/w.
(5) Extractable or free iron oxide (Fe2O3CD) content: determined using the citrate/dithionite method (Holmgren, Reference Holmgren1967). Fine soil fractions (<2 mm) were ground to <0.5 mm, and 0.5 g of sample for each soil analysis was added into a 60 mL plastic bottle. A total of 30 ml of citrate/dithionite reagent was added to each sample bottle and to a control bottle without soil sample for calibration purposes. The bottles were placed in a reciprocating shaker (Stuart SSL2) for 16 h at 180 strokes min–1. Thereafter, the suspensions were centrifuged at 9000 rpm. The clear supernatants were decanted into 15 mL volumetric Falcon™ tubes and the solutions were analysed via atomic absorption spectroscopy (AAS; Perkin Elmer Analyst 700). The quantification limit was 0.003% w/w, with an absolute uncertainty of ±0.16% w/w.
(6) Cation-exchange capacity (CEC) of soil: determined using 4 g of soil sample (<2 mm) that was placed in a centrifuge tube and then 33 mL of 1.0 N NaOAc solution was added. The tube was placed in a reciprocating shaker (Stuart SSL2) set for 5 min at 180 strokes min–1 and centrifuged for 5 min at 9000 rpm until the supernatant liquid was clear. The liquid was decanted and the procedure was repeated three more times. Subsequently, 33 mL of 99% ethanol was added to the soil sample in the tube and placed again for 5 min in the shaker and centrifuged until the supernatant liquid was clear. The liquid was decanted and the procedure was repeated two more times. Then, 33 mL of 1 N NH4OAc solution was added to the tube, which was placed in the mechanical shaker for 5 min and centrifuged until the supernatant liquid was clear. The washing liquid was decanted into a 100 mL volumetric flask and the procedure was repeated two more times. The combined washing liquid was diluted to the 100 mL mark with NH4OAc solution and the sodium concentration was determined using AAS (Perkin Elmer Analyst 700; US Environmental Protection Agency, 1986). The quantification limit was 0.02 cmol kg–1, with an absolute uncertainty of ±0.02 cmol kg–1.
(7) Soil texture: determined using the Bouyoucos method (AENOR, 1995). A total of 50 g of soil (<2 mm) was weighed into a 1 L beaker. Distilled water was then added to a volume of 200–250 mL, followed by 10 mL of sodium hexametaphosphate solution. The mixture was then left to stand for 1 day. Thereafter, the mixture was placed in a Bouyoucos’ blender cup and stirred for 5 min using an electrical mixer. The contents of each cup were transferred to a 1 L sedimentation cylinder, and the cylinder was filled with deionized water to the 1000 mL mark. The mixture was then homogenized using manual agitation for 1 min. The solids in the suspension were measured using a hydrometer following 40 s of decantation, with a second measurement taken after 2 h. To correct the hydrometer readings for temperature, 0.36 g L–1 for every 1°C above 20°C was added, and 0.36 g L–1 was subtracted for every 1°C below 20°C (Moorberg & Crouse, Reference Moorberg and Crouse2017). The first reading was used to estimate the sand content and the second one at 2 h was used to estimate the clay content. The silt fraction was calculated as the difference between those two measurements. The texture class was determined from the percentages of sand, silt and clay content according to the classification system of the US Department of Agriculture (Schoeneberger et al., Reference Schoeneberger, Wysocki, Benham and Staff2012).
The mineralogical composition was determined using X-ray diffraction (XRD). The <2 mm fractions were homogenized and quartered and an aliquot was milled and homogenized in an agate ball mill. Afterwards, the aliquot was sieved to <63 μm grain size using a nylon mesh ASTM sieve, and XRD traces were collected from randomly orientated samples scanned over the 2–65°2θ range at a step size of 0.02° with a time per step of 1 s using a Bruker D8 Advance diffractometer with a copper anode, high stability and a SOL-XE energy-dispersive detector. We used 1 mm divergent and anti-scatter slits and a 0.1 mm detector slit. In addition, primary and secondary Soller collimators, both at 2.5°, were used. The quantification limit was 3% w/w, with an absolute uncertainty of ±4% w/w.
The software used to record and process the XRD traces was the Panalytical X'Pert HighScore program. The XRD traces were interpreted using reference files from the American Diffraction Standards (JCPDS). Semi-quantitative mineralogical analysis was performed by measuring the integrated areas of diagnostic peaks (quartz: 3.34 Å; plagioclase: 3.19 Å; pyroxene: 2.90 Å; zeolite: 8.80 Å; hematite: 2.69 Å; calcite: 3.03 Å; magnetite: 2.52 Å; total phyllosilicates: 4.45 Å). These values were converted into relative concentrations using the reflecting powers proposed by Shultz (Reference Shultz1964) and Barahona (Reference Barahona1974).
The clay mineralogy was studied in orientated preparations of the <2 μm fraction. This fraction was extracted via normal gravity settling in tubes according to Stokes’ Law, where the first 10 cm of the suspension of the sedimentation tube is collected after 8 h of sample sedimentation. This process was repeated until the suspension was clear. The suspension was deposited on a glass slide with a pipette. The orientated aggregates were air-dried, treated with ethylene glycol (EG) and heated at 550°C for 2 h and then analysed using XRD. The XRD traces were scanned over the range of 2–35°2θ at a step size of 0.02° with a time per step of 1 s. The semiquantitative estimations of the clay minerals were made using the reflecting powers proposed by Barahona (Reference Barahona1974).
To check for the presence of vermiculite, separate aliquots of <2 μm-sized samples were saturated with Mg and analysed using XRD as orientated aggregates that were air dried, treated with glycerol and then heated at 550°C for 2 h. The di- and tri-octahedral structures of phyllosilicates were based on the measurement of the d-spacing value (060) of the random powder XRD traces of the <2 μm fraction over the range of 57–64°2θ at a step size of 0.01° with a time per step of 4 s.
The broken surfaces of 10 selected samples were studied using scanning electron microscopy (SEM) with an EVO LS15 microscope (Zeiss), coupled to an OXFORD LINK eXL energy-dispersive X-ray spectrometer (SEM-EDX) in back-scattered electron mode. Samples were coated with gold. Analyses were performed using 100 s live time, 20 kV accelerating potential and a vacuum pressure of 1.14 × 10⁻³ Pa.
Chemical analyses of smectite particles and of their morphology and microstructure were carried out using transmission and analytical electron microscopy (TEM + AEM) on the 16 samples with the greatest smectite content. The microscope used was a JEOL JEM 2100HT operating at 200 kV and at a point-to-point resolution of 0.25 nm. The microscope was equipped with an OXFORD INCA EDX spectrometer. The areas for AEM analyses were selected carefully on the basis of lattice fringe images with the aim of analysing smectite particles only. The structural formulae of smectite were calculated from the transmission electron microscopy (TEM)-EDX analyses on the basis of 22 negative charges according to Newman & Brown (Reference Newman and Brown1987), assuming that all Mg was in octahedral positions. As the TEM-EDX technique does not distinguish between Fe(II) and Fe(III), all iron was considered as Fe(III) (Çelik et al., Reference Çelik, Karakaya and Temel1999).
Results
Soil samples from zone I
The samples from zone I are closest to the current glacier front and represent the most recent soils exposed after the glacier retreat (Fig. 2). These soils are developed in areas of stone fields, slope debris, patterned ground and recessional moraine at the northermost part of the peninsula (Table 1).
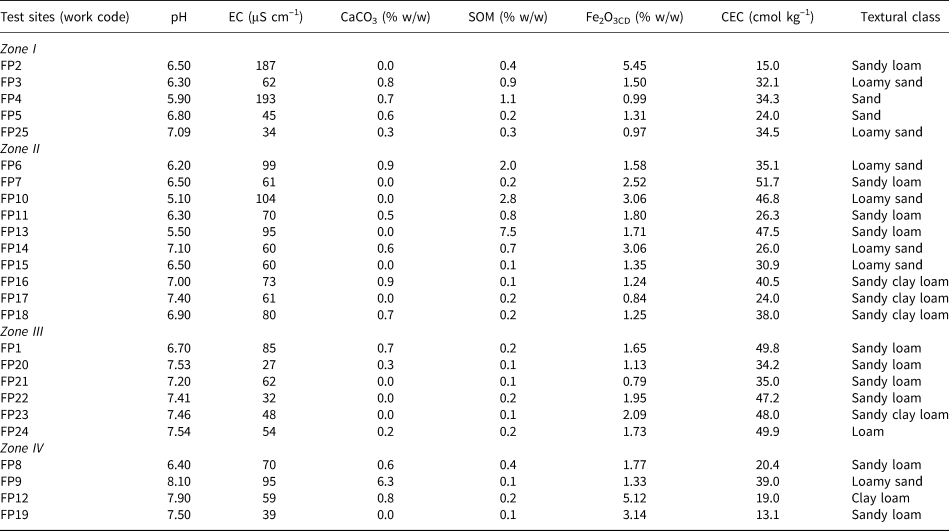
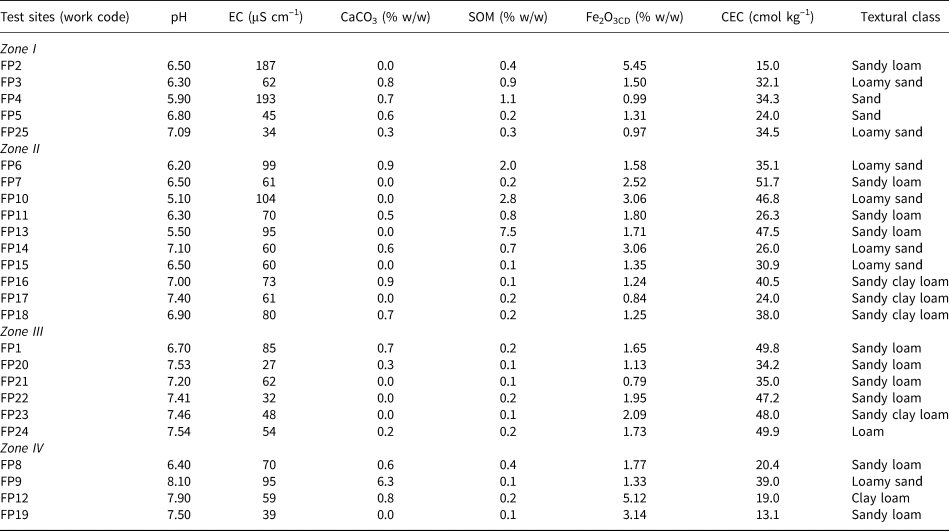
Table 2 lists the chemical and physical analyses from these soils. The pH ranges from 5.9 to 7.09 and the EC ranges from 34 to 193 μS cm–1, indicating that the soils are non-saline (Schoeneberger et al., Reference Schoeneberger, Wysocki, Benham and Staff2012). The SOM contents are low to very low. The low to medium Fe2O3CD content varies from 0.97 to 5.45% w/w, the CEC ranges from medium to high (McBride, Reference McBride1994) and the textural class shows that sand and sandy loam soils predominate.
Soil chemical and physical properties of the studied soil samples.
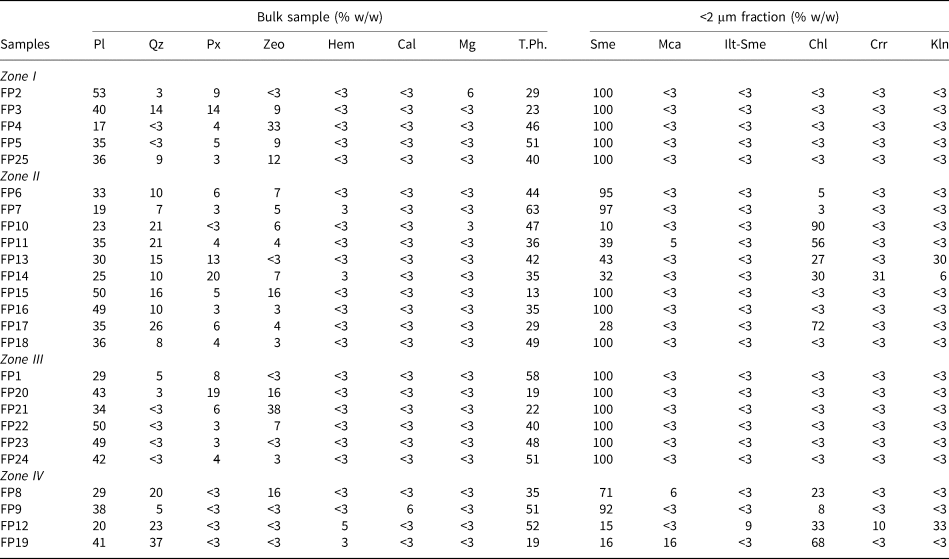
The XRD results (Table 3) indicate that the soil samples are composed mainly of plagioclases and phyllosilicates. Pyroxenes, quartz, zeolites and magnetite appear in minor amounts, except for sample FP4, which has a large zeolite content (abbreviations after Warr, Reference Warr2020).
Semiquantitative mineralogical compositions of the soil samples.
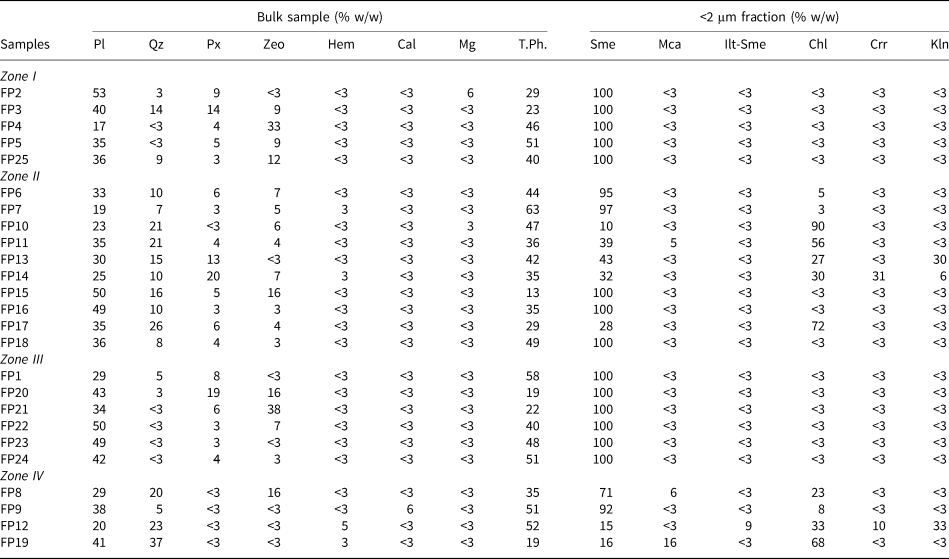
Pl = plagioclase; Qz = quartz; Px = pyroxenes; Zeo = zeolites; Cal = calcite; Hem = hematite; Mg = Magnetite; T.Ph = total phyllosilicates; Sme = smectite; Mca = mica; Ilt-Sme = interstratified illite-smectite; Chl = chlorite; Crr = Corrensite; Kln = kaolinite (abbreviations after Warr, Reference Warr2020).
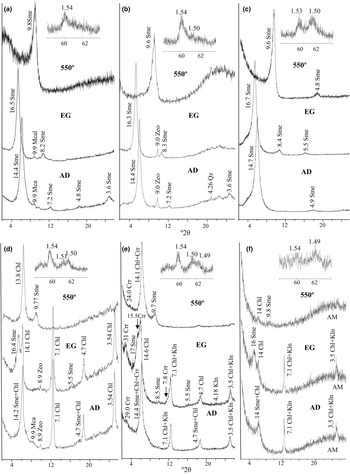
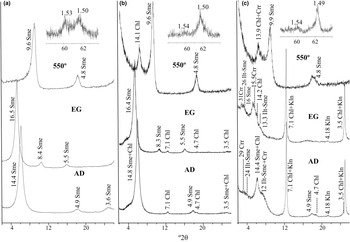
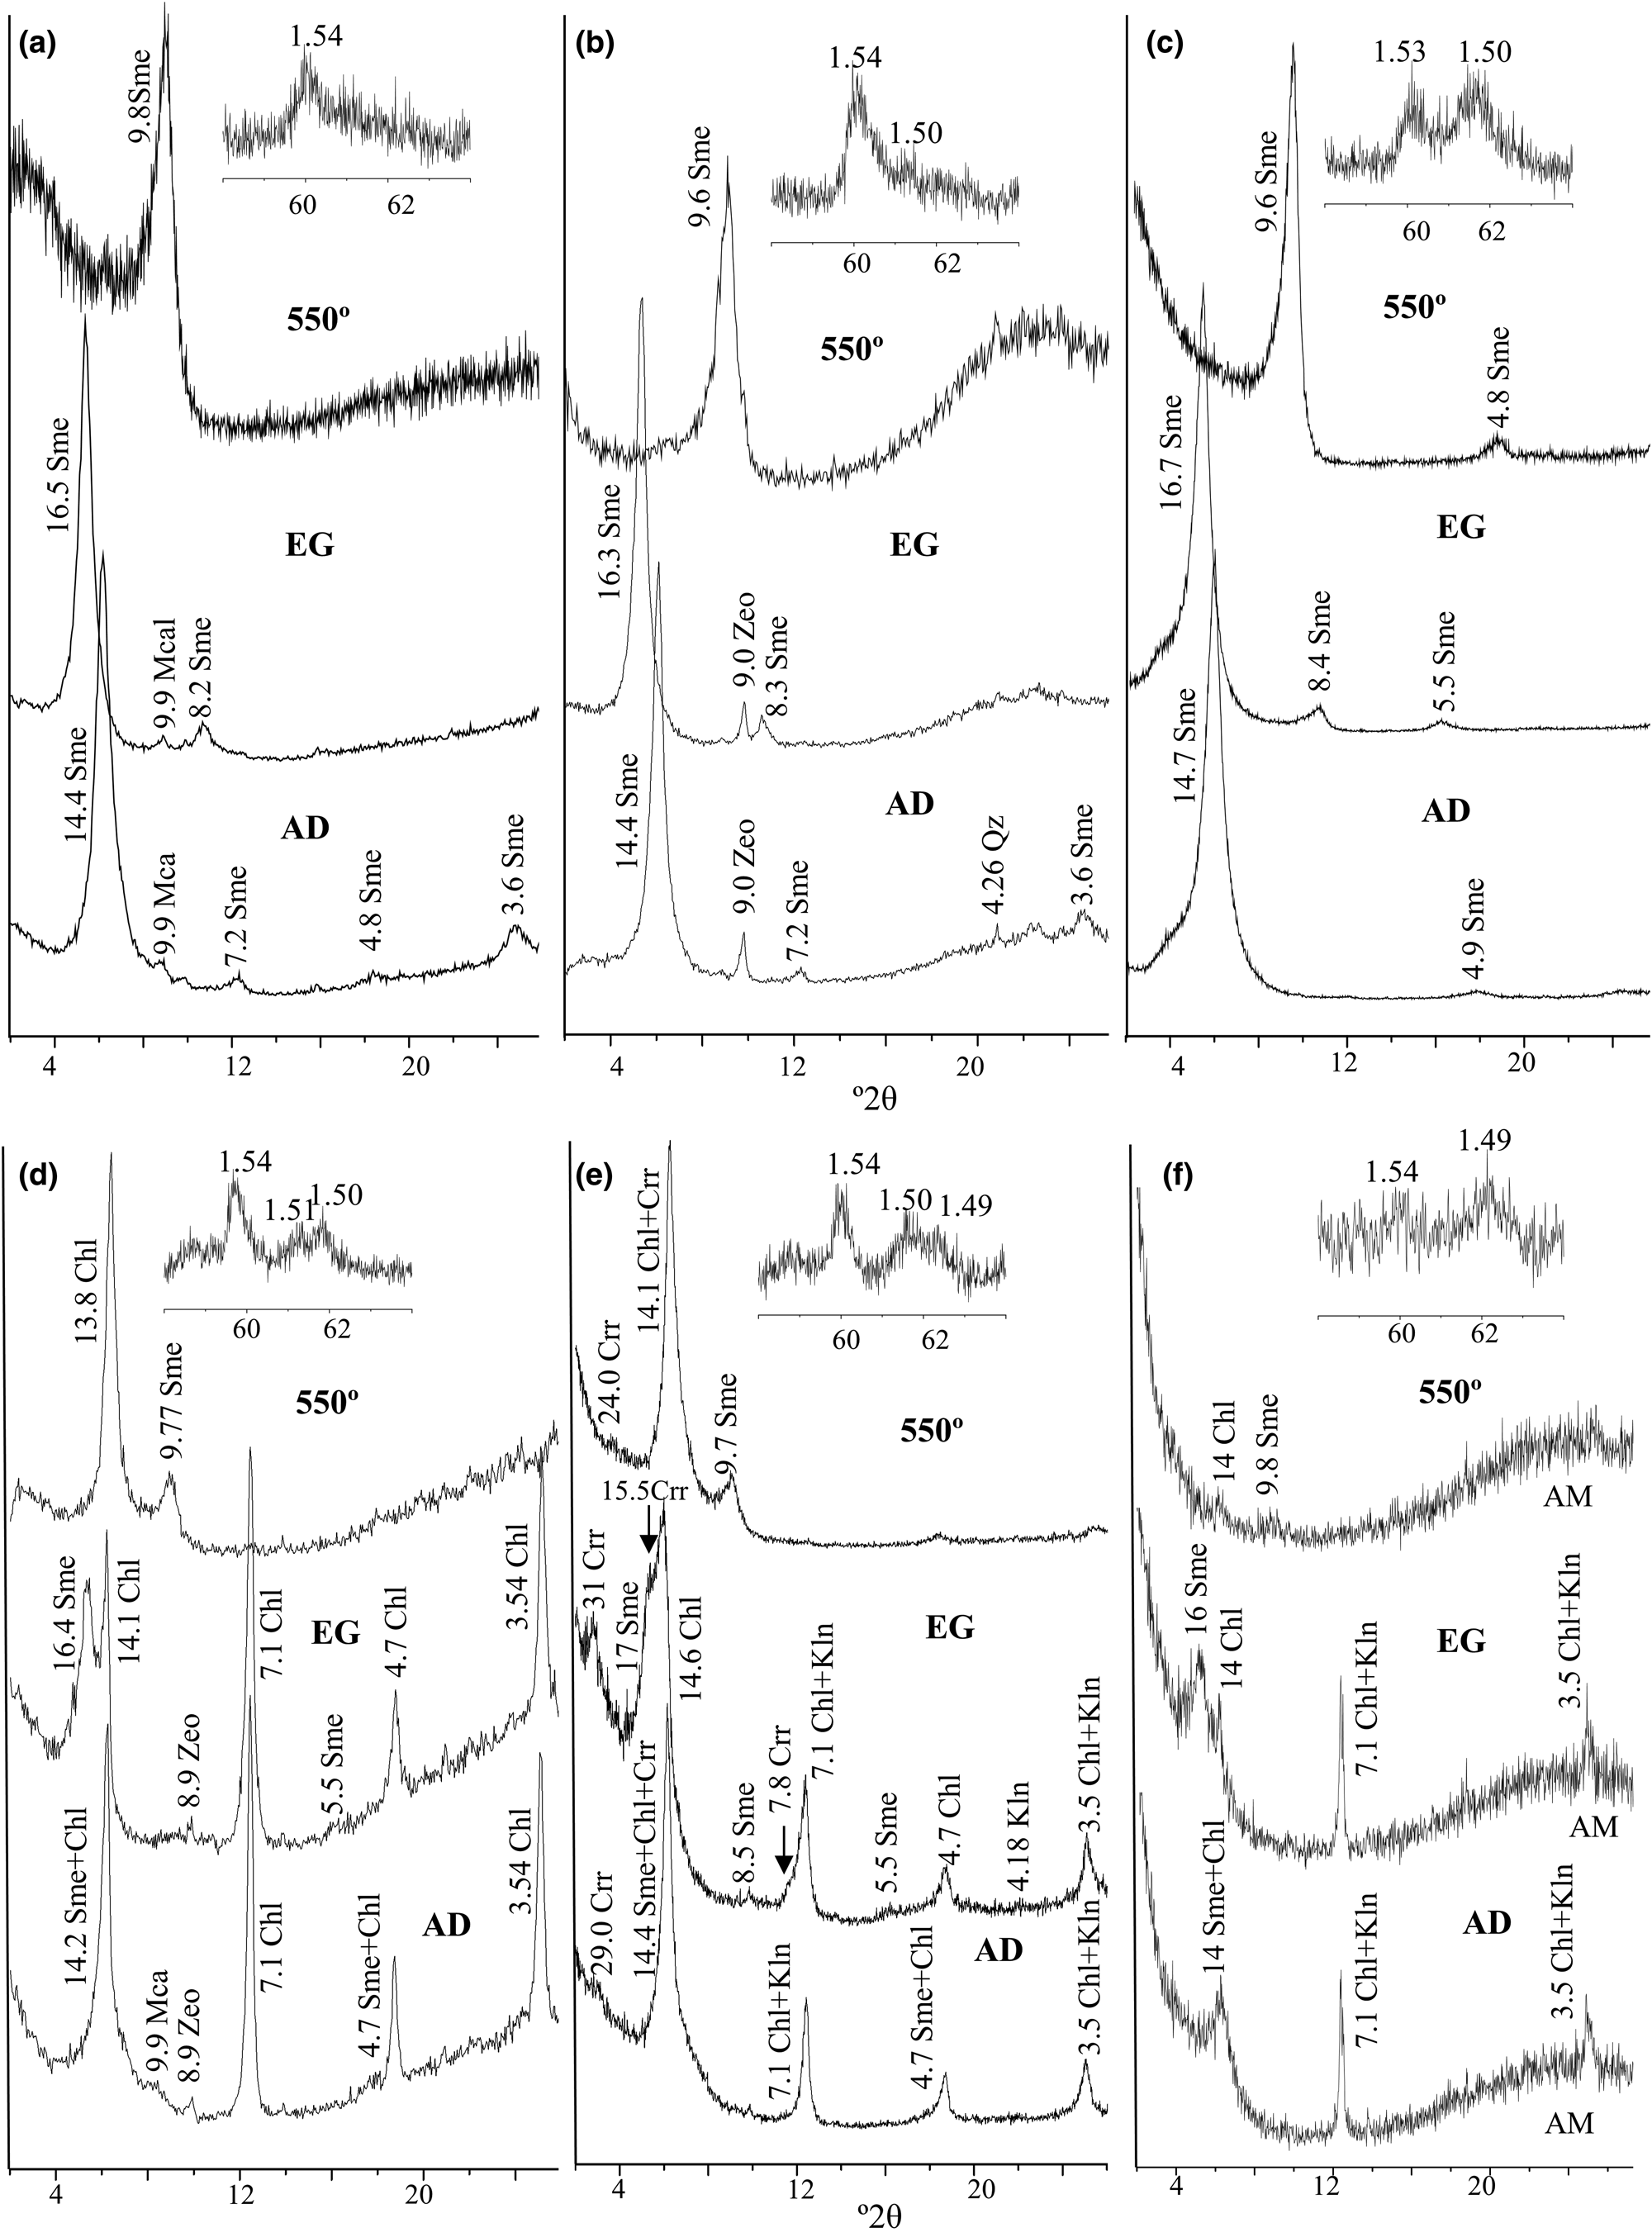
The clay fraction is formed essentially only of smectite (Fig. 3a,b). The air-dried XRD traces exhibit basal spacing at 14.40 Å, which expands to ~16.5 Å upon EG solvation and collapses to 9.8 Å after heating at 550°C. The XRD traces from random powders of <2 μm fractions show an intense (060) reflection at 1.54 Å and a weak one at 1.50 Å, indicating the prevalence of trioctahedral smectites.
XRD traces of the orientated specimens of clay fractions and of random powder in the area of the (060) peaks. (a) Sme from sample FP4 (zone I). (b) Sample FP25 (zone I). (c) Sample FP16 (zone II). (d) Chl and Sme from sample FP17 (zone II). (e) Chl, Sme, Crr and Kln from sample FP14 (zone II). (f) Sme, Chl, Kln and an AM from sample FP13 (zone II). The d spacings are in Å. AD = air dried; AM = amorphous phase; Chl = chlorite; Crr = corrensite; EG = ethylene glycol solvated; Kln = kaolinite; Mca = mica; Qz = quartz; Sme = smectite; Zeo = zeolite (abbreviations after Warr, Reference Warr2020).
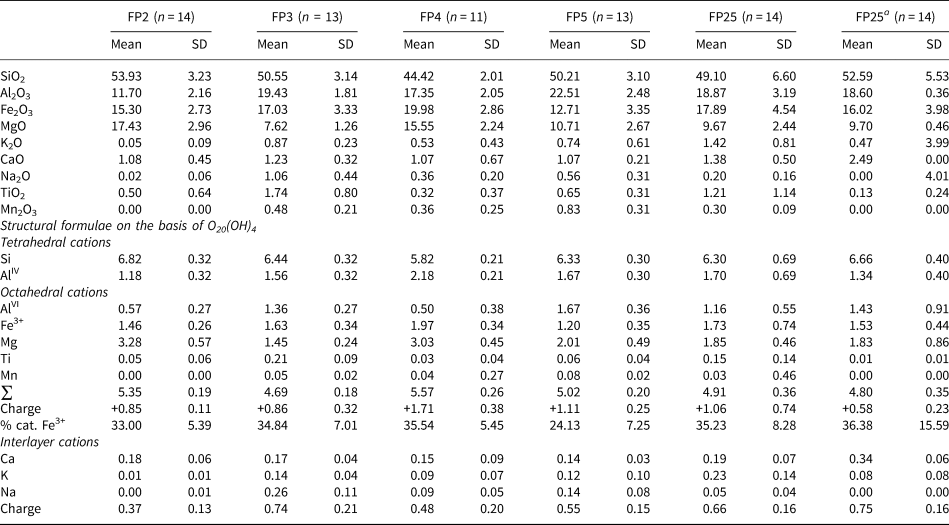
The AEM analyses of the smectites from all five samples show great Fe2O3 and MgO contents (12.71–19.98% w/w and 7.62–17.43% w/w, respectively) and a wide compositional variability that is reflected by the remarkably high standard deviation (Table 4). A common characteristic of all of the samples is that their structural formulae show a predominance of tetrahedral charge, octahedral cations of ~5 atoms per unit cell (a.p.u.c.), a positive octahedral charge and Mg as the main cation, followed generally by Fe and Al. The content of Fe3+ cations is >15% mol/mol, indicating that these are Fe-rich smectites (Brigatti, Reference Brigatti1983; Wolters et al., Reference Wolters, Lagaly, Kahr, Nueesch and Emmerich2009). The great octahedral occupancy and Mg and Fe contents suggest that these compositions represent mixtures of dioctahedral and trioctahedral smectites. However, the positive octahedral charge (>0.29 a.p.u.c.) in all samples (Table 4) indicates that they are vermiculites. This clay mineral has a positive octahedral charge ranging from 0.29 to 1.22 a.p.u.c. (Newman, Reference Newman and Brown1987). In this study, we consider vermiculites as those having structural formulae with octahedral charges >0.29 a.p.u.c.
Average chemical composition (wt.%) and structural formulae of vermiculites from zone I.
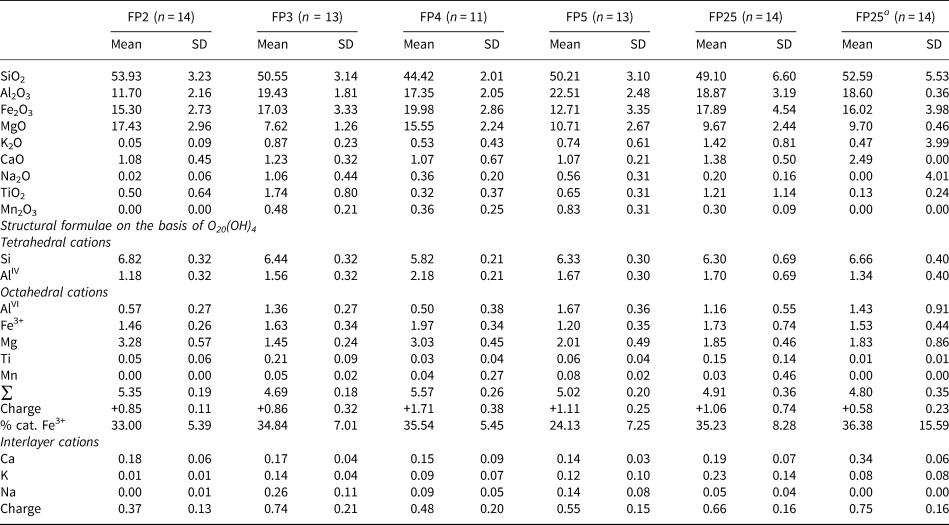
a Ca-saturated.
% cat. Fe3+: percentage of Fe cations in octahedral sites; n = number of analysed spots in each sample.
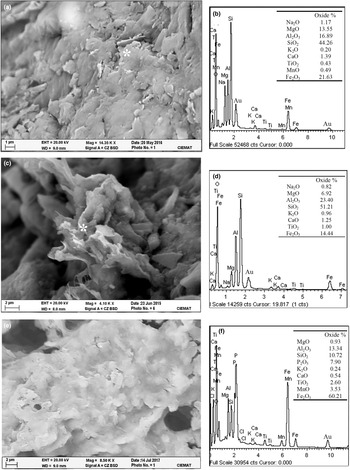
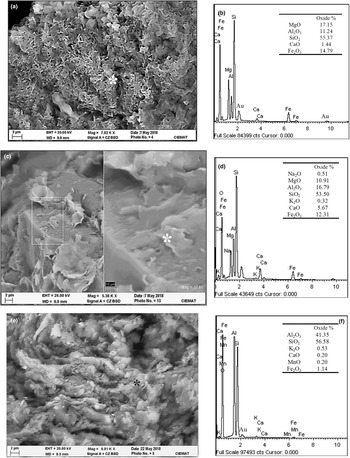
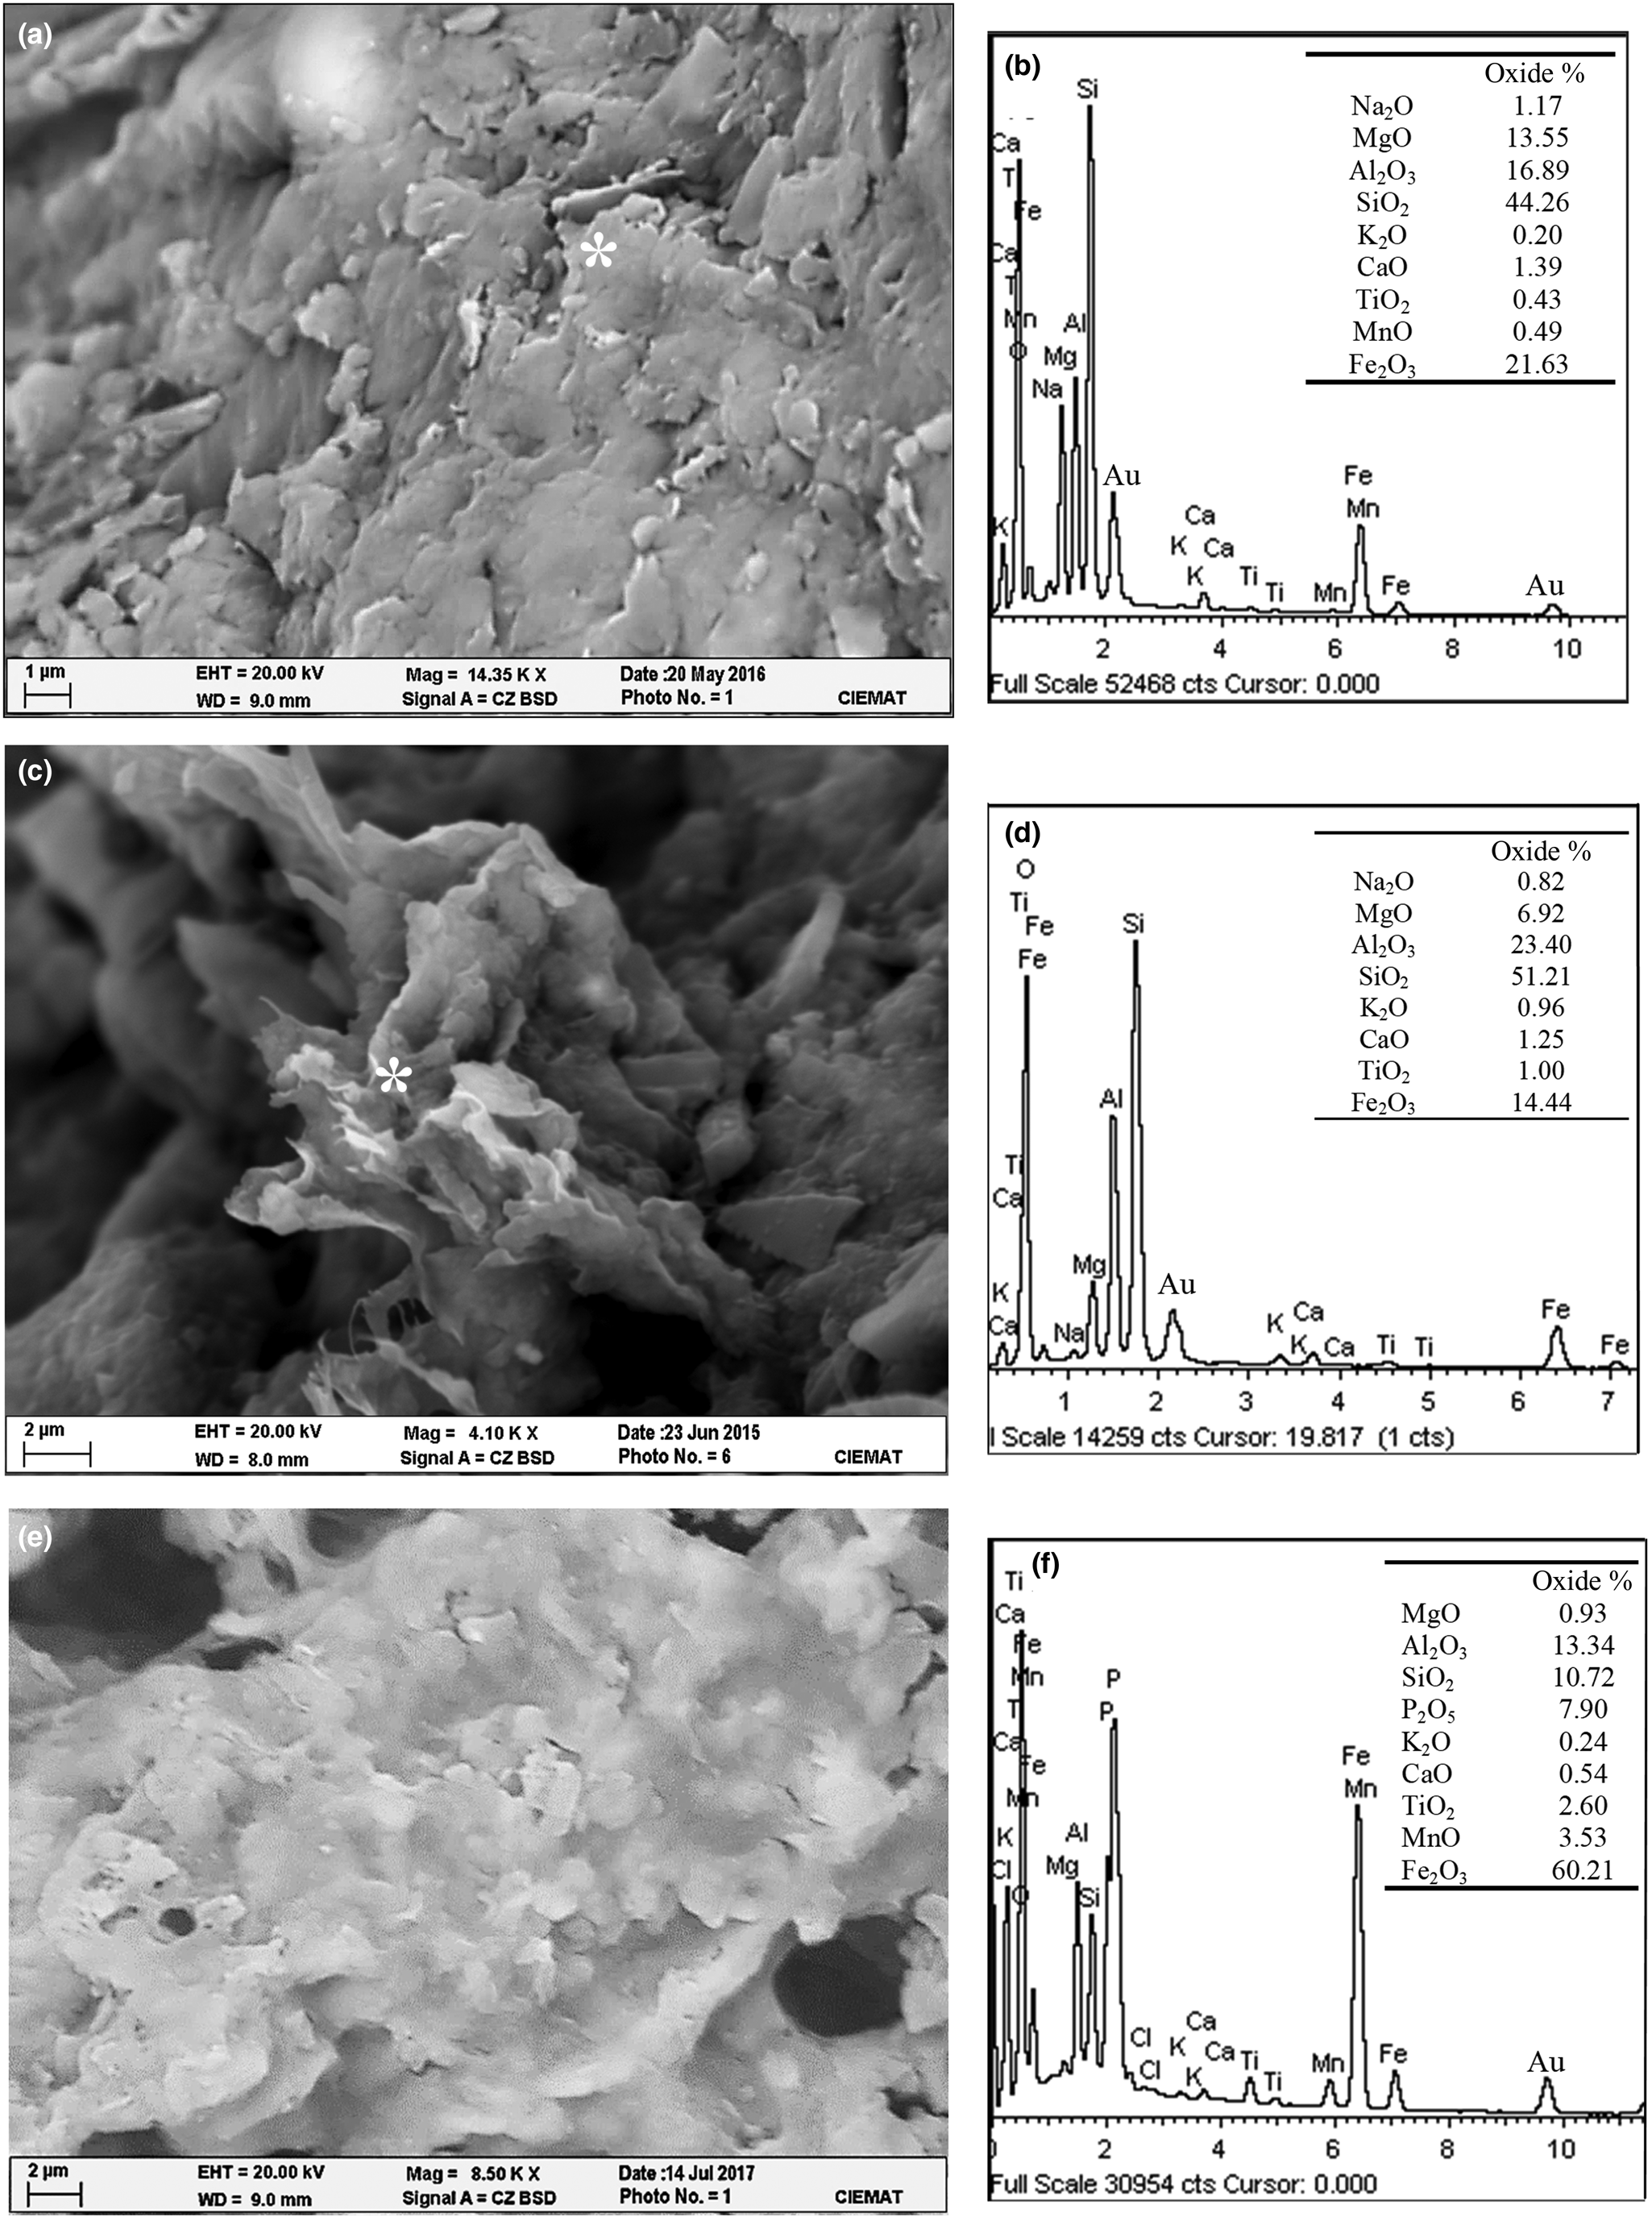
The SEM observations show that the clay mineral of sample FP4 has platelets ~4 μm in size, with rounded and flaked edges (Fig. 4a). Semiquantitative EDX analysis (Fig. 4b) shows great Fe2O3 and MgO contents and a chemical composition that is in agreement with that obtained via AEM + TEM (Table 4).
SEM back-scattered electron images and EDX spectra of (a,b) a vermiculite particle from sample FP4 with platy morphology; (c,d) smectite flakes from sample FP7; and (e,f) aggregates of poorly crystalline Al-Fe phospates from sample FP13.
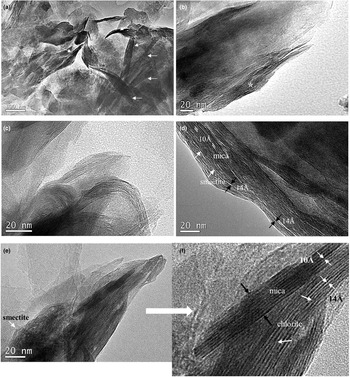
The TEM image shows that sample FP25 consists of vermiculite as thin packets without orientation that varies from 200 to 400 Å, usually with curved and sharp end particles (Fig. 5a). A detailed image of these particles upon which AEM analyses were carried out is shown in Fig. 5b.
TEM images showing: (a) a low-magnification image of sample FP25 showing vermiculite as thin packets without orientation (indicated by arrows); (b) detail of a vermiculite particle from sample FP25 from which AEM analyses were obtained (*); (c) smectite particles from sample FP16 consisting of very thin packets of curved morphology; (d) a smectite particle from sample FP 16 showing wavy fringes with layer terminations (white arrows) and 14 Å periodicity, associated with mica with 10 Å interlayer spacing (black arrows); (e) lattice fringe image of mica and chlorite from sample FP8; and (f) detail of the packet showing two different areas, one of which contains packets of straight parallel 10 Å layers, which suggest a mica (black arrows) that is associated closely to a particle such as chlorite with 14 Å layers that show some dislocations (white arrows).

Soil samples from zone II
Zone II, located at the centre of Fildes Peninsula, spreads over a broad area, reaching the east coast and including Ardley Island. Samples in this zone represent mainly patterned ground, as well as a flat-floored valley and stone stripes (Table 1).
The soils show acid (samples FP10 and FP13) to slightly alkaline pH values, SOM contents of 0.1–7.5% w/w and a low to high Fe2O3CD content in the range of 0.84–3.06% w/w (Table 2).
The XRD traces of the bulk samples from zone II reveal similar mineralogical compositions to the bulk samples from zone I, but containing a greater amount of quartz and a greater variety of clay minerals (Table 3). Thus, samples FP15, FP16 and FP18 are composed only of smectites. Sample FP15 has a lesser smectite content, while samples FP16 and FP 18 show 35 and 49% w/w smectite contents, respectively. Both samples FP16 (Fig. 3c) and FP18 are from locations near to each other and have similar XRD traces for the orientated specimens typical of smectite. The (060) reflections at 1.50 and 1.53 Å reveal the coexistence of di- and tri-octahedral smectites.
Samples FP6 and FP7 consist of smectite and minor chlorite (Table 3), whereas the remaining samples (FP17, FP14, FP10 and FP13) are composed mainly of chlorite and less of smectite. Figure 3d,e shows the XRD traces of samples FP17 and FP14. The air-dried trace exhibits d-spacings at ~14.2, 7.1 and 3.5 Å that are characteristic of chlorite. The 14.2 Å reflection is separated into two peaks after EG solvation at ~16.5 and 14.1 Å, corresponding to smectite and chlorite, respectively. The reflection at ~14 Å after the heat treatment confirms the presence of chlorite. Furthermore, sample FP14 shows two d-spacings at 14.4 and 29.0 Å in the air-dried trace that expand at 15.5 and 31.0 Å after EG solvation, in addition to the presence of a shoulder at 7.8 Å, while the heat treatment trace shows a weak peak at ~24.0 Å. These data indicate the presence of corrensite in the sample. Kaolinite is also present in the sample with d-spacings at 7.1 and 3.5 Å overlapping those of chlorite and with a weak peak at 4.2 Å after EG solvation.
Both samples have a (060) reflection at 1.54 Å that corresponds to trioctahedral chlorite. In addition, sample FP17 shows reflections at 1.51 and 1.50 Å of dioctahedral smectite and probably mica, respectively (Fig. 3d). However, sample FP14 has reflections at 1.50 and 1.49 Å, corresponding to dioctahedral smectite and kaolinite, respectively (Fig. 3e).
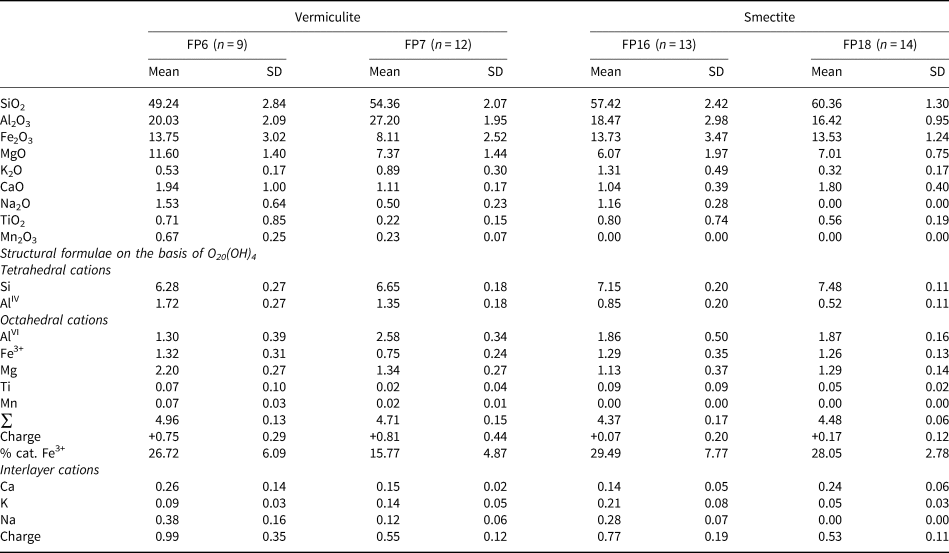
Finally, samples FP10 and FP13 consist of chlorite, minor smectite and a poorly crystalline phase, as is indicated by a broad band at 20–30°2θ, as well as kaolinite being present in sample FP13 (Fig. 3f). Both samples have acid pH values and are similar to the poorly crystalline minerals that were studied by Mendonça et al. (Reference Mendonça, Melo, Schaefer, Simas and Michel2013). According to these authors, these phases originated mainly as a result of chemical weathering under the acidic conditions of chlorite and mica. The AEM analyses of smectites from samples FP16 and FP18 show an average structural formulae with an octahedral occupancy of 4.37 and 4.48 a.p.u.c, respectively, with Al being the main octahedral cation, and with Fe ranging between 1.29 and 1.26 a.p.u.c. and Mg ranging between 1.13 and 1.29 a.p.u.c. In these samples, the Fe3+ cation content is >15% mol/mol. Consequently, these smectites are classified as Fe-rich montmorillonites (Table 5).
Average chemical composition (wt.%) and structural formulae of phyllosilicates from zone II.
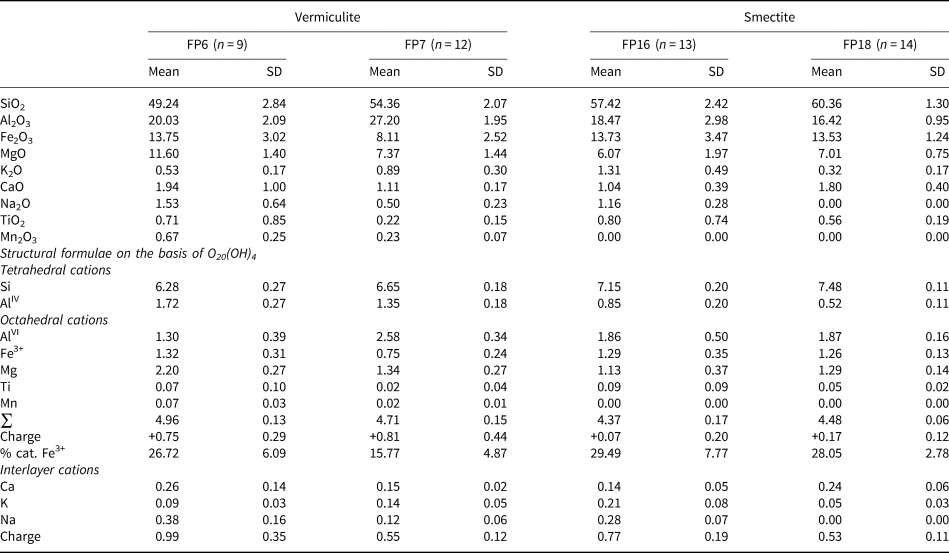
% cat. Fe3+: percentage of Fe cations in octahedral sites; n = number of analysed spots in each sample.
The AEM analyses of sample FP6 show great compositional variability. The structural formulae are characterized by a predominance of tetrahedral charge, and the total number of octahedral cations is ~5 a.p.u.c., with Mg being the main octahedral cation. Furthermore, the octahedral charge is positive (+0.75 a.p.u.c.). This sample has 27% mol/mol of Fe3+ cations in the octahedral sites. Therefore, it can be considered as vermiculite (Table 5) and is similar to the samples from zone I. In contrast, the smectite from sample FP7 has a reasonably homogeneous chemical composition. The structural formula has an octahedral occupancy of 4.71 a.p.u.c. and a positive octahedral charge (+0.81). The content of Fe3+ cations is also >15% mol/mol. Its large octahedral occupancy and great Mg content suggest that it represents a mixture of dioctahedral and trioctahedral smectites. Alternatively, the positive octahedral charge might indicate the presence of vermiculite in the sample.
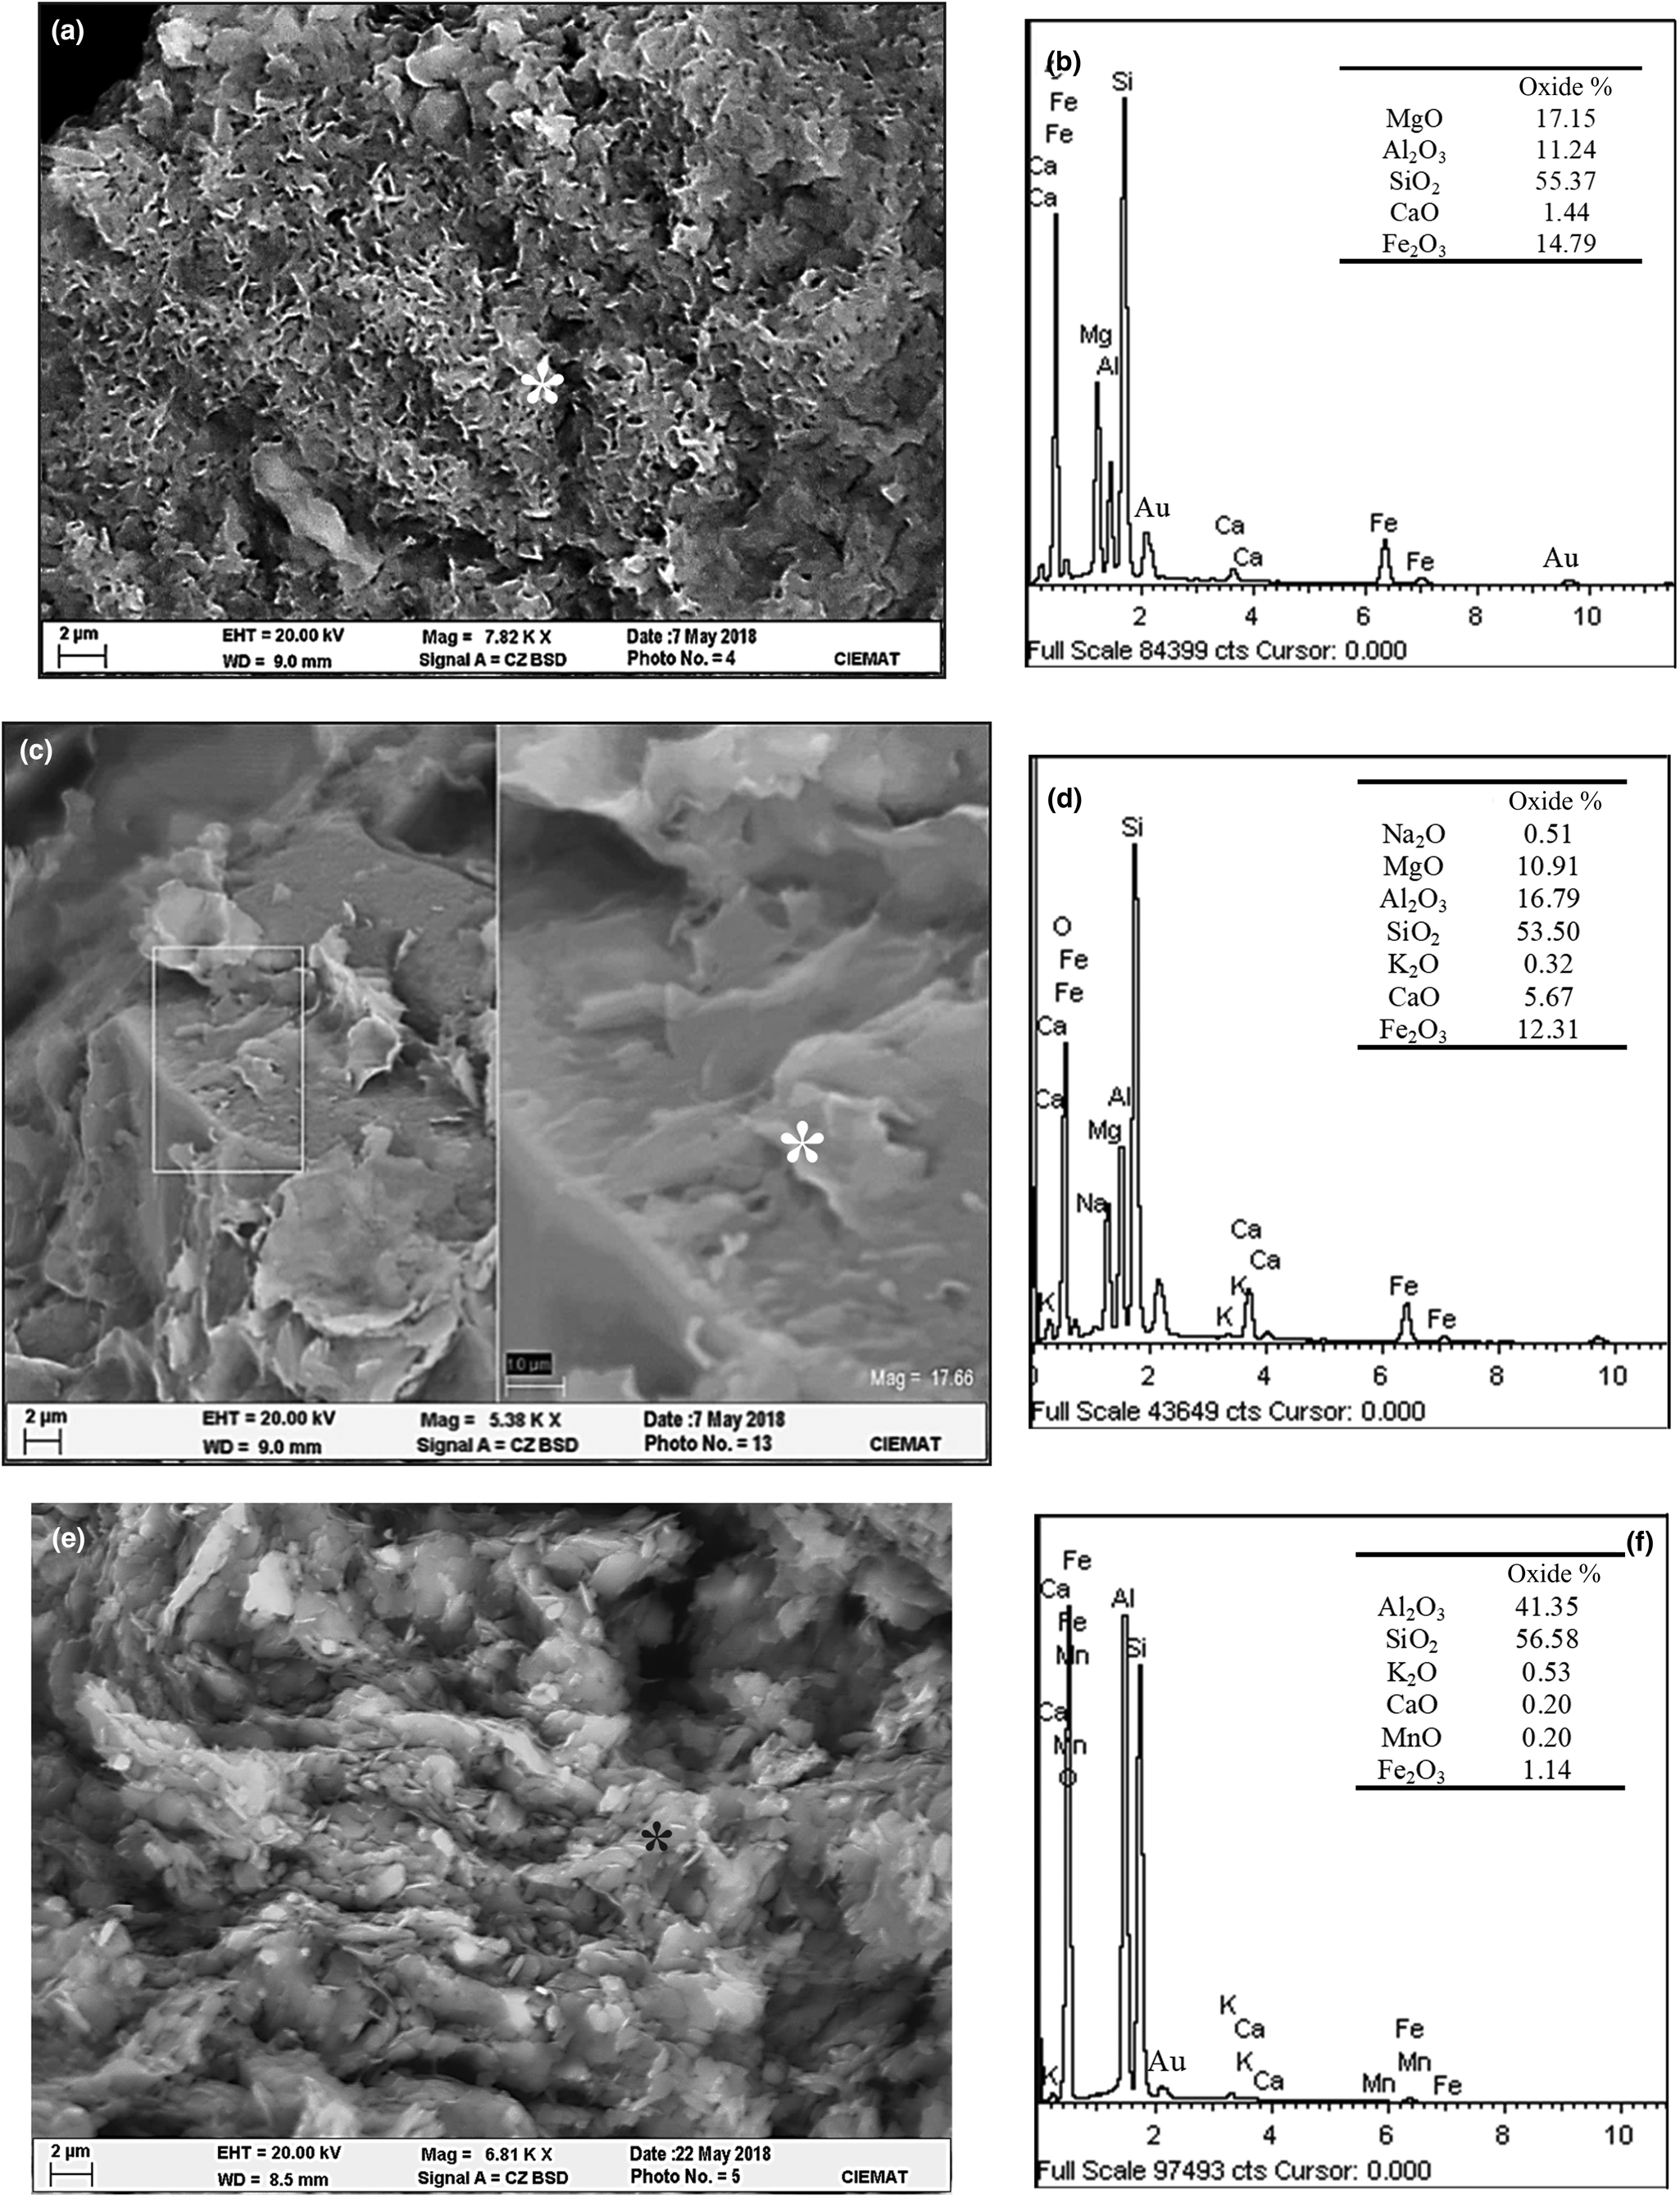
The SEM images of smectite from sample FP7 show elongated and webby flakes as cornflake-like textures (Fig. 4c). The smectite has great Al2O3 and Fe2O3 contents (Fig. 4d). Sample FP13 shows the presence of aggregates of Al-Fe phosphates (Fig. 4e,f) that are composed mainly of Fe2O3 along with Al2O3, SiO2 and P2O5. These Al-Fe phosphates are formed via the interaction of phosphorus-rich solutions from bird guano with soil minerals, as weathering of chlorite and biotite releases amorphous Fe and causes phosphatization (Tatur, Reference Tatur1989, Pereira et al., Reference Pereira, Schaefer, Ker, Almeida and Almeida2013). These phosphates are common in the so-called ornithogenic soils in Maritime Antarctica. The acidic pH and the relatively large organic matter content indicate possible skua excrement from the past.
Observation of sample FP16 under TEM shows smectite layers forming thin packets of imperfect, wavy and discontinuous lattice fringes (Fig. 5c). Smectite also shows anastomosing and wavy fringes with frequent layer terminations. In this case, smectite is associated with mica consisting of straight fringes with 10 Å interlayer spacing (Fig. 5d).
Soil samples from zone III
The soil samples from zone III are situated in the middle platforms on the west coast of Fildes Peninsula (Table 1). The soil pH ranges from 6.70 to 7.54, the Fe2O3CD contents vary from 0.79 to 2.09% w/w and the textural class shows that sandy loam and sandy clay loam soils predominate (Table 2).
The samples consist mainly of plagiolases and phyllosilicates and ocasionally minor pyroxenes, zeolites and hematite. They contain little or no quartz because they derive from andesitic rocks. Phyllosilicates are represented by variable smectite contents (Table 3). There is a consistent increase in smectite content for samples from the north-west of the zone (20% w/w), which is an area exposed to wind, compared to those from the south-west (60% w/w), which is an area less exposed to wind, where the stable terrain conditions favour soil formation.
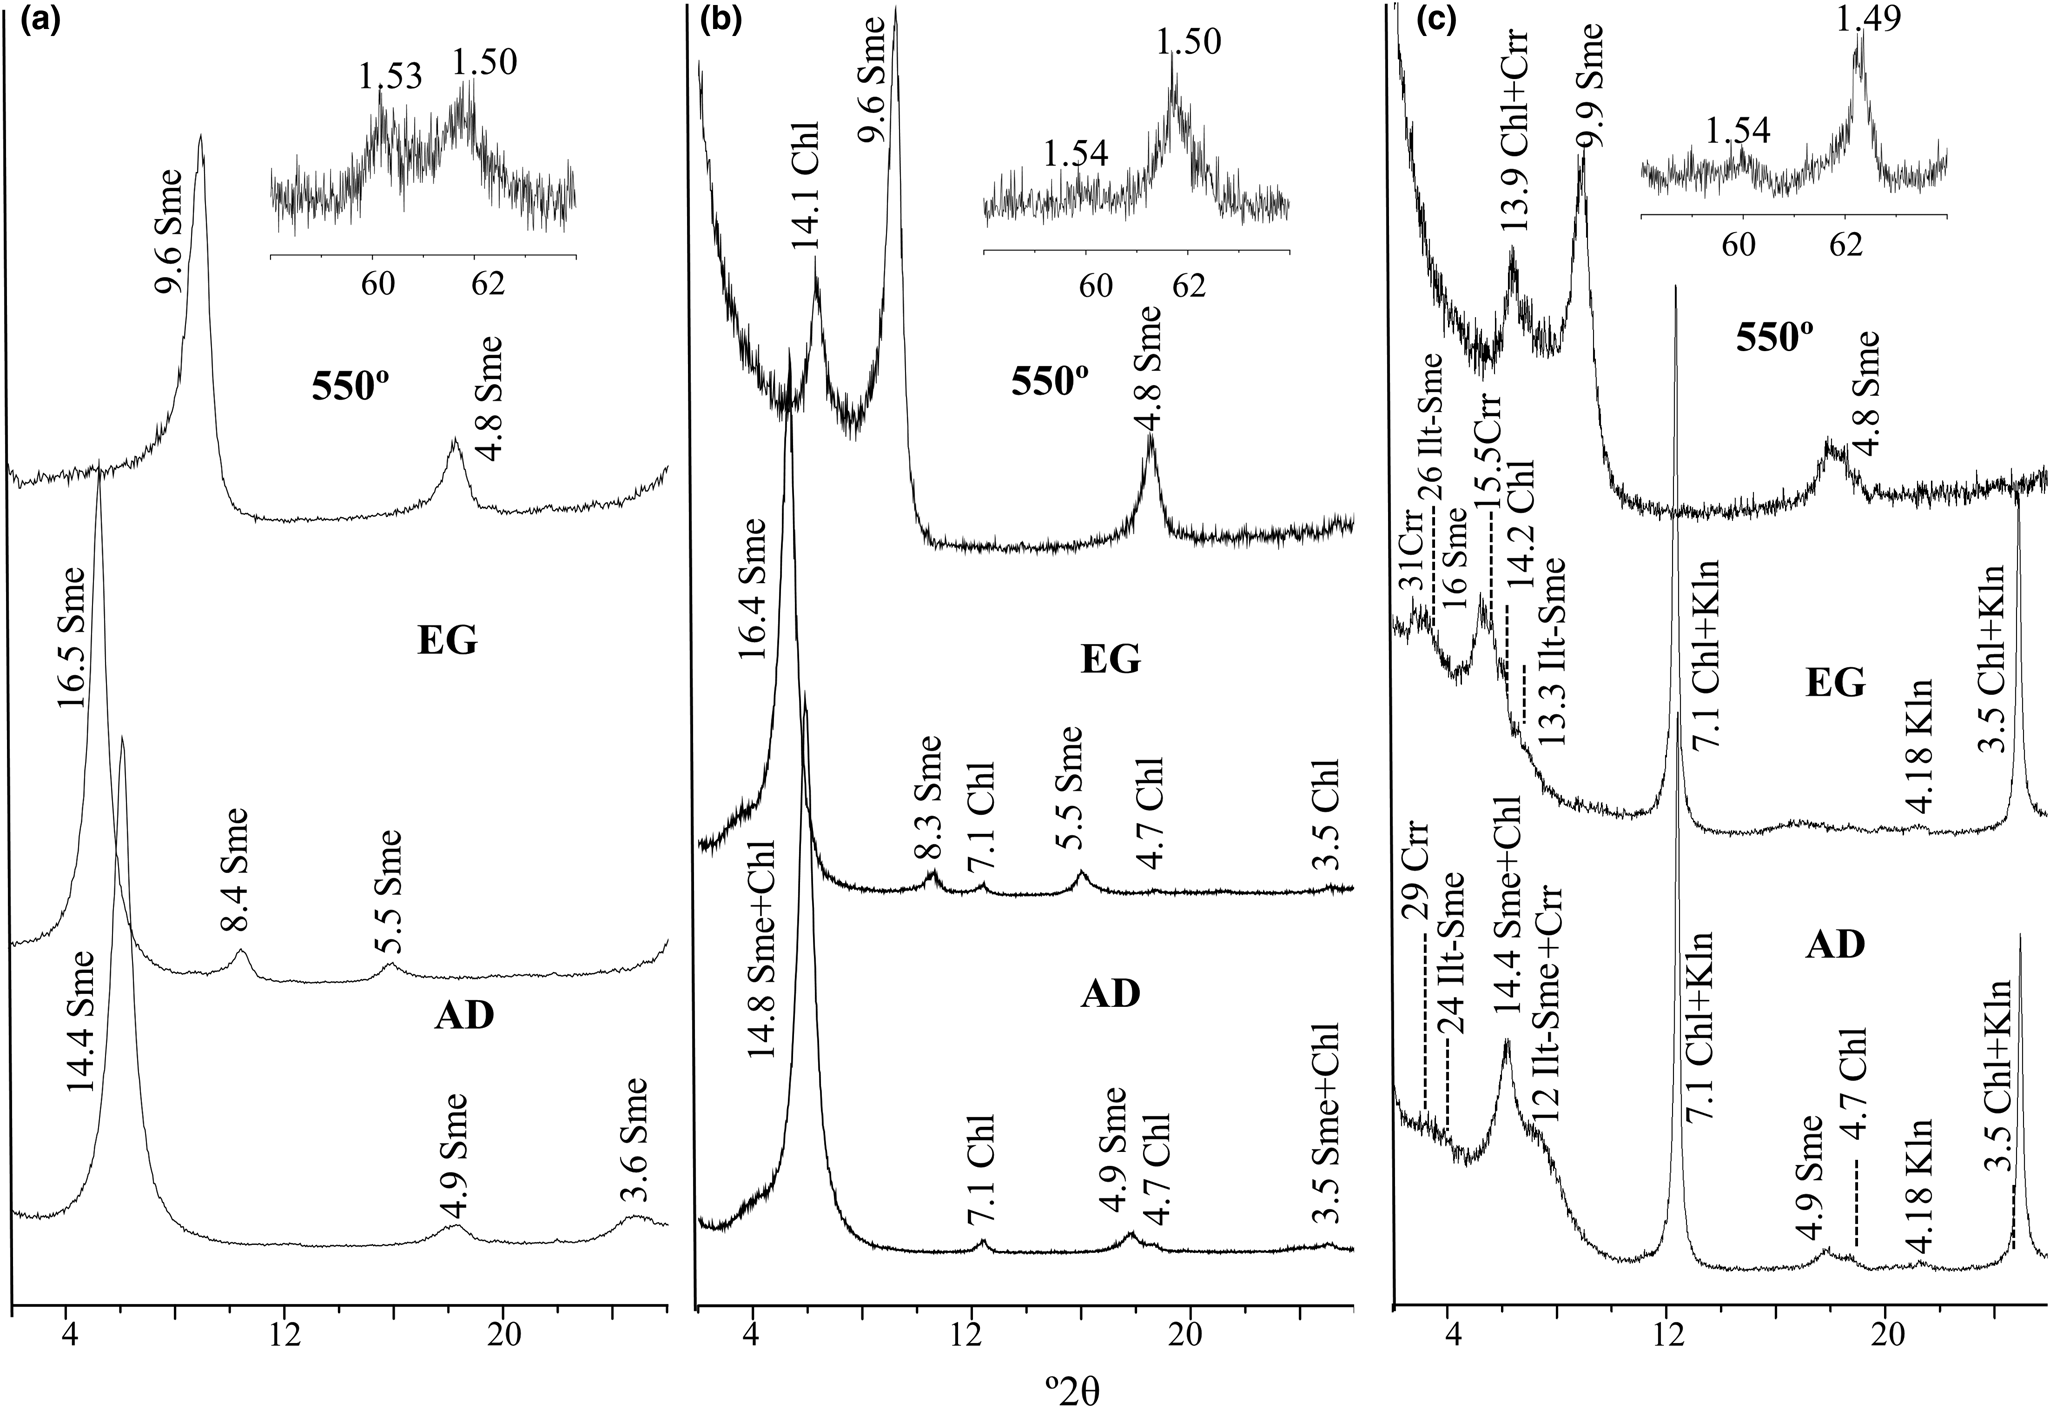
Figure 6a shows XRD traces from sample FP23 of the orientated specimens of smectite. The (060) bands in sample FP23 at 1.53 and 1.50 Å indicate the presence of tri- and di-octahedral smectites, respectively. These (060) bands are characteristic of all of the samples in this zone.
XRD traces of the orientated specimens of clay fractions and (060) reflections of random powder. (a) Sme from sample FP23 (zone III). (b) Sme and minor Chl from sample FP9 (zone IV). (c) Sme, Kln, Clr, Ilt-Sme and Crr from sample FP12 (zone IV). The d-spacings are expressed in Å. AD = air dried; Chl = chlorite; Crr = corrensite; EG = ethylene glycol solvated; Ilt-Sme = interstratified illite-smectite; Kln = kaolinite; Sme = smectite (abbreviations after Warr, Reference Warr2020).
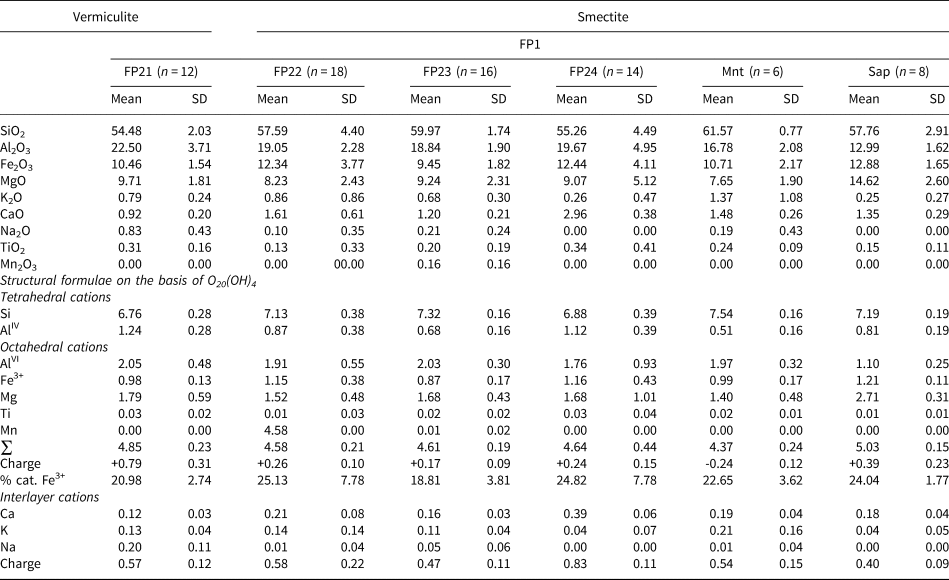
The AEM analyses of smectite particles (Table 6) show an octahedral occupancy that varies from 4.5 to 4.8 a.p.u.c., with Al being the main octahedral cation, followed by Mg and Fe. Sample FP21 has a high positive octahedral charge (+0.79 a.p.u.c.) which corresponds to vermiculite. The remaining samples have a high octahedral occupancy, great Mg and Fe contents and positive octahedral charge that is <0.29 a.p.u.c., indicating compositions of a mixture of di- and tri-octahedral smectites. This is consistent with the data obtained from the (060) bands.
Average chemical composition (wt.%) and structural formulae of phyllosilicates from zone III.
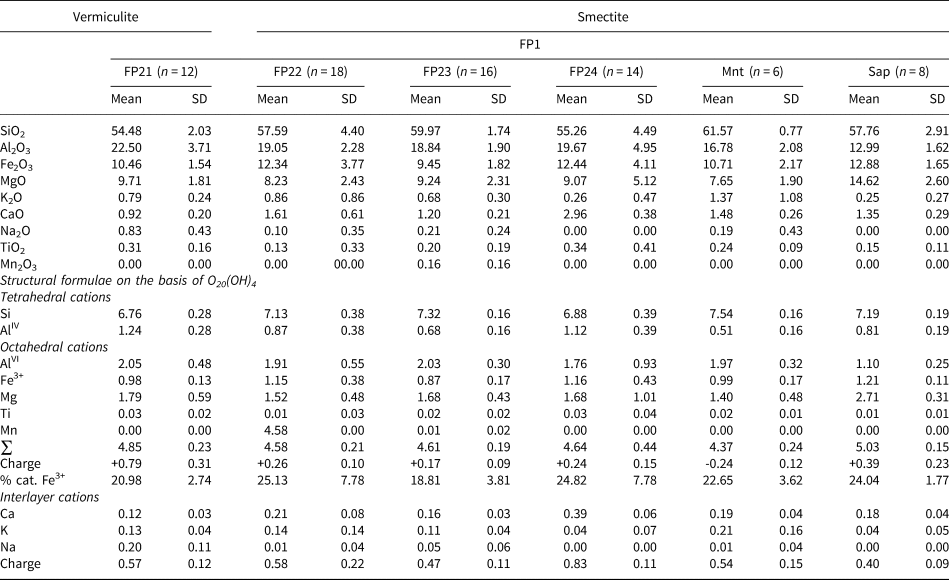
% cat. Fe3+: percentage of Fe cations in octahedral sites; Mnt: montmorillonite; n = number of analysed spots in each sample; Sap: saponite (abbreviations after Warr, Reference Warr2020).
Sample FP1 is an exception because of its large compositional variability. Two groups of smectites were indentified: dioctahedral smectites with >65% of the octahedral sites occupied by trivalent cations (Weaver & Pollard, Reference Weaver and Pollard1973) and an intermediate composition between di- and tri-octahedral smectites with 33–60% of the octahedral sites occupied by trivalent cations (Table 6). The first type contains 4.37 a.p.u.c. in terms of octahedral cations, displaying negative octahedral charge, and the structural formula corresponds to Fe-rich montmorillonite. The second type shows an octahedral cation occupancy of 5 a.p.u.c., with Mg as the main octahedral cation, and a positive octahedral charge (+0.39 a.p.u.c.). As a consequence, this sample can be classified as Fe-rich saponite or vermiculite. The SEM images show the presence of saponite with a flaky morphology and undulating edges in an arrangement with edge-to-edge contact, resulting in a disordered ‘cornflake’ fabric (Fig. 7a,b). Furthermore, smectite shows wavy and large flaky crystals growing on partially dissolved plagioclase, which form a thin alteration crust on the surface that suggests a replacement product of plagioclase. The EDX analysis shows lesser MgO and Fe2O3 contents and greater Al2O3 and CaO contents than those that would be expected for saponite (Fig. 7c,d). The large amount of CaO suggests that the EDX analysis was contaminated with plagioclase, which is present under the thin layer of smectite.
SEM back-scattered electron images and EDX spectra of: (a,b) Fe- Mg-rich smectite from sample FP1 with flaky morphology and undulating edges; (c,d) alteration of a feldspar grain to smectite flakes and detail of this process (sample FP1); and (e,f) anhhedral flakes of kaolinite from sample FP12.
Soil samples from zone IV
The soil samples from zone IV are situated at the south of Fildes Peninsula on patterned ground and a stone field (Table 1). Their pH ranges from slightly acid to alkaline (Table 2). The EC values of these samples indicate non-saline soils with a low to high Fe2O3CD content, in the range of 1.33–5.12% w/w.
The XRD results indicate that all samples, except for sample FP9, have moderate quartz contents, similar to those from zone II, in addition to plagioclase, phyllosilicates and minor zeolites and hematite. Calcite (6% w/w) is present in one sample (FP9).
The clay minerals present are smectite, chlorite and, ocasionally, scarce mica, as was the case in zone II, except for the presence of kaolinite in sample FP12 (Table 3). Figure 6b displays the XRD traces of orientated specimens of sample FP9, which is composed mainly of smectite. The very weak reflections at 7.10, 4.70 and 3.56 Å under air-dried conditions as well as at 14.00 Å after heat treatment belong to chlorite. The intense (060) reflection at 1.50 Å corresponds to dioctahedral smectite and the weak reflection at 1.54 Å indicates chlorite.
Sample FP12 is composed of smectite, chlorite and kaolinite (Table 3). Figure 6c displays the air-dried XRD trace that exhibits basal spacing of 14.0 Å, indicative of smectite and chlorite, and further spacings at 7.1 and 3.5 Å, which correspond to chlorite and kaolinite. The 14.0 Å peak is separated into two segments after EG solvation to 16.0 Å belonging to smectite and 14.0 Å, which is typical of chlorite. The presence of kaolinite in the sample is evidenced by the intense peaks at 7.1 and 3.57 Å in relation to a less intense reflection at 14.0 Å of chlorite. In addition, the air-dried XRD trace shows two reflections at 12.2 and 24.0 Å, which expand to 13.3 and 26.0 Å, respectively, upon EG solvation. These reflections indicate the presence of interstratified illite-smectite in the sample. In addition, the reflections at 29.0 and 14.4 Å in the air-dried form and at 31.0 and 15.5 Å after EG solvation correspond to corrensite. The (060) reflections show a very weak peak at 1.54 Å of chlorite and another intense peak at 1.49 Å corresponding to both kaolinite and smectite.
Finally, the soil from sample FP19 was collected at an elevated location denominated as the middle platform with a steep rocky coast. This location is an exposed site affected by wind erosion and shows barely any soil development. It has a very small clay content consisting mainly of chlorite and minor smectite and mica (Table 3).
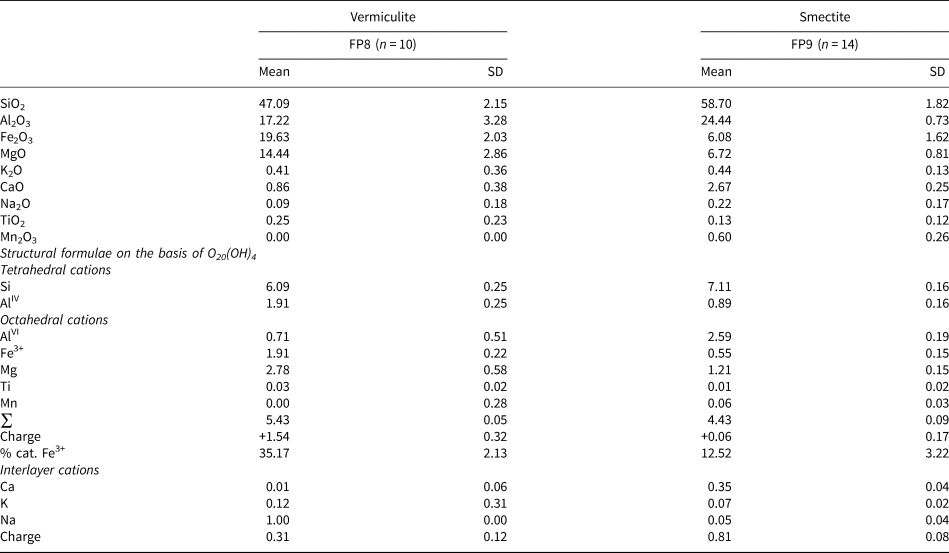
Table 7 shows the results of the AEM analyses of samples FP8 and FP9. The first sample shows great Fe2O3 and MgO contents. It has a total octahedral cation occupancy of 5.43 a.p.u.c., with Mg being the main octahedral cation, followed by Fe and Al, a highly negative tetrahedral charge (–1.91 a.p.u.c.) and a highly positive octahedral charge. As a consequence, the structural formulae correspond to vermiculite. However, sample FP9 shows a structural formula with total octahedral cations of 4.43 a.p.u.c., with Al as the main cation. In this case, the octahedral charge is negative. The amount of Fe3+ cations is <15% mol/mol. This smectite is Al-montmorillonite.
Average chemical composition (wt.%) and structural formulae of phyllosilicates from zone IV.
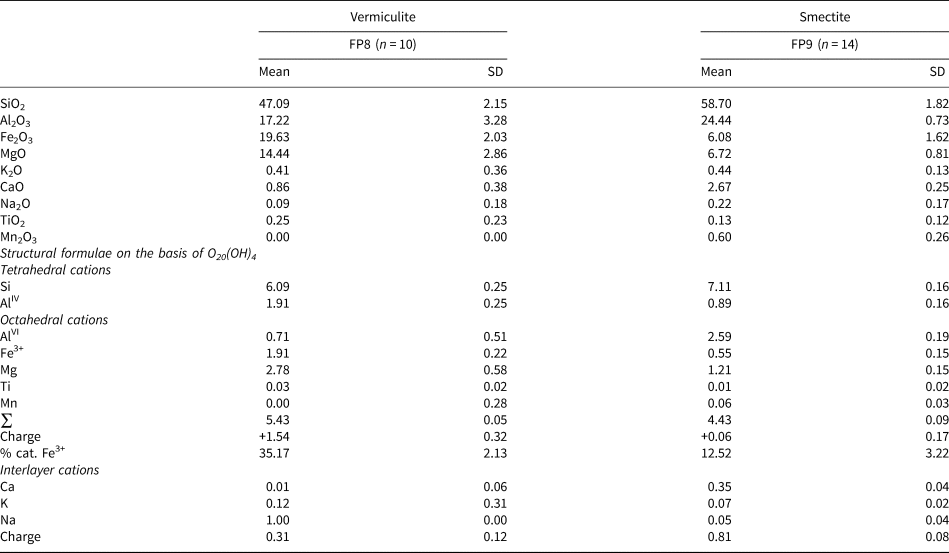
% cat. Fe3+: percentage of Fe cations in octahedral sites; n = number of analysed spots in each sample.
The SEM images show anhedral kaolinite particles of <3 μm in size with a plate morphology consisting mainly of SiO2 and Al2O3 (Fig. 7e,f). Kaolinite has been identified in Fildes Peninsula to have formed in acidic soils from the weathering of plagioclase (Simas et al., Reference Simas, Schaeffer, Melo, Guerra, Saunders and Gilkes2006). However, the anhedral morphology and pH value of 7.8 of the soil are consistent with a detrital origin.
The TEM images of sample FP8 show thin smectite packets with degraded anastomosing and wavy lattice fringes (Fig. 5e). Smectite is associated with 10 nm-thick mica packets consisting of straight and defect-free 10 Å layers, as well as a packet with lattice fringes of 14 Å layers, having various layer terminations that correspond to either chlorite or vermiculite layers (Fig. 5e,f).
Discussion
The XRD traces and the SEM, TEM and AEM analyses of the soil samples from Fildes Peninsula reveal a heterogeneous and complex mixture of clay minerals. The soils are composed mainly of smectite, vermiculite, chlorite and minor mica, kaolinite, corrensite and interstratified illite-smectite. Smectite and vermiculite are the main clay minerals in all of the samples, except for six samples composed mainly of chlorite, especially those from the east coast of Fildes Peninsula.
Most smectites show a structural formula with positive octahedral charge. This is due to (1) the presence of vermiculite or (2) the assignment of all Mg to octahedral sites.
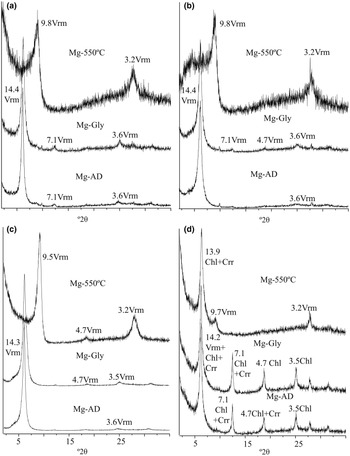
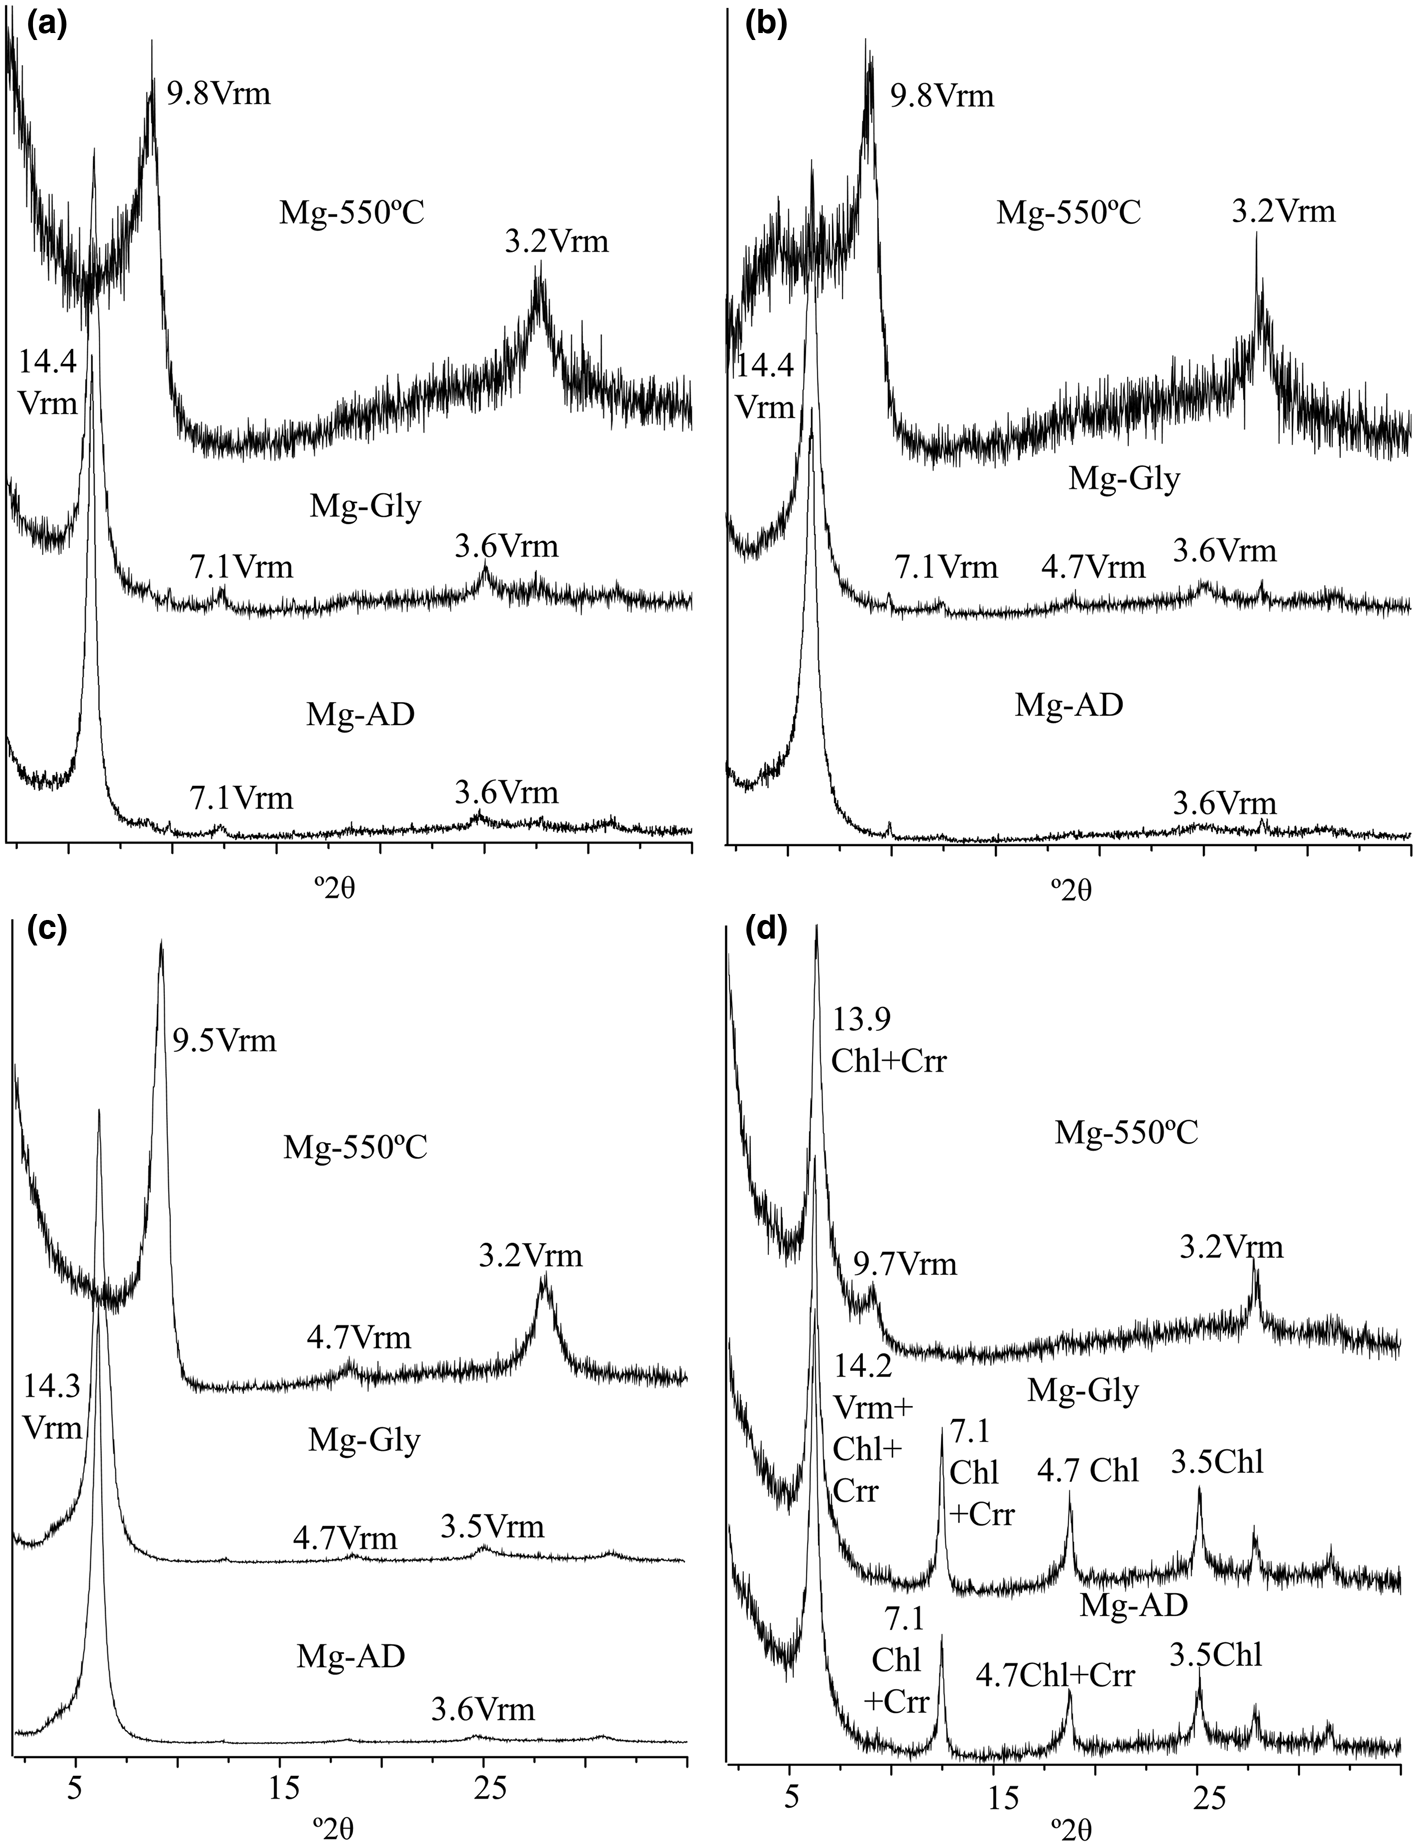
(1) To identify the clay mineral, samples FP1, FP4, FP5, FP6, FP7 and FP16 were saturated with Mg followed by glycerol solvation. The basal spacing at 14 Å was retained, which indicated that vermiculite is present in the samples (Fig. 8a–c). The (060) reflection at 1.54 Å, especially in samples from zone I, indicates that the vermiculite is trioctahedral. In addition, the morphology of large plates observed in sample FP4 via SEM (Fig. 4a) is consistent with vermiculite (Campos et al., Reference Campos, Moreno and Molina2009; Belhouideg & Lagache, Reference Belhouideg and Lagache2014; Nguyen et al., Reference Nguyen, Balim, Penhoud, Duclaux, Mirabel and Reinert2014).
(2) The excess of positive octahedral charge in smectites could also be caused by an erroneous assignment of Mg2+ to the octahedral layer instead of the interlayer (Newman & Brown, Reference Newman and Brown1987; Christidis, Reference Christidis2011). To determine the existence of exchangeable Mg in the structural formula, sample FP25 was homo-ionized with Ca2+ and compared with the original sample (Table 4). The MgO content (wt.%) does not decrease in the Ca-saturated sample. This indicates that most Mg is octahedral. Therefore, the erroneous assignment of Mg2+ to the octahedral layer does not seem to be the cause of the positive octahedral charge.
To identify the type of interstratified components in corrensite, sample FP14 was saturated with Mg and solvated with glycerol. The XRD trace was unaffected after the treatment. Consequently, the corrensite is interstratified chlorite-vermiculite (Fig. 8d).
XRD traces of (a) sample FP4, (b) sample FP5, (c) sample FP1 and (d) sample FP14 corresponding to the orientated specimen of the Mg-saturated clay fraction. The d-spacings are in Å. AD = air dried; Chl = chlorite; Crr = corrensite; Gly = glycerol solvated; Mg-550°C: heat treatment at 550°C; Vrm = vermiculite (abbreviations after Warr, Reference Warr2020).
Vermiculite has also been described in Fildes Peninsula in previous works (Poggere et al., Reference Poggere, Melo, Curi, Schaefer and Francelino2017; Hernández et al., Reference Hernández, Bastias, Matus and Mahaney2018). Surface weathering or the low-grade metamorphism and hydrothermal alteration that affected the volcanic rocks from Fildes Peninsula (Venum & Nejedly, Reference Vennum and Nejedly1990; Willan & Armstrong, Reference Willan and Armstrong2002; Montecinos de Almedia et al., Reference Montecinos de Almeida, Machado, Fontoura Hansen, Chemale, Fensterseifer, Petry and de Lima2003; Bastias et al., Reference Bastias, Fuentes, Aguirre, Hervé, Fernandoy and Demant2013) might have transformed biotite and chlorite into vermiculite via interstratified chlorite-vermiculite (Wilson, Reference Wilson1999).
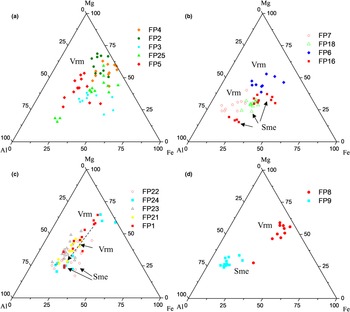
The distribution of the octahedral cations of vermiculites in the Al–Mg–Fe ternary diagram shows that samples in the proximity of the glacier front (zone I) display the greatest compositional variation of all of the studied samples (Fig. 9a). Their compositions are projected towards the Mg and Fe axis and the central part of the diagram. Clay minerals show compositional variations both within individual samples and between various samples. A considerable compositional overlap between the samples is also observed. This great compositional variation in zone I is related to the proximity of the current front where the periglacial and paraglacial processes are most active. The soils have developed from a mixture of glacially transported volcanic rocks followed by periglacial and fluvial processes that became more active once the area became ice-free. End moraine deposits and the outwash plain sandur of the glacier are normally active areas with mixtures of various rocks and debris that are transported depending on the amount of meltwater. The effect of wind transport near the glacier front is also increased due to wind generated by a temperature difference between the air in contact with the glacier and free air at the same altitude, and this will add further to the transport of sediments.
Ternary diagrams (Güven, Reference Güven and Bailey1988) showing the distribution of the octahedral cations of the smectites (Sme) and vermicultes (Vrm) from various zones: (a) samples from zone I; (b) samples from zone II; (c) samples from zone III; and (d) samples from zone IV. Vme and Sme clay compositions are shown. Note the evolutionary trends from Mg-Fe-rich members (Vme type) to Al-rich Smes in (c).
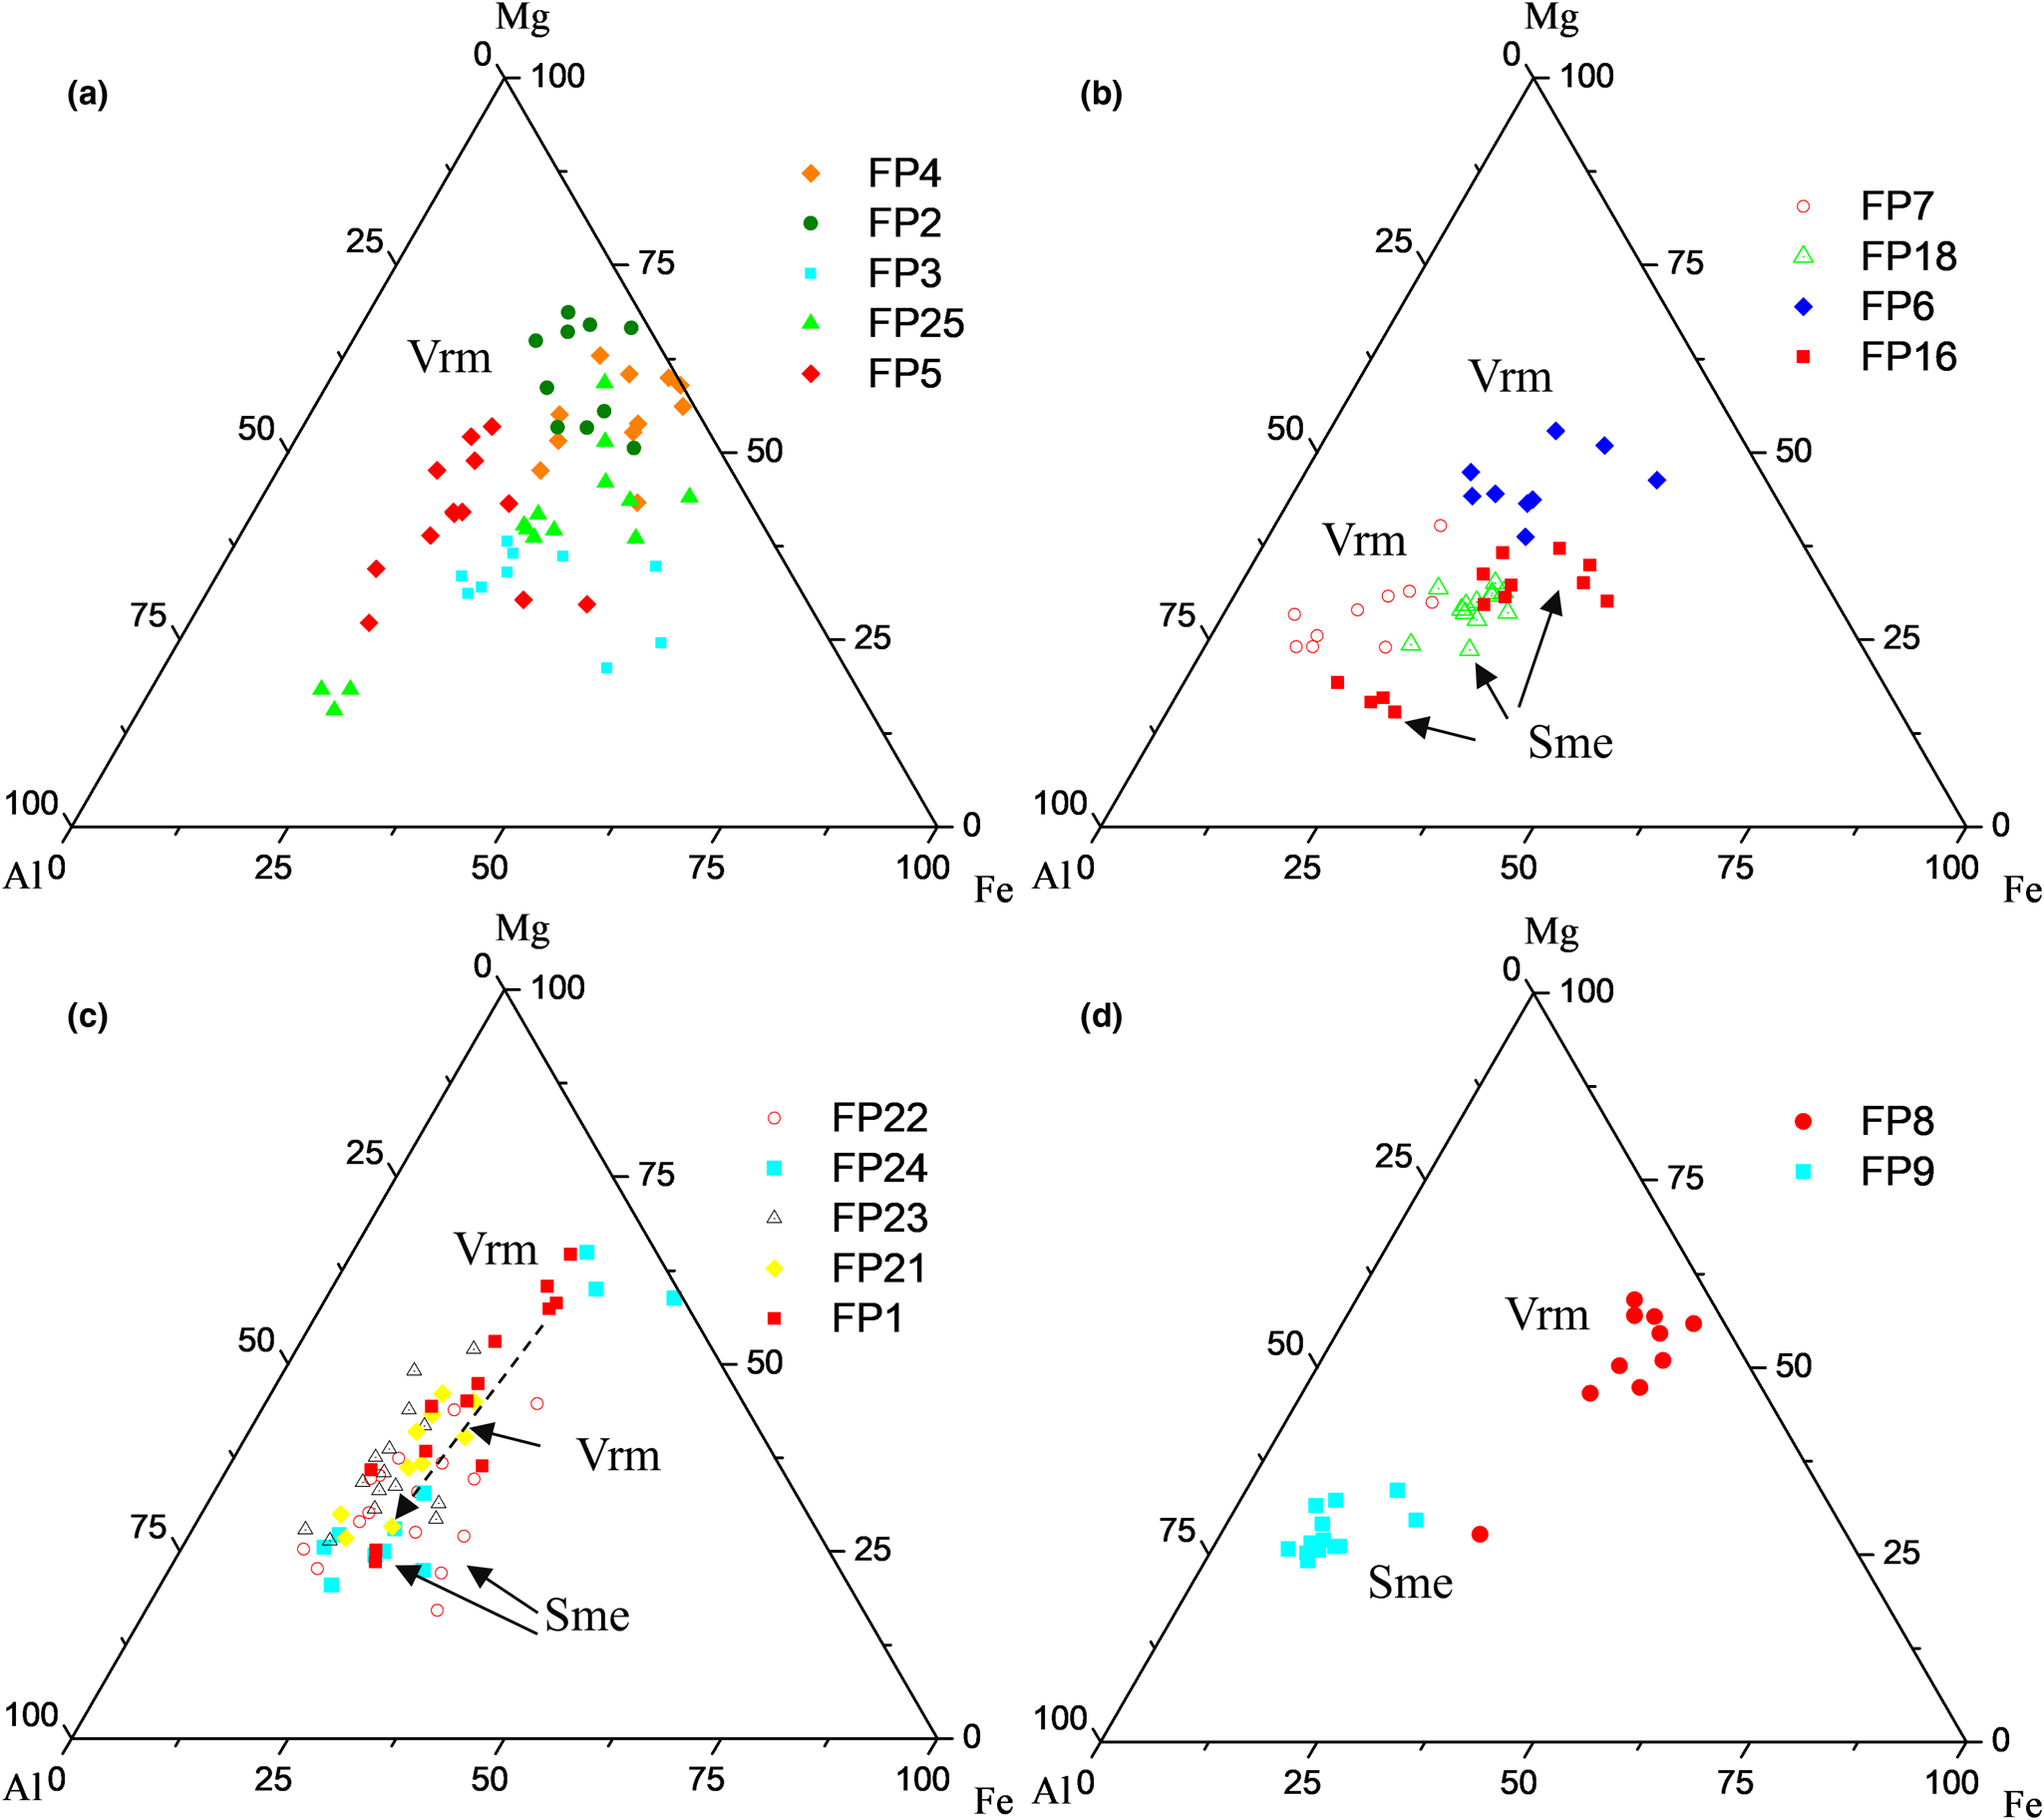
There is a marked difference between the chemical compositions of the smectites and vermiculites in samples from zone II (Fig. 9b). Vermiculites vary in composition from Mg-rich (sample FP6) to more Al-rich (sample FP7). Both samples are located on patterned ground, on the backslope and footslope, respectively, covered with moss and lichens, indicating terrain stability, but they have various compositions. However, smectite from sample FP16 constitutes a mixture of the two different compositions: one plots close to the Al vertex and the other plots in the centre of the diagram, while smectite from sample FP18 are situated between the two smectite compositions mentioned above.
On the other hand, smectites and vermiculites from zone III show a continuous chemical compositional variation following the Al–Mg axis (Fig. 9c). This is especially clear in sample FP1, which shows a continuous variation from Mg-rich saponite or vermiculite (70% mol/mol of Mg) to Al-rich smectite of the montmorillonite type (70% mol/mol of Al), suggesting a genetic relationship between both compositional phases and progressive alteration (Fig. 9c). This sample comes from soil from the west coast that is less exposed to wind than the remaining samples, where the stable terrain conditions favour soil formation. Hence, this smectite formed in a stable soil environment where favourable conditions existed for this alteration process.
Smectites and vermiculite from zone IV have a different composition with low individual variation (Fig. 9d). Chemical analysis of sample FP8, which corresponds to vermiculite, produces results that plot close to the Mg–Fe axis located on patterned ground, while smectite from sample FP9 is grouped closer to the Al vertex. The latter is from bare soil cover, with angular clasts indicating an area of accumulated soil material that was eroded from higher areas and an inherited origin.
The genetic relationship observed between vermiculite-like minerals and montmorillonite in sample FP1 as well as between the remaining samples from zone III suggests a progressive alteration and transformation process of vermiculite into smectite. The transformation of vermiculite to smectite is a gradual process resulting in a continuous series of minerals with layer charges and compositions intermediate to those of vermiculite and smectite (April et al., Reference April, Hluchy and Newton1986). Therefore, the characteristics of the vermiculites in this study, with lower tetrahedral and layer charges than typical vermiculite, would correspond to an intermediate member between the two clay minerals. Weathering of vermiculite results in a lower negative charge (Churchman, Reference Churchman1980). The smectite formed would be related closely to the primary vermiculite mineral composition and structure (Wilson, Reference Wilson2004). The positive octahedral charge obtained from most of the smectites (Tables 5 & 6)suggests that vermiculite was at least in part the precursor mineral of smectite.
In addition, smectite may form via the partial alteration of plagioclase and dissolution of glass under metamorphic and hydrothermal alteration that may affect the volcanic rocks, related to plutonic intrusions (Smellie et al., Reference Smellie, Pankhurst, Thomson and Davies1984; Queralt et al., Reference Queralt, Martí, Solé and Plana1989; Park, Reference Park1990; Hur et al., Reference Hur, Lee, Hwang and Choe2001). In this study, smectite may also have formed via alteration of plagioclase; indeed, smectite formed a thin alteration crust on the plagioclase surface. This indicates a diverse origin of smectite formation via various alteration pathways.
From the previous discussion, it can be stated that the clay mineral composition in the soils of Fildes Peninsula is complex. The clay minerals are related to the parent material, which was affected by metamorphism and hydrothermal alteration. This process might have transformed biotite and chlorite into vermiculite via interstratified chlorite-vermiculite. Furthermore, this process and/or ongoing surface weathering might have transformed vermiculite into smectite by a gradual process with an intermediate composition between the vermiculite and smectite. The structural characteristics of most of the studied smectites suggest that vermiculite was at least in part the precursor smectite. Subsequent periglacial and paraglacial processes as well as the meteorological conditions within the South Shetland Islands would have affected further transformation to the various clay minerals.
The greatest chemical compositional variation was observed in samples closer to the current front, composed mainly of vermiculite, where the soils were developed from a mixture of initially glacially transported volcanic rocks and periglacial and fluvial processes. Clay minerals from the centre and south of Fildes Peninsula were mainly a mixture of di- and tri-octahedral smectites or vermiculite, as well as chlorite and corrensite in various proportions. In contrast, clay minerals in soils developed on the west coast of Fildes Peninsula are a mixture of smectite and vermiculite.
Conclusions
The studied soil samples show significant contents of phyllosilicates, with vermiculite and smectite being the major clay mineral phases. The exceptions were six soil samples composed mostly of chlorite, mainly for soils from the east coast of Fildes Peninsula.
Volcanic rocks from Fildes Peninsula were affected by low-grade metamorphism and hydrothermal alteration that might have transformed biotite and chlorite into vermiculite probably via interstratified chlorite-vermiculite. Furthermore, this process and/or surface weathering might have transformed vermiculite into smectite gradually, with an intermediate composition between the end-members vermiculite and smectite. The structural characteristics of most of the studied smectites suggest that vermiculite was at least in part the precursor mineral of smectite.
Clay minerals from samples closer to the current glaciar front with great chemical compositional variation are composed mainly of vermiculite. In this zone, the soils were developed from a mixture of initially glacially transported volcanic rocks and periglacial and fluvial processes that became more active once the area became ice-free. Clay minerals from the centre and south of Files Peninsula are mixtures of di- and tri-octahedral smectites, vermiculite and chlorite. However, clay minerals in soils developed on andesitic basaltic rocks from the west coast of Fildes Peninsula represent a mixture of Fe-rich montmorillonite and trioctahedral smectite or vermiculite.
Acknowledgements
The authors acknowledge the logistical support provided by the National Antarctic Programmes of Spain and Chile. Furthermore, the authors acknowledge that the XRD analyses were carried out in the Research Assistance Centre (CAI) of the Geological Techniques Unit (Complutense University of Madrid) and the TEM analyses were carried out in the Electronic Microscopy National Center of the Complutense University of Madrid (UCM). The authors thank Dr Emilia García Romero from the Department of Mineralogy and Petrology of the Faculty of Geological Sciences of the UCM for her comments and suggestions, Raul Saldaña for the analytical determinations and the editors and reviewers for their helpful and constructive comments, which have contributed to improving the manuscript.
Financial support
This work was supported by the Projects CTM 2014-57119-R, RTI2018-098099-B-I00 and PID2021-125778OB-I00 of the Spanish R&D National Plan, financed by the Spanish Ministry of Science and Innovation.