Obesity has been considered a universal public health problem that affects both developed and developing countries and is currently described as a global epidemic(Reference Saneei, Esmaillzadeh and Keshteli1). In this regard, the American Medical Association has classified obesity as a disease(Reference Albracht-Schulte, Kalupahana and Ramalingam2). According to the latest data from the WHO in 2022, the prevalence of overweight/obesity (BMI ≥ 25) was 62·3 %, with obesity (BMI ≥ 30) alone at 25·3 % in Iran(3). Adipose tissue secretes signalling molecules, most of which are effective in causing inflammation. As a result, the medical complications of obesity are extensive, including metabolic syndrome, diabetes mellitus, CVD, stroke and some cancers(Reference Raymond and Morrow4). Also, obesity affects self-esteem and has adverse effects on cognitive and social behaviour(Reference Saneei, Esmaillzadeh and Keshteli1). The causes of obesity are complex, involving interactions between genetics, environment, psychological and lifestyle factors(Reference Ahluwalia5,Reference Lifshitz and Lifshitz6) . In many modern societies, work and social lifestyles have led to irregular sleep and food intake patterns, resulting in disturbance in coordination between the biological day/active phase (e.g. being active and eating during nighttime) and the metabolic processes (e.g. glucose tolerance, endocrine regulation or immune functions)(Reference Ahluwalia5,Reference Jiang and Turek7) .
The daily cycle of light and darkness influences rhythmic changes in behaviour and physiology(Reference Vitaterna, Takahashi and Turek8). The system that regulates and controls circadian rhythms is called a biological clock. The biological clock comprises a central clock in the brain’s suprachiasmatic nucleus and peripheral clocks in nearly every tissue and organ system(Reference Richards and Gumz9). The biological clock consists of genes and their protein products, which regulate various physiological processes throughout the body, such as hormone release, appetite and digestion(Reference Vitaterna, Takahashi and Turek8,Reference Moon, Kang and Kim10) . Recent studies in nutritional epidemiology suggest that the time of eating, known as chrono-nutrition, may be as important as what we eat in relation to diseases and obesity(Reference Al Abdi, Andreou and Papageorgiou11). Chrono-nutrition refers to the interaction between temporal eating patterns and endogenous circadian rhythms, which can potentially affect outcomes such as metabolism(Reference Franzago, Alessandrelli and Notarangelo12,Reference Raji, Kyeremah and Sears13) . Chrono-nutrition contains three aspects of time: (1) meal irregularity, (2) meal timing and (3) meal frequency(Reference Al Abdi, Andreou and Papageorgiou11). The results of review studies have shown that mealtime irregularity, by affecting the circadian rhythm, causes dysfunction in metabolic processes such as glycolysis, glycogenesis and fat metabolism in animal and cellular studies(Reference Pot, Almoosawi and Stephen14,Reference Maury, Ramsey and Bass15) . Also, a recent systematic review indicated that an irregular meal pattern (between-day variability in meal frequency) was associated with higher body weight(Reference Ali, Macdonald and Taylor16). A large sample-sized study among Iranian adults showed that an irregular meal pattern (the majority ate two meals per d with between-day irregularity in meal timing) was associated with higher odds of BMI ≥ 25 compared with those with a regular meal pattern (the majority ate three meals per d with between-day regularity in meal timing)(Reference Saneei, Esmaillzadeh and Keshteli1). A cross-sectional study in South Korea has indicated an inverse relationship between meal frequency and the prevalence of abdominal obesity, high blood pressure and high TAG only in men. Additionally, men who consumed most of their calories at night had a 48 % higher prevalence of metabolic syndrome compared with those who did not eat at night(Reference Ha and Song17). In Iran, few studies assessed chrono-nutrition with abdominal obesity and adiposity. Jayedi et al. found that those who ate their breakfast earlier while eating dinner later had a lower likelihood of obesity compared with the ‘Conventional’ pattern(Reference Jayedi, Shafiei Neyestanak and Djafarian18). Azizi et al. assessed the changes in mean waist circumference (WC) across the main meal, snack and eating occasion (EO) frequency. They found a significant relationship only between higher EO frequency and an increase in WC(Reference Azizi, Shab-Bidar and Bazshahi19). However, in the Zeraattalab-Motlagh et al. study, there was no significant association between EO frequency, nightly fasting duration and time of the first and last EO with higher odds of abdominal obesity(Reference Zeraattalab-Motlagh, Lesani and Janbozorgi20). Our research found no published reports on the association of chrono-nutrition components with anthropometric measures and body composition in any population in a dose–response manner. In total, there are no studies in Iran regarding the association between chrono-nutrition and body composition.
Studies around chrono-nutrition and body composition are limited, and more research is needed in this regard. The relationship between chrono-nutrition and obesity has been studied, but there are limited studies on this in developing countries like Iran. Socio-economic status and lifestyle factors such as shift work, sleep, stress, physical activity, age, income, food access and pollution differ among developing and developed countries, and these all have an impact on dietary factors and, in particular, chrono-nutrition(Reference Pot21). Moreover, due to the insufficient discriminative accuracy of BMI and WC(Reference Chen, Guo and Yu22,Reference Pietrobelli and Caballero23) , we included new anthropometric indices, such as the body adiposity index (BAI), body roundness index (BRI) and a body shape index (ABSI), which have been developed to better understand the relationship between body composition and disease. Research has shown that these indices are linked to cardiovascular and metabolic risk factors(Reference Bertoli, Leone and Krakauer24–Reference Bergman, Stefanovski and Buchanan26). Therefore, this study aims to investigate the association of chrono-nutrition components with anthropometric measures and body composition in apparently healthy adults living in Tehran. Additionally, we aimed to evaluate the dose–response relationship between chrono-nutrition components and the outcomes of the study.
Methods
Study design and participants
This cross-sectional study was carried out from October 2021 to February 2023 on 450 apparently healthy (based on self-report) men and women in Tehran, Iran, who attended the Academic Jihad of Medical Sciences, University of Tehran. The study participants were recruited using a convenient sampling strategy due to the limitations imposed by COVID-19. A sample size of 408 participants was calculated based on the mean BMI in Iran using the formula n =
 ${{{{\left( {{Z_1} - \;{\alpha \over 2}} \right)}^2}\; \times \;S{D^2}} \over {{d^2}}}$
, with 10 % attrition, resulting in 450 participants(Reference Bahadoran, Mirmiran and Mirzaee27). The inclusion criteria were 20–59-year-old men and women with a BMI between 17 and 40 who reside in Tehran. The exclusion criteria were pregnancy, lactation, following a specific dietary plan and having a specific disease such as Alzheimer’s, Parkinson’s, chronic liver or kidney diseases, insulin therapy, rheumatoid arthritis and a history of stroke (based on the person’s statement).
Data collection
Data were collected from each person by a face-to-face interview. Demographic characteristics were collected using a questionnaire including age, sex, education (under diploma and diploma, university), occupation (employed, unemployed or retired), marriage status (single, married), living status (with someone, alone), smoking usage, supplement usage and morbidity prevalence (having chronic diseases).
Anthropometric measurements
The height was measured while the subjects stood without shoes, with their backs to the wall and a 1 mm accurate tape measure fixed to the wall(Reference Lohman, Roche and Martorell28). A segmental body composition analyser (Tanita BC-418) was used to measure weight with an accuracy of 100 g and body composition including a percentage of body fat (PBF), fat mass (FM), fat-free mass (FFM), muscle mass (MM) and total body water. Participants were hydrated, without shoes and wearing just the barest minimum of clothing. We suggested no exercising for the last 4–6 h and no caffeine, alcohol or diuretics for the last 24 h before measurement. BMI was calculated by dividing weight in kilograms by the square of height in metres. WC was measured using a non-stretchable fibreglass measuring tape at the midpoint between the lower border of the rib cage and the iliac crest, while hip circumference was measured at the largest circumference around the buttocks(Reference Lohman, Roche and Martorell28). Neck circumference (NC) was measured at mid-neck, between the mid-cervical spine and the mid-anterior neck, on subjects standing upright and facing forwards, with shoulders relaxed. Waist:hip ratio (WHR) and waist:height ratio (WHtR) were calculated for each person.
The BAI was proposed by Bergman et al. in 2011. It is calculated using hip circumference and height (BAI = hip circumference (cm) divided by (height (m))1·5 minus 18) and aims to estimate the PBF(Reference Bergman, Stefanovski and Buchanan26). The BRI is a predictor of the PBF and visceral adipose tissue and can be used as a visual tool for evaluating health status. It is calculated through the following formula(Reference Thomas, Bredlau and Bosy-Westphal29):
 $${\rm{BRI}} = 364\cdot2-365\cdot5 \times \sqrt {1 - \;{{{{\left( {{{WC} \over {2\pi }}} \right)}^2}} \over {{{\left( {0 \cdot 5 \times height} \right)}^2}}}} $$
Also, ABSI appeared to be a substantial risk factor for premature mortality in the general population using weight, height and WC(Reference Krakauer and Krakauer30):
 $${\rm{ABSI}} = {{WC} \over {BM{I^{2/3}}heigh{t^{1/2}}}}$$
Dietary intake assessment
Dietary intake, supplement usage and water consumption were assessed with three 24-h dietary recalls on non-consecutive days by qualified dietitians. The first 24-h dietary recall was recorded during the visit to the centre. On random days, the subsequent recalls were collected over the phone. Daily intakes of all food items, derived from three 24-h dietary recalls, were converted into grams per d by using household measures(Reference Ghaffarpour, Houshiar-Rad and Kianfar31). The Nutritionist IV software (First Databank), modified for Iranian foods, computed the amount of total energy and macro- and micronutrient intakes.
Chrono-nutrition components
As mentioned, chrono-nutrition contains three aspects of time: meal timing, frequency and irregularity(Reference Al Abdi, Andreou and Papageorgiou11). The time of each EO, sleeping and waking up was asked through the 24-h recalls. An individual EO contains a minimum energy content of 50 kcal and is separated in time from the preceding and succeeding EO by 60 min(Reference Leech, Worsley and Timperio32). Main meals were defined as the largest EO (in terms of energy, kcal) occurring between 05.00 and 11.00 hours for breakfast, 12.00 and 16.00 hours for lunch and 17.00 and 23.00 hours for dinner. All other EO occurring within or outside these times were considered snacks(Reference Kahleova, Lloren and Mashchak33). Meal frequency was reported based on the mean number of EO in 3 d.
The intra-class correlation coefficients were used to examine individual meal regularity within a participant across 3 d(Reference McGraw and Wong34). The strength of intra-class correlation coefficient scores was defined using the following criteria: slight (0·00–0·20), fair (0·21–0·40), moderate (0·41–0·60), substantial (0·61–0·80) and almost perfect (0·81–1·00)(Reference Landis and Koch35). For further analysis, we used the Composite Phase Deviation (CPD) metric(Reference McHill, Hilditch and Fischer36). The CPD combines two components: (1) the regularity component, how different meal timing is compared with the previous day, and (2) the alignment component, how different meal timing is compared with the daily mean. The CPD score shows the average deviation in hours from a perfectly regular pattern of meal timing.
 $$\Delta {\rm{Regularit}}{{\rm{y}}_{\rm{i}}}\left( {\Delta {\rm{D}}{{\rm{D}}_{\rm{i}}}} \right)\, = \,{\rm{Meal timin}}{{\rm{g}}_{{\rm{i}}-1\,}}-\,{\rm{Meal timin}}{{\rm{g}}_{\rm{i}}}$$
 $$\Delta {\rm{Alignmen}}{{\rm{t}}_{\rm{i}}}\left( {\Delta {\rm{A}}{{\rm{T}}_{\rm{i}}}} \right)\, = \,{\rm{Average meal timing}}\,-\,{\rm{Meal timin}}{{\rm{g}}_{\rm{i}}}$$
 $${\rm{CP}}{{\rm{D}}_{\rm{i}}}\, = \sqrt {\Delta DD_i^2\; + \;\Delta AT_i^2} $$
 $${\rm{CPD}} = {1 \over N}\;\sum\nolimits_{i = 1}^N C P{D_i}$$
In the formula, DD stands for day-to-day, AT is for average timing, i represents a given day and N is the total number of days. The higher CPD means a greater irregularity of meal timing.
Additionally, we calculated breakfast skipping, night fasting duration, time of the first and last EO and the time interval from the last meal to bed. Breakfast skipping refers to not having breakfast on at least one of the 3 d of the 24-h dietary recall. Night fasting duration is the period between the time of the first EO of the day and the time of the last EO of the night before. Lastly, the time interval from the last meal to bed is the period between the time of the last EO and the sleeping time.
Physical activity assessment
Physical activity was measured using the validated short form of the International Physical Activity Questionnaire(Reference Vasheghani-Farahani, Tahmasbi and Asheri37). Participants reported the time spent on vigorous and moderate activities and walking within the previous 7 d. The total score was calculated in metabolic equivalent minutes per week (MET-min/week). Then, MET scores were classified into three levels of physical activity: < 600 MET-min/week as low, 600–3000 MET-min/week as moderate and > 3000 MET-min/week as high(Reference Fan, Lyu and He38).
Sleep quality assessment
We used the validated Pittsburgh Sleep Quality Index in this study(Reference Farrahi Moghaddam, Nakhaee and Sheibani39). It is a self-rated questionnaire that assesses sleep quality and disturbances over a month. The questionnaire has five questions, but since the fifth contains ten sub-items, the whole questionnaire has nineteen items, and every item was scaled from 0 to 3. The questionnaire differentiates ‘poor’ from ‘good’ sleep quality by measuring seven components: subjective sleep quality, sleep latency, sleep duration, habitual sleep efficiency, sleep disturbances, use of sleeping medications and daytime dysfunction over the last month(Reference Buysse, Reynolds and Monk40).
Chronotype assessment
We used the Morningness-Eveningness Questionnaire, developed by Horne and Ostberg(Reference Horne and Ostberg41), which was validated for chronotype assessment among Iranians(Reference Rahafar, Jujilee and Sadeghpour42). The questionnaire contains nineteen questions about daily functionality and sleep-related behaviours, such as sleep time preferences and sleep duration. The higher scores indicate a preference for morningness, whereas lower scores show a tendency toward eveningness. Subjects were categorised into three groups – morning-type, intermediate-type and evening-type – based on their scores(Reference Chung, Chang and Yang43).
Mental health assessment
We used the validated short form of the Depression, Anxiety and Stress Scale-21(Reference Asghari, Saed and Dibajnia44). It is a self-report questionnaire measuring negative emotional states in depression, anxiety and stress and determines the severity of each. Each subscale of the questionnaire consists of seven questions, and the final score of each is obtained through the sum of the scores of the related questions. Its interpretation is classified from normal (low score) to mild, moderate, severe and extremely severe (higher scores)(Reference Lovibond and Lovibond45).
Blood pressure assessment
Blood pressure was measured by a digital barometer (BC 08, Beurer, Germany) after at least 10–15 min of rest and sitting. It was measured twice for every person, and the average of the two measurements was reported for each person.
Statistical analysis
Statistical analysis was performed using SPSS version 27. Numerical data were reported as mean (sd), and categorical data were reported as number (per cent). The Kolmogorov–Smirnov test was used to determine the normal distribution of the data. Levene’s test was used to assess the equality of variances across different groups of exposure. In order to assess multicollinearity among the independent variables, the variance inflation factor analysis was conducted. Variance inflation factor values were calculated to evaluate the degree of correlation between the independent variables. To examine individual meal regularity within a participant across three 24-h dietary recalls, we used intra-class correlation coefficient (two-way random model, consistency type)(Reference McGraw and Wong34). For further analysis, we used the CPD metric to calculate the individual’s meal irregularity(Reference McHill, Hilditch and Fischer36). General characteristics, anthropometric measures, body composition and chrono-nutrition components of the participants were compared between either sex by using a χ 2 test for categorical variables and a t test for numerical variables. Each chrono-nutrition component was divided into tertiles to ensure adequate sample sizes and statistical power for analysis. We used the ANCOVA to determine the association between anthropometric measures and body composition in the tertiles of the chrono-nutrition components (meal frequency, meal timing, meal irregularity, breakfast skipping, night fasting duration, time of the first and last EO and the time interval from the last meal to bed) after controlling for the confounding variables based on previous studies(Reference Jayedi, Shafiei Neyestanak and Djafarian18,Reference Kahleova, Lloren and Mashchak33,Reference Lesani, Barkhidarian and Jafarzadeh46–Reference Xiao, Garaulet and Scheer48) included age, sex, education, occupation, marriage status, living status, menopause, smoking, supplement usage, morbidity status, physical activity, chronotype, sleep quality, mental health and total energy intake. In addition, for each exposure, we controlled other exposures as confounding variables. We calculated the P-ANCOVA to determine whether there is a significant difference or relationship and the P-trend to assess the significance of a linear trend in the outcome variable across ordered categories of the chrono-nutrition components. A significant P-trend suggests a statistically significant linear trend (a clear direction or pattern) in the outcome variable across the ordered categories of the exposure variable. The significance of the P-ANCOVA and P-trend was calculated as less than 0·004 due to Bonferroni correction, where 0·05 was divided by the number of study outcomes (BMI, WC, NC, WHR, WHtR, BAI, BRI, ABSI, PBF, FM, FFM and MM).
Finally, we used STATA 17 software to investigate the dose–response relationship between meal timing and night fasting duration with study outcomes. Restricted cubic splines were utilised to assess the non-linear relationship on a continuous scale, with the restricted cubic spline curves derived from the fully adjusted means of outcomes. The restricted cubic spline models were adjusted for the same confounding variables as noted in the ANCOVA. Dose–response analysis was not performed for lunch time due to the lack of significant differences between the hours of its categories.
Results
Characteristics of the study participants
In this study, of 450 participants, six were excluded due to over- or under-reporting (energy intake < 500 and < 800 kcal/d or > 3500 and > 4000 kcal/d in women and men, respectively)(Reference Mendez, Popkin and Buckland49). The general characteristics of the study participants are presented in online Supplementary Table 1. The mean (sd)(Reference Baveicy, Mostafaei and Darbandi50) age of the 444 participants (204 men and 240 women) was 38·24 (sd 9·67) years. In general, most subjects had a university education (79·4 % men and 82·5 % women), were employed (88·2 % men and 63·8 % women), married (75 % men and 52·1 % women), non-smokers (88·2 % men and 96·7 % women) and healthy in appearance (73·5 % men and 81·7 % women). Women had a lower physical activity level (39·2 % men and 51·7 % women; P-value = 0·031), poorer sleep quality (35·3 % men and 52·1 women; P-value < 0·001), more severe depression (7·8 % men and 19·2 % women; P-value = 0·003), anxiety (15·2 % men and 28·8 women; P-value = 0·003) and stress (13·2 % men and 22·5 % women; P-value = 0·008) significantly.
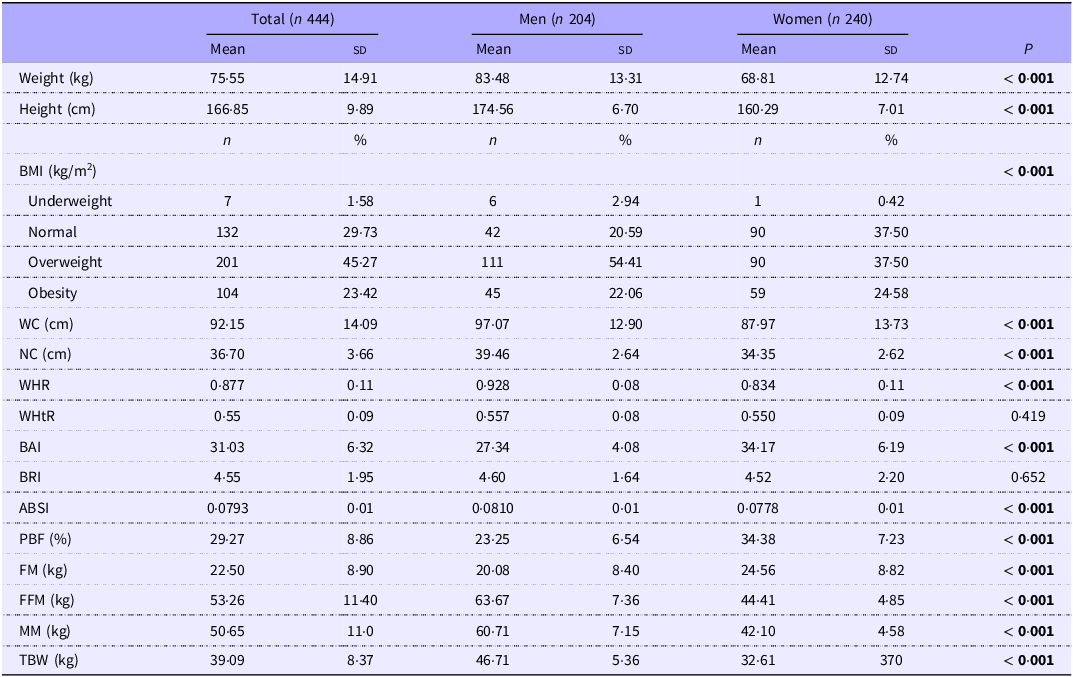
In Table 1, we show the anthropometric measures and body composition characteristics of study participants. Around 30 % of participants had a normal BMI (18·5 ≤ BMI < 25), 1·6 % were underweight (BMI < 18·5), 45·3 % were overweight (25 ≤ BMI < 30) and 23·4 % were obese (BMI ≥ 30).
Anthropometric measures and body composition characteristics of study participants

WC, waist circumference; NC, neck circumference; WHR, waist:hip ratio; WHtR, waist: height ratio; BAI, body adiposity index; BRI, body roundness index; ABSI, a body shape index; PBF, percentage of body fat; FM, fat mass; FFM, fat-free mass; MM, muscle mass; TBW, total body water.
Values are based on mean (sd) for numerical variables or number (%) for categorical variables.
Values were obtained using the χ 2 test for categorical variables and the independent t test for numerical variables, and P-value < 0.05 indicates a significant level.
Chrono-nutrition components
The mean and sd of main meal and snack times by sex among study participants are shown in online Supplementary Table 2. The mean times for breakfast, lunch and dinner among the subjects were 08.38, 13.42 and 20.47, respectively. Women tended to have breakfast significantly later (P-value = 0·049) compared with men, while men ate dinner at a later time (P-value = 0·022).
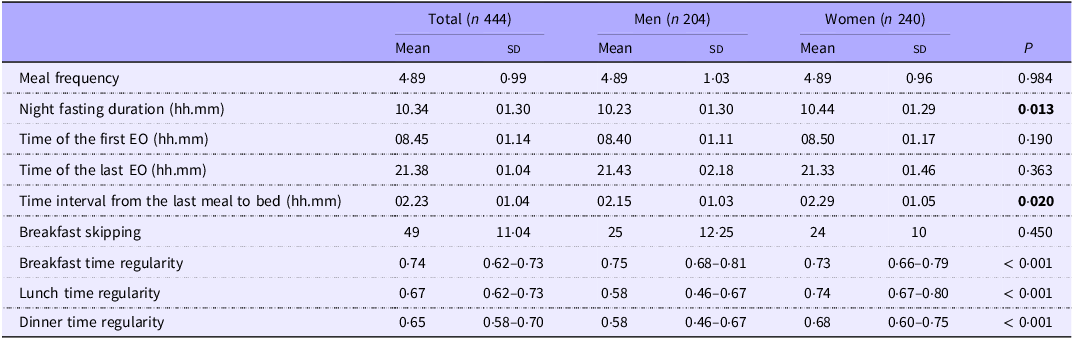
We present the chrono-nutrition components by sex for study participants in Table 2. In sum, meal frequency ranged from 1 to 10, with a mean of 4·89 (sd 0·99) times. The duration of night fasting ranged from 05.30 to 15.10. Out of the forty-nine participants, three did not have breakfast during any of the three 24-h dietary recalls, while forty-six had breakfast at least once. There was a significant difference between women and men for night fasting duration (10.23 in men and 10.44 in women; P = 0·013) and the time interval from the last meal to bed (02.15 in men and 02.29 in women; P = 0·020), which were higher in women. The intra-class correlation coefficients of the main meals ranged from 0·61 to 0·80, which indicates the substantial meal regularity.
Chrono-nutrition components of the study participants

EO, eating occasion; ICC, intra-class correlation coefficient.
Values, aside from meal time regularity, are based on mean (sd) and intra-class correlation coefficient (95% confidence interval) for regularity variables.
Values, except for meal time regularity, were obtained using the χ 2 test for categorical variables and the independent t test for numerical variables, and P-value < 0.05 indicates a significant level. Meal time regularity was calculated using the intra-class correlation coefficient.
Association of chrono-nutrition components and anthropometric measures and body composition
Before conducting ANCOVA, several assumptions were assessed to ensure the validity of the results. Levene’s test, with resulting P-values higher than 0·05, ensured homogeneity of variances across chrono-nutrition components. The normal distribution of residuals was validated using the Kolmogorov–Smirnov test, supported by P-values greater than 0·05, and Scatterplots confirmed linearity between the dependent variable and continuous covariates. Also, the consistency of the relationship between each continuous covariate and the dependent variable across chrono-nutrition components verified the assumption of homogeneity of regression slopes. At last, the variance inflation factors were within a moderate multicollinearity range (1 < variance inflation factor < 5), indicating no issues with multicollinearity(Reference Kim51).
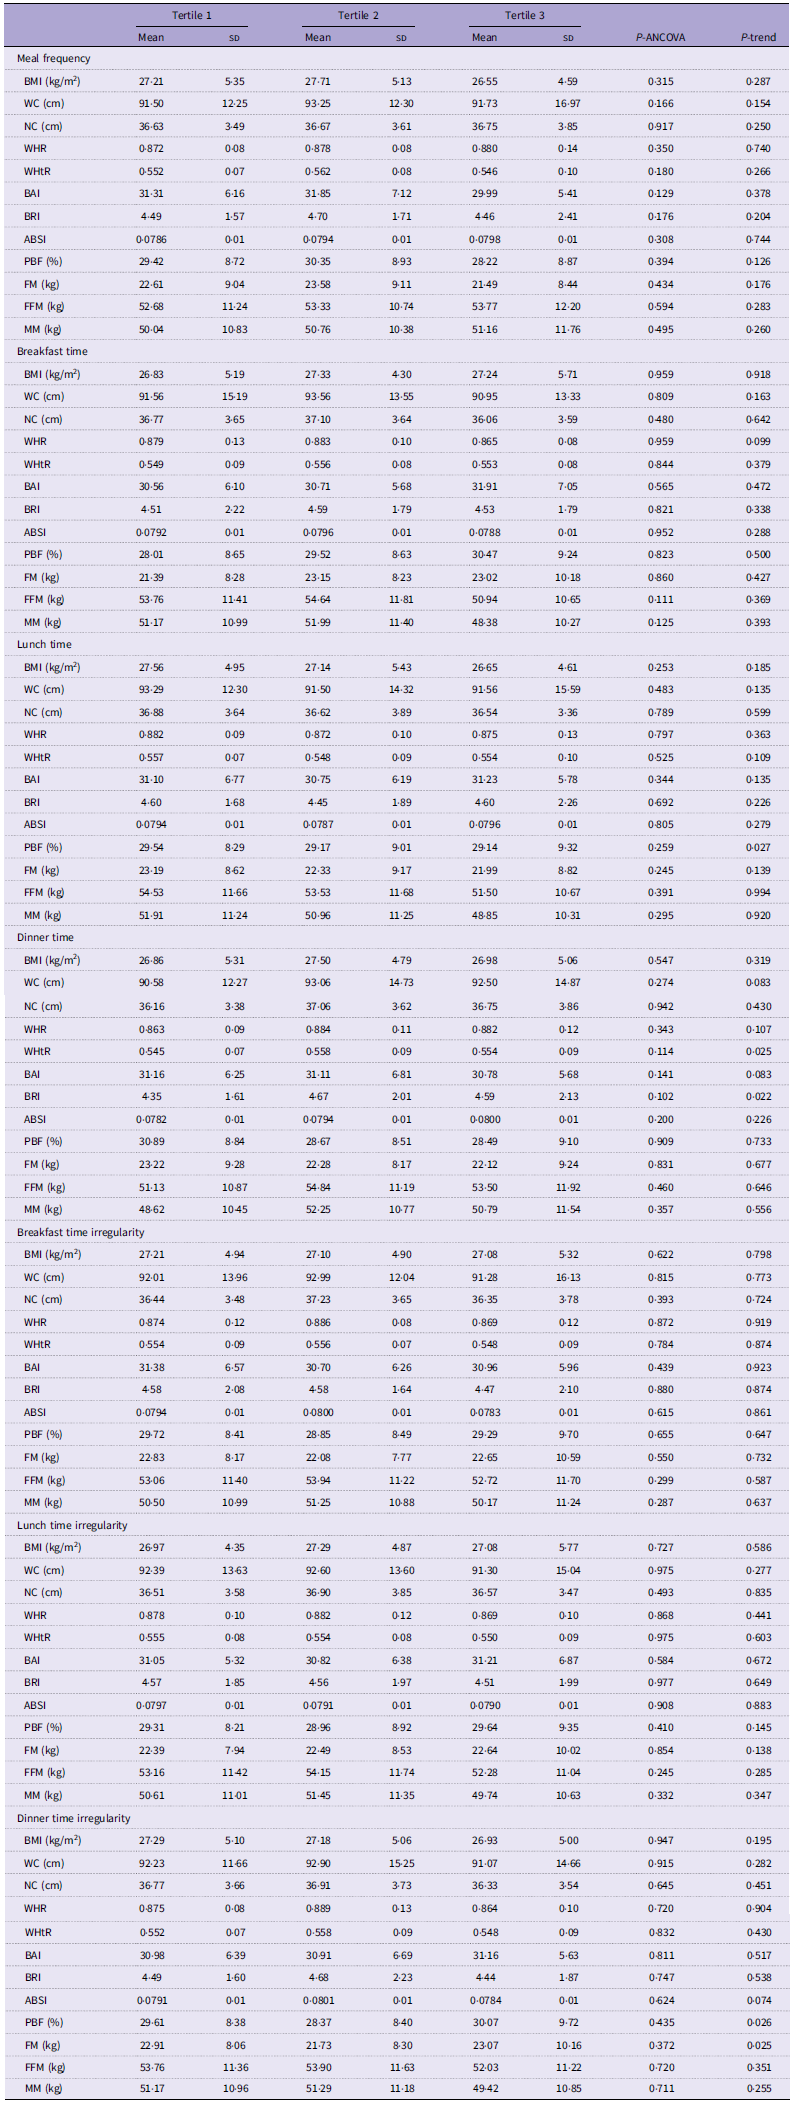
We used the ANCOVA test to assess the association between chrono-nutrition components with anthropometric measures and body composition. Table 3 shows the adjusted means for anthropometric measures and body composition across the tertiles of meal frequency, meal timing and meal irregularity. After adjusting for confounders, late lunch eating was associated with a lower PBF (mean difference (MD) = –0·40; P trend = 0·027). There was a significant trend across the tertiles of dinner time with greater WHtR (MD = 0·019; P trend = 0·025) and BRI (MD = 0·24; P trend = 0·022). Moreover, increased irregularity at dinner time was associated with higher levels of PBF (MD = 0·46; P trend = 0·026) and FM (MD = 0·16; P trend = 0·025). However, after applying the Bonferroni correction, these associations were lost, and there was no significant difference between meal frequency, breakfast time, lunch time, dinner time, breakfast time irregularity, lunch time irregularity and dinner time irregularity with BMI, WC, NC, WHR, WHtR, BAI, BRI, ABSI, PBF, FM, FFM and MM.
Adjusted means for anthropometric measures and body composition across the tertiles of meal frequency, meal timing and meal irregularity

WC, waist circumference; NC, neck circumference; WHR, waist:hip ratio; WHtR, waist:height ratio; BAI, body adiposity index; BRI, body roundness index; ABSI, a body shape index; PBF, percentage of body fat; FM, fat mass; FFM, fat-free mass; MM, muscle mass.
Values are based on mean (sd).
Values were obtained using the ANCOVA.
P-value < 0·004 was considered significant.
P-value adjusted for age, sex, education, occupation, marriage status, living status, menopause, smoking, supplement usage, morbidity status, physical activity, chronotype, sleep quality, mental health and total energy intake. Plus, for each exposure, other exposures were controlled as confounding variables.
The number of participants in each tertile was as follows: meal frequency (T1: 157, T2: 134, T3: 153); breakfast time (T1: 149, T2: 162, T3: 130); lunch time (T1: 149, T2: 162, T3: 131); dinner time (T1: 135, T2: 158, T3: 151); breakfast time irregularity (T1: 148, T2: 152, T3: 144); lunch time irregularity (T1: 126, T2: 171, T3: 147); and dinner time irregularity (T1: 132, T2: 170, T3: 142).
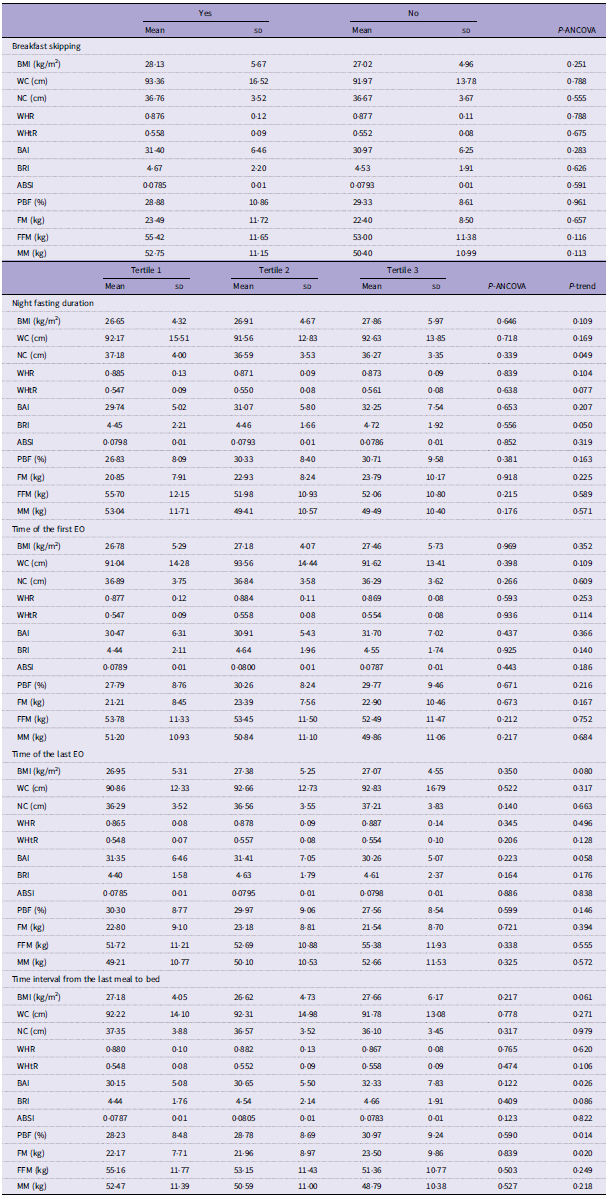
The adjusted means for anthropometric measures and body composition across the rest of the components of chrono-nutrition are indicated in Table 4. After confounders adjustment, longer overnight fasting was associated with a lower NC (MD = −0·91; P trend = 0·049) and a greater mean of BRI (MD = 0·27; P trend = 0·050). We found a statistically significant difference across the time interval from the last meal to bed with greater means of BAI (MD = 2·18; P trend = 0·026), PBF (MD = 2·74; P trend = 0·014) and FM (MD = 1·33; P trend = 0·020). However, after applying the Bonferroni correction, these associations were not retained, and there was no significant difference between breakfast skipping, night fasting duration, time of the first EO, time of the last EO and the time interval from the last meal to bed with BMI, WC, NC, WHR, WHtR, BAI, BRI, ABSI, PBF, FM, FFM and MM.
Adjusted means for anthropometric measures and body composition across the breakfast skipping and the tertiles of night fasting duration, time of the first and last EO and the time interval from the last meal to bed

WC, waist circumference; NC, neck circumference; WHR, waist:hip ratio; WHtR, waist:height ratio; BAI, body adiposity index; BRI, body roundness index; ABSI, a body shape index; PBF, percentage of body fat; FM, fat mass; FFM, fat-free mass; MM, muscle mass; EO, eating occasion.
Values are based on mean (sd).
Values were obtained using the ANCOVA.
P-value < 0·004 was considered significant.
P-value adjusted for age, sex, education, occupation, marriage status, living status, menopause, smoking, supplement usage, morbidity status, physical activity, chronotype, sleep quality, mental health and total energy intake. Plus, for each exposure, other exposures were controlled as confounding variables.
The number of participants in each tertile was as follows: breakfast skipping (Yes: 49, No: 395); night fasting duration (T1: 147, T2: 151, T3: 146); time of the first EO (T1: 146, T2: 156, T3: 142); time of the last EO (T1: 148, T2: 149, T3: 147); and time interval from the last meal to bed (T1: 147, T2: 156, T3: 141).
The dose–response relationship between meal timing and night fasting duration with anthropometric measures and body composition is indicated in online Supplementary Figures 1–36 and Supplementary Tables 3–5. After adjusting for potential confounders, a mild and positive monotonic association between late breakfast eating with BAI and FM was observed. A significant positive linear association was found between late breakfast eating with higher means of BMI and PBF. There was a non-linear inverse association between breakfast time and WC, BRI and ABSI, in which eating later was associated with lower WC, BRI and ABSI. A significant negative linear association was found between late breakfast eating with lower means of WHR and WHtR. Also, there was an inverted U-shaped curve association between breakfast time and NC, FFM and MM, with the threshold of 08.30. Concerning dinner time, we found a positive linear association in which the BMI and WHtR mean increased with later dinner time. Conversely, a negative linear association was observed for the means of FFM and MM, which decreased slightly with the increase in dinner time. We found significant positive monotonic associations between later dinner time and higher means of WC, WHR, BAI, BRI and ABSI. The significant association between dinner time with PBF and FM was plotted as a U-shaped curve, suggesting an increase of benefits until 20.30. At last, the NC mean did not change materially with the increase in dinner time. Regarding night fasting duration, a negative linear association was found for NC, in which the mean of NC decreased significantly with increasing the fasting window. A non-linear inverse association between BMI, FFM and MM with night fasting duration was found, where the mean of BMI, FFM and MM significantly decreased with increasing fasting duration until around 10.00–10.30 and then showed a slight upward curve at higher values. Moreover, a U-shaped curve association was observed between the duration of fasting at night and WC, WHR, WHtR, BAI, BRI and ABSI, showing a significant downward trend in relation to these measures until 10.30, followed by an upward trend in the later time. Finally, a significant curvilinear relationship was found between night fasting duration and PBF and FM, with an upper limit around 10.00–10.30. Higher fasting duration was associated with a lower mean of PBF and FM.
Discussion
In this cross-sectional study, late breakfast eating showed a positive association with BMI, PBF, BAI and FM, whether in a linear or monotonic shape, and a negative association with central obesity (WHR and WHtR in a linear shape and WC, BRI and ABSI in a monotonic shape). Also, breakfast time displayed an inverted U-shaped curve association with NC, FFM and MM with the highest level at 08.30. Late dinner eating showed a positive association with central obesity and its indices in both linear (BMI and WHtR) and monotonic (WC, WHR, BRI, BAI, ABSI) shapes. Regarding body composition, late dinner eating indicated a negative linear association with FFM and MM and a U-shaped association with PBF and FM, with the lowest level at 20.30. At last, long fasting duration revealed a U-shaped association with WC, WHR, WHtR, BMI, BAI, BRI, ABSI, FFM and MM and an inverse U-shaped association with FM and PBF, with apex at 10.00–10.30.
Meal frequency
The results showed no significant relationship between meal frequency and anthropometric measures and body composition. Commonly, it is recommended to eat frequent meals in small sizes for a better lifestyle and weight maintenance. The proposed mechanisms are better control of appetite, improved glucose regulation and increased thermal effect of food(Reference Schoenfeld, Aragon and Krieger52). However, similar to our findings, a study among Tehranian adults found no significant relationship between EO frequency of less than four and more than four and the odds of WC changes(Reference Zeraattalab-Motlagh, Lesani and Janbozorgi20). On the contrary, in another study on the same population, EO frequency was divided into less than five, between six and seven and more than seven, and the mean WC showed a significant increase during the higher EO frequency. However, no significance was observed between main meal frequency and snack frequency with WC(Reference Azizi, Shab-Bidar and Bazshahi19). In a cross-sectional study on 14 000 healthy Korean adults, the odds of WC decreased with the increase in EO frequency in men, but the chance of higher BMI did not change significantly across the quartiles of the EO frequency(Reference Ha and Song17). In a cohort study among Canadian and American adults, those who ate one or two meals per d significantly had a lower BMI than those who ate three meals per d. However, there was a relative increase in BMI in people who ate more than three meals and consumed snacks(Reference Kahleova, Lloren and Mashchak33). It should be noted that observational studies used different definitions of EO, which could cause the differences in results.
Investigations on intervention studies showed that a reduction in EO frequency and energy intake simultaneously causes better weight loss, but a reduction in EO frequency solely has no effect on weight(Reference St-Onge, Ard and Baskin53,Reference Varady54) . A clinical trial study showed that consuming one meal per d compared with three meals significantly reduced the cortisol concentration, which consequently caused more hunger, desire to eat and less satiety. Therefore, reducing the EO frequency without reducing the energy intake does not have many health benefits(Reference Stote, Baer and Spears55). In addition, an intervention study on women with overweight and obesity who all followed a certain weight loss programme showed no significant difference between the two groups of three meals and six meals per d with weight, WC, BMI, PBF, FM and FFM(Reference Yildiran and Mercanligil56).
Meal timing
The results showed no significant association between the eating time of breakfast, lunch and dinner with anthropometric measures and body composition. Similar to our findings, a cohort in America studied the mean time of breakfast, lunch and dinner across the BMI category and found no significance(Reference Xiao, Garaulet and Scheer48). Also, McHill et al. showed there is no significant difference between meal timing and FM(Reference McHill, Phillips and Czeisler57). An intervention study among healthy Spanish women with normal BMI under a weight maintenance diet with two different lunch times (13.00 v. 16.30) showed that a delay of 3.5 hours in lunch time does not affect the body weight(Reference Bandín, Scheer and Luque58). However, in the Garaulet et al. study, 420 participants followed a Mediterranean weight loss diet and were grouped into early lunch eaters and late lunch eaters. Over the 20 weeks, early lunch eaters experienced greater and faster weight loss, while both groups had the same energy and macronutrient intake, estimated energy expenditure, appetite hormones and sleep duration. Weight loss did not show a significant difference at breakfast or dinner time. Previous research linked the minor allele (G) of the CLOCK rs4580704 gene to obesity, metabolic syndrome and increased energy intake. In the Garaulet et al. study, the minor allele was significantly higher among late lunch eaters. Interestingly, sleep duration, CLOCK SNP and chronotype were not independently associated with weight loss. Also, no significant correlation was found between weight loss and chronotype within each group, suggesting that differences in weight loss between both groups were not due to a concurrent predisposition to a chronotype and the timing of food(Reference Garaulet, Gómez-Abellán and Alburquerque-Béjar59).
Desynchronising the biological clock with the environment may impact human health. The circadian system helps the body in digesting, absorbing and metabolising food more effectively early in the day (active phase). For example, insulin sensitivity, which is needed to regulate blood sugar, is higher in the morning. Therefore, eating larger meals during the first half of the day leads to better digestion and absorption. On the contrary, the melatonin hormone, which reduces insulin secretion, is secreted at night with the highest concentration at the end of the night and early in the morning. Now, if something is eaten at this time, the body may not be able to process glucose properly. Therefore, eating larger meals in the first half of the day and not consuming food a few hours before sleep may be suitable for health(Reference Manoogian, Chaix and Panda60). McHill et al. study showed that people with higher FM consume most of their calories 1.1 hours closer to the start of melatonin secretion. Also, the timing of food intake relative to melatonin onset was significantly associated with the PBF and BMI(Reference McHill, Phillips and Czeisler57). Research recommends more investigation regarding the meal timing, especially dinner(Reference St-Onge, Ard and Baskin53).
Meal irregularity
The results showed no significant association between irregularity of breakfast, lunch and dinner time with anthropometric measures and body composition. Four clinical trial studies were conducted in England, two on healthy women with normal BMI, one on healthy obese women and one on obese women with diabetes. Similar to our findings, in all four studies, there was no significant difference in body weight, WC, BMI and PBF between the two groups of regular (six meals per d with a weight maintenance diet) and irregular (3–9 meals per d with a weight maintenance diet)(Reference Alhussain, Macdonald and Taylor61–Reference Farshchi, Taylor and Macdonald64). Saneei et al. studied the regularity of main meal frequency by a questionnaire on 7958 healthy Iranian adults. Contrary to the present study, those with an irregular meal pattern had a 21, 24 and 22 % higher chance of living with overweight/obesity (BMI ≥ 25), abdominal overweight/obesity (WC ≥ 80 in women and 94 in men) and abdominal obesity (WC ≥ 88 in women and 102 in men) compared with those with a regular meal pattern(Reference Saneei, Esmaillzadeh and Keshteli1). Also, a study among healthy Korean adults found that people with breakfast skipping and irregular meal timing had higher WC and BMI compared with those with no breakfast skipping and regular meal timing(Reference Yoon, Choi and Kim65).
A review of the few available observational studies in 2016 found that meal irregularity is associated with the risk of metabolic syndrome, cardiometabolic risk factors and obesity. In 2005, discovering genes in adipose tissue with 24-h circadian rhythmicity helped researchers understand the relationship between circadian rhythms and metabolic regulation at the molecular level. For instance, the discovery of the CLOCK gene in mutant mice showed a reduction in diurnal feeding rhythm. Mice that lacked this gene had an overeating behaviour, were obese and quickly developed metabolic syndrome. It has been determined that the disturbance in the biological clock could have various molecular and biochemical effects based on genetic differences(Reference Pot, Almoosawi and Stephen14). Regular eating habits regulate the liver clock gene, the rhythm of the CYP7A1 gene and blood cholesterol through insulin secretion, which help a better lipid metabolism, even if animals ingest a high-fat diet(Reference Oda66).
Breakfast skipping
The results showed no significant association between breakfast skipping and anthropometric measures and body composition. Similar to our result, the cross-sectional study of Ha and Song showed morning eating was not associated with BMI and WC in men. However, morning eating decreased the odds of higher WC but not BMI in women(Reference Ha and Song17). Contrary to our findings, Kahleova et al. study showed that individuals who consumed breakfast had a lower BMI compared with those who skipped breakfast(Reference Kahleova, Lloren and Mashchak33). Also, in a national survey on Iranian children and adolescents, the breakfast-skipping group had a higher prevalence of overweight and obesity than those who ate breakfast regularly. Notably, the skipping group had unhealthier dietary habits compared with non-skippers. Thus, it is suggested to conduct controlled intervention trials to assess the cause-and-effect association(Reference Ahadi, Qorbani and Kelishadi67).
Observational studies found that breakfast skipping is associated with type 2 diabetes, obesity and CVD, and breakfast skippers tend to eat late at night and have poor diet quality(Reference Manoogian, Chaix and Panda60). In interventional studies, the breakfast-skipping group had more calories for dinner to compensate for their skipping and had the same energy intake as the non-skipper group, or both skippers and non-skippers consumed the same energy at lunch and dinner; thus, the skippers consumed fewer daily calories. Growing evidence shows that eating breakfast does not improve weight loss, possibly due to compensatory behaviours. On the other hand, eating breakfast can be related to a healthier eating pattern and lead to an improvement in cardiometabolic risk factors(Reference St-Onge, Ard and Baskin53). Contradictory results between observational and interventional studies suggest further research on the long-term effects of breakfast skipping(Reference Manoogian, Chaix and Panda60).
Night fasting duration
The results showed no significant association between night fasting duration and anthropometric measures and body composition. Similar to our findings, an observational study with a similar population to our study showed no relationship between night fasting longer than 11.25 hours and odds of higher WC(Reference Zeraattalab-Motlagh, Lesani and Janbozorgi20). Two observational studies, one on adults living with overweight and obesity and the other on young people, found no significant association between the eating window (time interval from the first EO to the last EO) with PBF and BMI and body composition, respectively(Reference McHill, Phillips and Czeisler57,Reference Thomas, Zaman and Cornier68) . Contrary to our results, a cross-sectional study on apparently healthy Korean adults indicated that night fasting ≥ 16 h compared with 10–12 h is associated with increased WC in both sexes and BMI in men(Reference Ha and Song17). Also, a cohort study on 50 000 people over 29 years old showed that night fasting duration ≥ 18 h compared with 12–17 h is associated with lower BMI(Reference Kahleova, Lloren and Mashchak33). A meta-analysis of interventional studies presented that following a time-restricted eating strategy, even without restriction in energy intake, can reduce body weight and FM without affecting the FFM(Reference Moon, Kang and Kim10). The inconsistency of our results with previous studies can have several reasons. Genetics, environment, lifestyle and general eating habits affect anthropometric measures and body composition, which vary in different populations(Reference Li and Qi69,Reference Podstawski, Omelan and Borysławski70) . It was impossible to measure and control all of them as confounding variables. Besides differences in the populations studied, study design, sample size, data analysis method and confounding variables varied among studies, which led to inconsistent results.
Time of the first and last EO
The results showed no significant association between the time of the first and last EO with anthropometric measures and body composition. The same to our study, a cross-sectional study among healthy Iranian adults showed no significant relationship between the time of the first and last meal with odds of greater WC(Reference Zeraattalab-Motlagh, Lesani and Janbozorgi20). Also, in the McHill et al. study, no significant difference was observed between the time of the last meal and PBF. However, obese people ate later their last EO relative to a dim-light melatonin onset compared with the lean group(Reference McHill, Phillips and Czeisler57). Moreover, in the Thomas et al. study, no significance was observed between the time of the last EO with BMI and PBF. The time of the first EO was not related to the BMI, but for every 1 h later start of eating, there was a 1·25 unit increase in PBF(Reference Thomas, Zaman and Cornier68). A clinical trial study was conducted on healthy women living with overweight and obesity who went on a weight loss diet. Contrary to our findings, the early evening meal group (eating from 19.00 to 19.30) had a greater reduction in body weight, BMI and WC compared with the late evening meal group (eating from 22.30 to 23.00)(Reference Madjd, Taylor and Delavari71). According to the research, the late eating pattern affects circadian genes such as SIRT1 and CLOCK, resulting in weight gain and resistance to weight loss. Based on the evidence, people who carry minor alleles at both SIRT1 and CLOCK loci are significantly resistant to weight loss, which is associated with late evening preference. However, further studies are needed to investigate the mechanism of these results(Reference Madjd, Taylor and Delavari71).
Time interval from the last meal to bed
The results showed no significant association between the time interval from the last meal to bed and anthropometric measures and body composition. The Saneei et al. study on almost 8000 Iranian adults showed no significant difference between the time interval from the last meal to bed with the mean body weight, BMI and WC(Reference Saneei, Esmaillzadeh and Keshteli1). In contrast, a cohort study on middle-to-older American adults presented that the mean of the time interval from dinner to bed significantly increased across the tertile of BMI(Reference Xiao, Garaulet and Scheer48). There were few studies in this field, and more investigation would be needed.
Strengths and limitations
This study is the first to evaluate the association between chrono-nutrition components and body composition in Iran. For the final analysis, we controlled for a large number of confounders, and the proportion of women and men was almost equal. Also, this study is adequately powered, having collected more samples than initially calculated, and the prevalence rates of overweight and obesity are nearly consistent with established data from the WHO.
However, the present study has some limitations. The first issue is related to the cross-sectional nature of the study, which makes it impossible to establish a cause-and-effect relationship, and the findings need to be confirmed in prospective studies. Additionally, using a 24-h recall questionnaire may cause errors in recalling information because its accuracy depends on people’s memory. Furthermore, due to a convenient sampling, our population is not representative of the Tehran population, so we can’t generalise the results to the entire population. At last, the study population included apparently healthy individuals who self-reported their health status, while some may have undiagnosed diseases.
Conclusion
Based on the results, there is no significant association between the chrono-nutrition components (meal frequency, meal timing, meal irregularity, breakfast skipping, night fasting duration, time of the first and last EO and the time interval from the last meal to bed) with anthropometric measures and body composition. According to the limitations of the present study, it is recommended to determine the causal relationship between the chrono-nutrition components and anthropometric measures.
Supplementary material
For supplementary material/s referred to in this article, please visit https://doi.org/10.1017/S0007114525105047.
Acknowledgements
Special thanks go to all those who participated in this study.
This work was supported by Tehran University of Medical Sciences.
B.J-G. and S.S-B. contributed to the conception/design of the research; B.J-G., A.M., R.N., S.G., N.B., M.F. and A.T.J. contributed to carrying out the study; B.J-G. and A.M. contributed to the analysis; B.J-G. contributed to the interpretation of the data and drafting the first version of the manuscript; S.S-B., K.D.J. and A.B. critically revised the manuscript; and S.S-B. agreed to be fully accountable for ensuring the integrity and accuracy of the work.
There are no conflicts of interest.
The Ethics Committee of Tehran University of Medical Sciences (IR.TUMS.Medicine.REC.1400·780) approved the study. All participants were given written informed consent precede to enter the study. The methods were conducted based on the Declaration of Helsinki guidelines and regulations.