I. INTRODUCTION
Raman spectroscopy has played an important role in structural analysis since its discovery in 1928. Reference Raman and Krishnan1 The use of Raman spectroscopy in trace analysis of molecules has been limited due to low Raman scattering cross section (10−26 cm2) compared to fluorescence (10−16 cm2). Reference Kneipp, Wang, Kneipp, Perelman, Itzkan, Dasari and Feld2 However, the enormous intensity enhancement observed by Fleischman et al. Reference Fleischmann, Hendra and Mcquillan3 on pyridine molecules adsorbed on roughened silver electrode, circumvented the low scattering cross section problem. In 1977, Van Duyne and Jeanmaire Reference Jeanmaire and Van Duyne4 also observed the intensity enhancement and coined the phenomenon as surface-enhanced Raman spectroscopy (SERS). SERS is a surface sensitive technique that leads to the enhancement of the Raman scattering molecules adsorbed on a metallic surface. Reference Chang and Furtak5,Reference Moskovits6 The enhancement is found to be in the orders of 104 to 1015, which allows the technique to be sensitive enough to detect a single molecule. Reference Kneipp, Wang, Kneipp, Perelman, Itzkan, Dasari and Feld2,Reference Kneipp, Kneipp, Itzkan and Dasari7 SERS has now become a well-established sensitive diagnostic tool for detecting species adsorbed on the metallic surface. Reference Stiles, Dieringer, Shah and Van Duyne8 Since the discovery of SERS, there has been continued research on factors influencing the enhancement ranging from the use of different adsorbates Reference Joseph, Matschulat, Polte, Rolf, Emmerling and Kneipp9 ; the use of roughened metal electrodes to metal nanoparticles; the effect of surface plasmon resonance (SPR) which includes size and shape of metal nanoparticle; the dielectric constant of both metal and the surface and the interparticle distance. Reference McFarland, Young, Dieringer and Van Duyne10–Reference Kelly, Coronado, Zhao and Schatz12
Among the metals used as SERS substrates, gold and silver have been extensively studied. However, silver nanoparticles (AgNPs) have demonstrated a high plasmonic effect compared to gold nanoparticles. Reference Le Ru and Etchegoin13 Although there are some promising plasmonic properties of AgNPs, the synthetic method of size-controlled and monodispersed AgNPs remains a challenge. Reference Zhang, Xie, Yu and Lee14 The most widely used synthesis methods of isotropic AgNPs are centered on the reduction of silver salts by sodium citrate, Reference Lee and Meisel15 sodium borohydride, Reference Chreigton, Blatchford and Albrecht16 hydroxylamine hydrochloride, Reference Leopold and Lendl17 or polyvinylpyrrolidone. Reference Silvert, Herrera-Urbina, Duvauchelle, Vijayakrishnan and Elhsissen18 The shortcomings of all these methods are that, regardless of their individual advantages, they are incapable of giving a size-controlled monodispersed AgNPs. Glycerol has been used in colloidal synthesis to increase the monodispersity of gold nanostars, Reference Schutz, Steinigeweg, Salehi, Kompe and Schlucker19 gold nanoplates through the hydroxyl groups which has led to a higher stability of the NPs against oxidation/ripening. Reference Zhang, Li, Goebl, Lu and Yin20 Recently, Steinigeweg and Schlücker Reference Steinigeweg and Schlücker21 reported the use of various compounds bearing the hydroxyl groups including glycerol to produce monodispersed AgNPs. The method relied on the hydroxyl groups to control size and dispersity.
The design of the SERS substrate requires a Raman reporter that will be adsorbed on the surface and then show enhanced vibrations on the Raman spectroscopy. The use of alkanethiols as Raman reporters has attracted much attention because of the strong affinity of metal to sulfur bond. Various thiol-functionalized metallic clusters (Au, Ag, Pt, and Pd), have been synthesized, Reference Templeton, Wuelfing and Murray22,Reference Steigerwald, Alivisatos, Gibson, Harris, Kortan, Muller, Thayer, Duncan, Douglass and Brus23 and thiolated Au clusters have received more attention. We have recently reported the use of more than one alkanethiol adsorbed on the surface of gold nanorods to form mixed monolayer protected clusters (MMPCs), one alkanethiol acts as the Raman reporter and the other bears the carboxylic group end for further conjugation of the desired functionality. Reference Mlambo, Mdluli, Shumbula, Mpelane, Moloto, Skepu and Tshikhudo24
Herein, we report the functionalization of monodispersed AgNPs with coumarin derivative, AgNPs were synthesized using a method adopted from Steinigeweg and Schlücker Reference Steinigeweg and Schlücker21 and the variation of sodium citrate volume was used to yield AgNPs with different sizes. We further evaluated the SERS activity of the stoichiometric distribution of HS-(CH2)11-NHCO-coumarin on different sizes of AgNPs.
II. EXPERIMENTAL DETAILS
A. Chemicals
Tri-sodium citrate (ACE AR, 99%), silver nitrate (AgNO3, A.R.), and glycerol (98%) were purchased from Fluka and methanol from Merck. Ultra-pure (18 MΩ) water was used for all experimental solutions. HS-PEG-(CH2)11COOH and HS-(CH2)11-NHCO-coumarin were obtained from ProChimia Surfaces (Poland).
B. Synthesis of Ag nanoparticles
AgNPs of different sizes were prepared by dissolving 10 mg of AgNO3 into the mixture of 40% glycerol-water. Reference Steinigeweg and Schlücker21 The solution was heated up to 95 °C, and then added to different volumes (0.25, 0.5, and 0.75 mL) of 3% sodium citrate to give AgNPs of different sizes.
C. Functionalization of AgNPs with two alkanethiols
The resultant AgNPs were filtered, and then in each 10 mL (all different AgNPs sizes), 200 µL of different percentages of HS-(CH2)11-NHCO-coumarin and HS-PEG-(CH2)11COOH (1 and 50%, respectively) were used to co-stabilize nanoparticles. The solutions were swirled at room temperature for 3 h. For HS-(CH2)11-NHCO-coumarin 1%, 0.02 mg was dissolved in 1 mL methanol and then thoroughly mixed with HS-PEG-(CH2)11COOH (1.98 mg) in 1 mL of methanol. For 50%, 1 mg of each alkanethiol was dissolved to methanol and thoroughly mixed.
D. Instrumentation
High purity or ultrapure water with resistivity of 18.1 ΩM was obtained from a Milli-Q Advantage water system purchased from Millipore (USA) and was used in all the experiments. Samples were centrifuged using the Hettich MIKRO 22R cooling centrifuge (Germany). The samples were centrifuged in 2.0 mL Eppendorf tubes at 4 °C and 5000 rpm for 15 min. Absorption spectra of the solutions were recorded on a Lambda 35 UV–Vis spectrometer (Thermo Fisher Scientific, Vantaa, Finland). Transmission electron microscope (TEM) images were obtained using a JEM-2100F (Japan) at 200 kV. The TEM grids were prepared by depositing approximately 10 µL of the solution obtained after centrifugation and allowed to dry in air. Raman spectra were acquired using a PerkinElmer Raman Station 400 bench-top Raman spectrometer. The excitation source was a near-infrared 785 nm laser (100 mW at the sample), with a spot size of 100 μm. A spectral range of 100–3200 cm−1 was used. The detector was a temperature-controlled charged coupled device detector (−50 °C) including a 1024 × 256 pixel sensor. Spectra were acquired using Spectrum software and images were acquired using Spectrum IMAGE software, both supplied by PerkinElmer (Bucks, UK). The zeta potential measurements were performed using a Malvern ZetaSizer.
III. RESULTS AND DISCUSSION
A. Characterization of AgNPs and their corresponding AgMMPCs
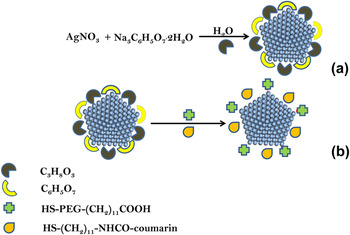
The synthesis of AgNPs with different sizes was achieved by variation of 3% sodium citrate volume to reduce silver ions to silver atoms in the presence of glycerol-water mixture as shown in Fig. 1, scheme (a). The synthesized AgNPs were functionalized with a mixture of two alkanethiols, a Raman active HS-(CH2)11-NHCO-coumarin and HS-PEG-(CH2)11COOH. The latter was to be used for further bioconjugation or attachment of biomarkers due to the presence of a carboxylic end. These alkanethiols were added at different percentages of 1 and 50% to give silver MMPCs as shown in Fig. 1, scheme (b). The selection of 1–50% stoichiometric percentages was for the understanding of the displacement of the electrostatic stabilizer (citrate) on metal surfaces. The 1 and 50% stoichiometric ratios were selected based on the previous reported study by Tshikhudo et al., Reference Pillay, Ozoemena, Tshikhudo and Moutloali25 who indicated the minimum and maximum concentration that could be used for thiolated polyethylene glycol for the sufficient surface adsorption on gold nanoparticles. In their study, they demonstrated the influence of the different stoichiometric ratios addition on the surface adsorption, which is a very important phenomenon that drives the stability of the MMPCs. It was therefore relevant for this study to use 1% to investigate the lowest amount of adsorption that can be attained with a Raman active reporter [HS-(CH2)11-NHCO-coumarin] and also to evaluate the intensity enhancement. The maximum of 50% stoichiometric ratio of HS-(CH2)11-NHCO-coumarin and HS-PEG-(CH2)11COOH was used to probe the change in enhancement factor (EF) as well as the stability of the AgMMPCs.
The synthetic scheme of AgNPs by reduction of AgNO3 with citrate and glycerol: (a) AgNPs to AgMMPCs (b).

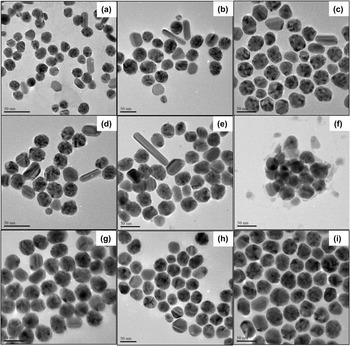
It has been reported that the interaction of the sulfur atom of the alkanethiol chain with the metallic surface of the nanoparticles contributes to the arrangement of the nanoparticulates to form self-assembled superlattices, Reference Doty, Sigman, Stowell, Shah, Saunders, Korgel and Klimov26 similar observations were observed for Raman active HS-(CH2)11-NHCO-coumarin and HS-PEG-(CH2)11COOH on AgNPs as shown in the TEM images in Fig. 3. The formation of self-assembled layers through the thiol group is very critical during the reaction as it allows the availability of terminal functional groups from HS-PEG-(CH2)11COOH such as the carboxylic group. The carboxylic group is very important for the later 1-ethyl-3-(3-dimethylaminopropyl) carbodiimide (EDC) coupling chemistry of the protein or biomarker of interest for the fabrication of SERS-based sensors.
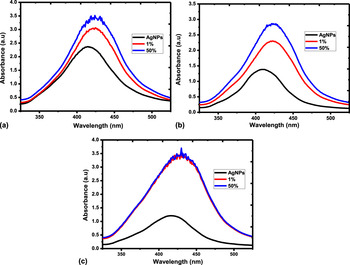
The experimental results showed that the as-synthesized AgNPs conformed to Ostwald ripening and Gibbs–Thompson law especially for the nanoparticles which were obtained at a high ratio of AgNO3 (precursor) to citrate (reducing agent), i.e., if the precursor concentration is higher than the solubility of all existing nanocrystals in solution, all nanocrystals will grow, thus displaying a short nucleation process giving rise to kinetically isotropic nanoparticle sizes. The absorption spectra of the different sizes of the AgNPs and their corresponding silver MMPCs (AgMMPCs) in different stoichiometric ratios of HS-(CH2)11-NHCO-coumarin and HS-PEG-(CH2)11COOH are shown in Fig. 2.
UV–Vis absorption spectra of AgNPs of (a) 16 nm, (b) 30 nm, and (c) 43 nm and their corresponding 1% and 50% AgMMPCs.

Figure 2(a) shows the formation of AgNPs with an average diameter of 16 nm with an SPR band appearing at 415 nm. The obtained SPR band at 415 nm of the as-synthesized AgNPs agreed with the reported SPR peaks of the spherical AgNPs which is normally attained between 350 and 500 nm with a distinct peak at about 410 nm depending on the size. Reference Gu, Nie, Lui and Lin27 The SPR band was found to be red-shifted with respect to the original 415 nm of unmodified AgNPs to 425 nm when 1% and 50% stoichiometric ratios of [HS-(CH2)11-NHCO-coumarin:HS-PEG-(CH2)11COOH] were adsorbed on the surface of AgNPs. In Fig. 2(b), AgNPs with the average diameter of 30 nm exhibited an SPR band of 417 nm, which was red-shifted to 426 and 428 nm when the different ratios of 1% and 50% were adsorbed on the surface of AgNPs, respectively. AgNPs with an average diameter of 43 nm exhibited an SPR band at 413 nm as shown in Fig. 2(c). The SPR band shifted to 422 nm for both 1% and 50% ratios of [HS-(CH2)11-NHCO-coumarin:HS-PEG-(CH2)11COOH]. The shifting of SPR band demonstrated in this study signifies the change in dielectric environment or surface of AgNPs before and after functionalization. The SPR band of AgNPs showed a small shift to higher wave length for AgNPs with an average diameter of 16 (415 nm) to 30 nm (417 nm) adhering to Mie theory, some of these shifts in the SPR bands are influenced by rod-like particles as observed in the TEM images in Figs. 3(a)–3(e), respectively. For AgNPs with an average diameter of 43 nm, the SPR shifted to lower wave length with respect to smaller AgNP sizes suggesting that the SPR band was acquired from monodispersed AgNPs with no influence from other shapes as shown in their TEM images in Figs. 3(g)–3(i).
TEM images of AgNPs: (a) unmodified 16 nm, (b) 1% modified 16 nm AgMMPCs, (c) 50% modified 16 nm AgMMPCs; (d) unmodified 30 nm, (e) 1% modified 30 nm, (f) 50% modified 30 nm AgMMPCs; (g) unmodified 43 nm AgNPs, (h) 1% modified 43 nm AgMMPCs, (i) 50% modified 43 nm AgMMPCs.

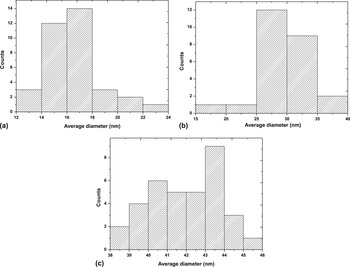
Smaller sizes of AgNPs with the average diameter of 16 nm are shown in Fig. 3(a) and its particle distribution histogram confirmed the size as shown in Fig. 4(a). When AgNPs were exposed to different stoichiometric ratios of 1% and 50% [HS-(CH2)11-NHCO-coumarin:HS-PEG-(CH2)11COOH], no aggregation was observed signifying the stability of nanoparticles as shown in Figs. 3(b) and 3(c). The other notable feature was the formation of self-assembled ordered superlattices which is known for alkanethiol-capped nanoparticles. Reference Doty, Sigman, Stowell, Shah, Saunders, Korgel and Klimov26
Particle size distribution histograms of AgNPs of (a) 16 nm, (b) 30 nm, and (c) 43 nm.

Figure 3(d) shows spherical-like AgNPs with an average diameter of 30 nm, with signs of anisotropic particles being observed. The spherical-like AgNP distribution histogram is shown in Fig. 4(b). In the particles with a diameter of 30 nm, the formation of superlattices of alkanethiol capped was only evident in the functionalization with 1% mixture as shown in Fig. 3(e). The AgNPs with a diameter of 30 nm which were modified with 50% [HS-(CH2)11-NHCO-coumarin:HS-PEG-(CH2)11COOH] displayed particle aggregation as shown in Fig. 3(f). Larger isotropic and well-dispersed AgNPs with an average diameter of 43 nm were evident from the TEM image shown in Fig. 3(g) and its particle distribution histogram shown in Fig. 4(c). The modification of AgNPs with an average diameter of 43 nm with (1% and 50%) HS-(CH2)11-NHCO-coumarin and HS-PEG-(CH2)11COOH mixtures resulted in the formation of self-assembled ordered superlattices as shown in the TEM images in Figs. 3(h) and 3(i), signifying high stability of the functionalized AgNPs.
The stability of the resulted AgMMPCs was evaluated using a Malvern ZetaSizer. The zeta plots obtained from AgNPs and AgMMPCs are presented in supplementary data (Figs. S1–S3 and the summary of the Zeta potentials in Table S1). AgNPs displayed huge negative values which were found to be reduced close to zero as the different stoichiometric ratios of these different alkanethiols were introduced to the silver surface showing the stability of AgMMPCs.
To study the interaction of HS-(CH2)11-NHCO-coumarin with the silver surface, theoretical spectra of HS-(CH2)11-NHCO-coumarin and Ag-S-(CH2)11-NHCO-coumarin were obtained by using the Gaussian 03 program and were correlated to the experimental Raman spectra. The optimized geometries of HS-(CH2)11-NHCO-coumarin and Ag-S-(CH2)11-NHCO-coumarin used to obtain the theoretical Raman spectra are shown in the supplementary data (Fig. S4). The DFT calculated Raman spectra and the summary of the vibrational peaks are shown in supplementary data in Fig. S5 and Table S2. The theoretical spectrum of Ag-S-(CH2)11-NHCO-coumarin depicts the disappearance of (-S-H) vibrations observed at the region of above ∼2600 cm−1 upon interaction with the silver surface. This resulted in the new vibrational peak at the region above ∼300 cm−1 associated with (Ag-S) vibrations, as compared to the HS-(CH2)11-NHCO-coumarin spectrum. Both theoretical spectra showed no significant change in the other vibrational peaks upon the thiol adsorption on the silver surface. The calculated theoretical spectra were used to assign the vibrational peaks of the experimental Raman spectra.
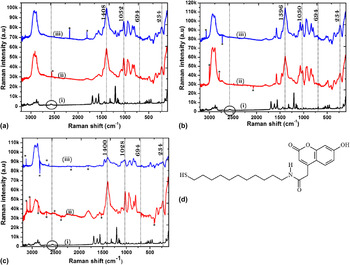
The SERS spectra of 1% and 50% HS-(CH2)11-NHCO-coumarin adsorbed on AgNPs with different sizes are shown in Fig. 5. Figure 5(d) shows the chemical structure of the coumarin derivative that is attached on the surface of AgNPs. It can be seen from Fig. 5(d) that the coumarin derivative bears the thiol end functional group, which possesses high affinity for a metal nanoparticle's surface. The adsorption due to this thiol end is supported by Raman spectra shown in Fig. 5. For all percentage ratios of HS-(CH2)11-NHCO-coumarin, the similarity in their vibrational frequencies was observed. In all spectra, the disappearance of the peaks of the (-S-H) vibrations at 2570 and 2590 cm−1 and the surfacing of an enhanced peak at 234 cm−1 assigned to Ag-S confirmed the interaction of HS-(CH2)11-NHCO-coumarin through the thiol end, as also observed in the theoretical Raman spectra. This assignment of Ag-S at 234 cm−1 agreed with the previously reported vibrational peak at about 235 cm−1. Reference Joo, Kim and Kim28 The other important feature observed was the weakening of the C-S peak at 694 cm−1 which was found to be blue-shifted to 680 cm−1. The weakening of the C-S vibration was justified by the increasing double bond character which resulted in strong vibrational peaks observed between 1000 and 1200 cm−1 due to the C=S. Figure 5(a) shows (i) the free HS-(CH2)11-NHCO-coumarin, whereas (ii) and (iii) are 1% and 50% HS-(CH2)11-NHCO-coumarin adsorbed on AgNPs with an average diameter size of 16 nm. The addition of different stoichiometric ratios of HS-(CH2)11-NHCO-coumarin (1% and 50%) showed a strong electromagnetic effect assigned to the CH2 asymmetric vibrations observed at 1408 cm−1. The other notable strong enhancement was with the aliphatic C–C vibration observed at the region of 800–950 cm−1. Similar electromagnetic effects were observed in SERS spectra of 1% and 50% HS-(CH2)11-NHCO-coumarin adsorbed on the 30 and 43 nm AgNPs as shown in Figs. 5(b) and 5(c), respectively.
The Raman spectra of HS-(CH2)11-NHCO-coumarin adsorbed on different AgNP sizes of (a) 16 nm, (b) 30 nm, (c) 43 nm and (d) the structure of HS-(CH2)11-NHCO-coumarin. The asterisk peaks were due to cosmic rays.

B. Effect of AgNPs on the calculated EF
The SERS EF can be a prominent indicator of the adsorption of the coumarin derivative on the surface of the metal nanoparticles. Herein, the EF was calculated for each percentage ratio of HS-(CH2)11-NHCO-coumarin adsorbed onto the surface of the different sized AgNPs. Most of the studies carried out to investigate the effect of AgNPs on EF show a linear relationship between the EF and the size of AgNPs Reference Stamplecoskie and Scaiano29,Reference Lin, Liao, Chen, Chang, Tsai and Chiang30 due to the fact that an increase in particle size increases the contribution to the absorption of AgNPs that broadens and red-shifts the surface plasmon resonance band. Reference Joo, Kim and Kim28 Theoretically, it is expected that the EF would increase with increasing particle size since it increases the electromagnetic enhancement. The calculation of the EF is the main indicator to evaluate the sensitivity of SERS. Reference Wang, Liu, Wu, Liu, Peng, Chan, Hsu, Wang and Wang31 The SERS EF is calculated under normal conditions whereby a laser power, accumulation time, and exposure time are taken into consideration using the following equations Reference Lin, Huang, Chen, Chen, Tsai and Chiang32 :
 $${\rm{EF}} = \left( {{{{I_{{\rm{surf}}}}} \over {{I_{{\rm{bulk}}}}}}} \right) * \left( {{{{N_{{\rm{bulk}}}}} \over {{N_{{\rm{surf}}}}}}} \right)\quad ,$$
where I surf and I bulk are the intensities of the vibrational mode in the SERS and the vibrational mode in the Raman spectrum, respectively. The N bulk and N surf represent the numbers of the molecules probed on the Raman spectrum [free HS-(CH2)11-NHCO-coumarin] and SERS [HS-(CH2)11-NHCO-coumarin with Ag substrate], respectively. The number of molecules probed on free HS-(CH2)11-NHCO-coumarin (N bulk) can be expressed by Eq. (2),
 $${N_{{\rm{bulk}}}} = Ah{\rho \over m}\quad ,$$
where A, h, ρ, and m are the laser spot area, the focal length, the density of solid HS-(CH2)11-NHCO-coumarin, and its molecular weight (40,555 gmol−1), respectively. Also Nsurf can be expressed by Eq. (3):
 $${N_{{\rm{surf}}}} = 4\pi {r^2}CAN\quad ,$$
where r, C, A, and N are the average radius of the Au nanoparticles, the surface density of the HS-(CH2)11-NHCO-coumarin, the area of the laser spot, and the surface coverage of the AgNPs (particles μm−2), respectively. Substituting Eqs. (2) and (3) in (1), gives the following:
 $${\rm{EF}} = \left( {{{{I_{{\rm{surf}}}}} \over {{I_{{\rm{bulk}}}}}}} \right) * \left( {{{Ah\rho } \over {4\pi m{r^2}CAN}}} \right)\quad .$$
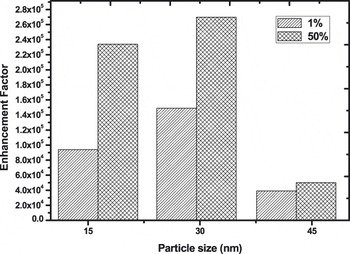
The EF was calculated using the enhanced intensities (I surf) of the asymmetric vibrational bands of CH2 [HS-(CH2)11-NHCO-coumarin] and those of the free HS-(CH2)11-NHCO-coumarin (I bulk) observed at about 1400 cm−1 for all the samples as shown in Fig. 5. The graphical representation of all calculated EFs of the different stoichiometric ratios of HS-(CH2)11-NHCO-coumarin adsorbed on AgNPs with different sizes is shown in Fig. 6. All the calculated EFs were found to be in the range of 1 × 10⁴ or above, the calculated EF from AgNPs with an average diameter of 16 nm was found to be 1.5 × 10⁴. When the stoichiometric ratio of HS-(CH2)11-NHCO-coumarin was increased to 50%, the EF increased to 2.3 × 10⁵ attributed to the increase of vibrational modes due to an increase in the number of HS-(CH2)11-NHCO-coumarin molecules adsorbed on the silver surface. A 10-fold increase of the EF to 1.5 × 10⁵ was observed for 1% HS-(CH2)11-NHCO-coumarin adsorbed on the 30 nm AgNPs in comparison with the 16 nm AgNPs. The increase of the EF to 2.7 × 10⁵ was also observed when the stoichiometric ratio was raised to 50% HS-(CH2)11-NHCO-coumarin. The EF was found to increase with the increase in the average particle size of AgNPs from 16 to 30 nm, however when 1% and 50% stoichiometric ratios of HS-(CH2)11-NHCO-coumarin were adsorbed on AgNPs of average diameter 43 nm, the calculated EFs were found to be lower than that of smaller AgNP sizes where it was 3.9 × 10⁴ and 5.0 × 10⁴, respectively.
Bar graph correlating the calculated EF with AgNP size.

The increase of the EF as the AgNPs increased from 16 to 30 nm can be attributed to the increase contribution of high-order plasmon modes which increases the electromagnetic field in larger particles. The increase in electromagnetic field of AgNPs led to a higher dipole moment of vibrating molecules of HS-(CH2)11-NHCO-coumarin, thus showing higher enhancement than those adsorbed onto smaller particle size. However, the decrease in the calculated EF in AgNPs of 43 nm is attributed to the fact that in larger particle sizes, the increase in electromagnetic field is also accompanied by an increase in scattering efficiency which results in lower Raman signals. Therefore, it is expected that due to a lower adsorption of HS-(CH2)11-NHCO-coumarin, the additional effects such as scattering and radiation damping on larger particles cause the decrease in the EF. Reference Fang, Li, Yang, Li, Ren and Tian33 Fang et al. described the SERS enhancement as the competition between radiation damping with surface scattering and dynamic polarization, so that there is always an optimal size of AgNPs for SERS. Different optimal AgNP sizes with different adsorbates (Raman active compound) have been reported: Lin et al. reported the optimal AgFON substrates using polystyrene to be ∼1000 nm, Reference Lin, Liao, Chen, Chang, Tsai and Chiang30 Stamplecoskie and Scaiano obtained an optimal AgNP size of ∼50 nm adsorbed onto rhodamine 6G, Reference Joo, Kim and Kim28 and Meier and Wokaun predicted the optimal size of ∼25 nm. Reference Meier and Wokaun34 Hence, the decrease of the calculated EF after ∼30 nm represents the optimal AgNPs for SERS of HS-(CH2)11-NHCO-coumarin.
IV. CONCLUSIONS
The use of glycerol with the hydroxyl groups that helps to control the nucleation and growth rate was successfully used to synthesize size-controlled AgNPs. The obtained AgNPs were functionalized with two different stoichiometric ratios (1% and 50%) of the two alkanethiols HS-(CH2)11-NHCO-coumarin, Raman active or adsorbate and HS-PEG-(CH2)11COOH bearing –COOH end for further bioconjugation or attachment of biomarkers to form mixed monolayer protected silver clusters. The AgMMPCs were found to be stable and displayed the tendency to form self-assembled ordered superlattices. The effect of size on the EF of the HS-(CH2)11-NHCO-coumarin adsorbed onto different AgNPs was found to increase from AgNPs with an average diameter of 16–30 nm. The optimal size for EF of HS-(CH2)11-NHCO-coumarin adsorbed on AgNPs was found to be ∼30 nm with the EF decreasing with bigger particles.
Supplementary Material
To view supplementary material for this article, please visit http://dx.doi.org/jmr.2015.158.
ACKNOWLEDGMENTS
This work was supported by Mintek, Department of Science and Technology (DST) and National Research Foundation (NRF) South Africa, through the DST/Mintek Nanotechnology Innovation Centre (NIC) and DST/NRF PDP Programme. MM and NM would also like to acknowledge the University of the Witwatersrand for the support.