Introduction
Psychotic experiences are common in the general population (van Os et al. Reference van Os, Linscott, Myin-Germeys, Delespaul and Krabbendam2009). A systematic review of 285 rates of prevalence or incidence of psychotic experiences showed that half of the considerable heterogeneity in rates of subclinical psychotic experiences across studies is due to study cohort and design factors (Linscott & van Os, Reference Linscott and van Os2010). In particular, rates were found to be higher in studies using smaller sample sizes, convenience sampling and self-report assessment.
A major and hitherto unresolved issue is that the base risk of conversion to clinical disorder, given earlier expression of subclinical psychotic experiences in unselected, representative and non-help-seeking general population samples, remains unknown. Assessment of the risk is important because it can serve as the population reference against which reported risk of conversion from ‘ultra-high’ risk status to psychotic disorder in variable and highly selected samples can be compared. To address this issue, we reviewed the literature on the risk of developing psychotic disorder given earlier expression of subclinical psychotic experiences in non-service-using representative population samples. To this end, the method of systematic review and meta-analysis was used, as these generally provide a transparent and quantitative approach to identify, summarize and critically appraise relevant studies, enabling an integrated presentation of results. Furthermore, systematic review and meta-analysis can address meta-hypotheses over and above primary studies by quantitative exploration of the patterns of results from single investigations. Specific aims of the meta-analysis were: (i) to examine the risk of conversion to psychotic disorder given the presence of subclinical psychotic experiences in representative general population samples, (ii) to examine the risk of conversion to non-psychotic disorder given the presence of subclinical psychotic experiences in representative general population samples, and (iii) to examine which factors moderate risk of conversion. To achieve these goals, the methodology for systematic review as described in Meta-analysis of Observational Studies in Epidemiology (MOOSE) guidelines (Stroup et al. Reference Stroup, Berlin, Morton, Olkin, Williamson, Rennie, Moher, Becker, Sipe and Thacker2000) was applied. For some studies, additional analyses were conducted in the original data so that non-psychotic outcomes that had not been included in the original publications could also be reported.
Method
To reduce methodological variation of studies to be entered in the meta-analysis, a priori criteria for inclusion were formulated. Thus, data of published studies were added to the meta-analysis database if they (i) were published in a peer-reviewed journal after 1950; (ii) were written using the English, Spanish, French, German or Dutch language; (iii) represented a population-based or comparably representative follow-up study of individuals with and without a defined measure of subclinical psychotic experiences at baseline (the ‘exposure’); and (iv) provided cumulative incidence rates (or data allowing computation of these) of defined psychotic disorder outcomes (the ‘outcome’).
A computerized search strategy was developed to sensitively query the MEDLINE, PsycINFO and EMBASE databases to identify potentially relevant articles in English, Spanish, German, French or Dutch, published from 1951 to April 2010. A sensitive search string was compiled, based on three elements. The first was defined as: (((psychosis OR psychotic) AND (subthreshold OR subclinical OR non-clinical)) OR psychosis-like OR psychotic-like OR schizotypy OR ‘psychotic experience*’ OR ‘psychotic symptom*’ OR ‘psychosis proneness’ OR hallucinat* OR delusion* OR hallucination-like OR delusion-like OR delusional-like); this was combined (‘AND’) with a second search element of (follow-up OR transition OR conversion OR longitudinal OR incidence OR predict* OR ‘cohort study’) while excluding (‘NOT’), in the third search element (mice OR mouse OR rat OR dementia OR Parkinson's OR Lewy body OR cancer OR aids). This yielded over 3000 citations. Two investigators independently screened citations and selected publications for further consideration on the basis of consensus, using three consecutive filters. The first selection filter was at the level of citations, applying the broad criterion of relevance for the topic of the meta-analysis. The second selection filter was applied at the level of abstracts, excluding studies that did not meet a single inclusion criterion as defined above. The final filter was based on inspection of full-text articles. In the case of multiple reports involving a single study population, the publication with the largest sample size and/or the longest follow-up was selected. The great majority of studies identified in the initial search were rejected because (i) reports were on patients with established psychotic disorder or other disorders, or on non-representative, non-epidemiological samples of help-seeking individuals meeting ultra-high risk criteria, (ii) samples included cross-sectional data only or (iii) follow-up measures did not include a defined clinical outcome. Five studies (Chapman et al. Reference Chapman, Chapman, Kwapil, Eckblad and Zinser1994; Poulton et al. Reference Poulton, Caspi, Moffitt, Cannon, Murray and Harrington2000; Hanssen et al. Reference Hanssen, Bak, Bijl, Vollebergh and van Os2005; Welham et al. Reference Welham, Scott, Williams, Najman, Bor, O'Callaghan and McGrath2009; Dominguez et al. Reference Dominguez, Wichers, Lieb, Wittchen and van Os2011) thus remained that after full inspection were deemed suitable for inclusion. Reference lists of these articles were screened to encounter additional articles (yielding no additional citations). In addition, a process of forward and backward citation tracking was executed using the Web of Science database (yielding no additional citations). Finally, researchers with expertise in the field were contacted to identify additional publications and/or data potentially relevant for the meta-analysis. This resulted in the following additional data. First, original individual participant data from two cohort studies, the Netherlands Mental Health Survey and Incidence Study (NEMESIS; Bijl et al. Reference Bijl, Ravelli and van Zessen1998a , Reference Bijl, van Zessen, Ravelli, de Rijk and Langendoen b ) and the Early Developmental Stages of Psychopathology (EDSP) study (Wittchen et al. Reference Wittchen, Perkonigg, Lachner and Nelson1998; Lieb et al. Reference Lieb, Isensee, von Sydow and Wittchen2000), were subjected to additional analyses to add information on non-psychotic outcomes, not published before, to the meta-analysis database. Second, one additional study (Werbeloff et al. Reference Werbeloff, Drukker, Dohrenwend, Levav, Yoffe, van Os, Davidson and Weiser2012) was identified that was suitable for inclusion in the meta-analysis.
In the next step, two investigators independently extracted quantitative and qualitative data from the six selected publications. A priori qualitative data included factors impacting on internal validity, such as methodological and design features, in addition to the potential for confounding and also bias due to differential attrition or possible differential assessment of exposure and/or outcome. None of the six identified studies were excluded on the basis of these considerations. Quantitative data included cumulative conversion rates as a function of baseline exposure status (i.e. with and without subclinical psychotic experiences). Data pertaining to studies using continuous exposure measures were extracted and analysed according to the original continuous exposure format, and additionally analysed as a dichotomous exposure to facilitate comparison of results across studies. Dichotomization was carried out by contrasting, in the case of three-level exposure variables (e.g. no symptoms, weak symptom, strong symptom), the highest category versus the lowest two. In the case of four-level exposures, the highest category was similarly compared to the lowest three. If data could not be extracted in a format suitable for meta-analysis, the authors were contacted for reanalysis of the original data in the required format.
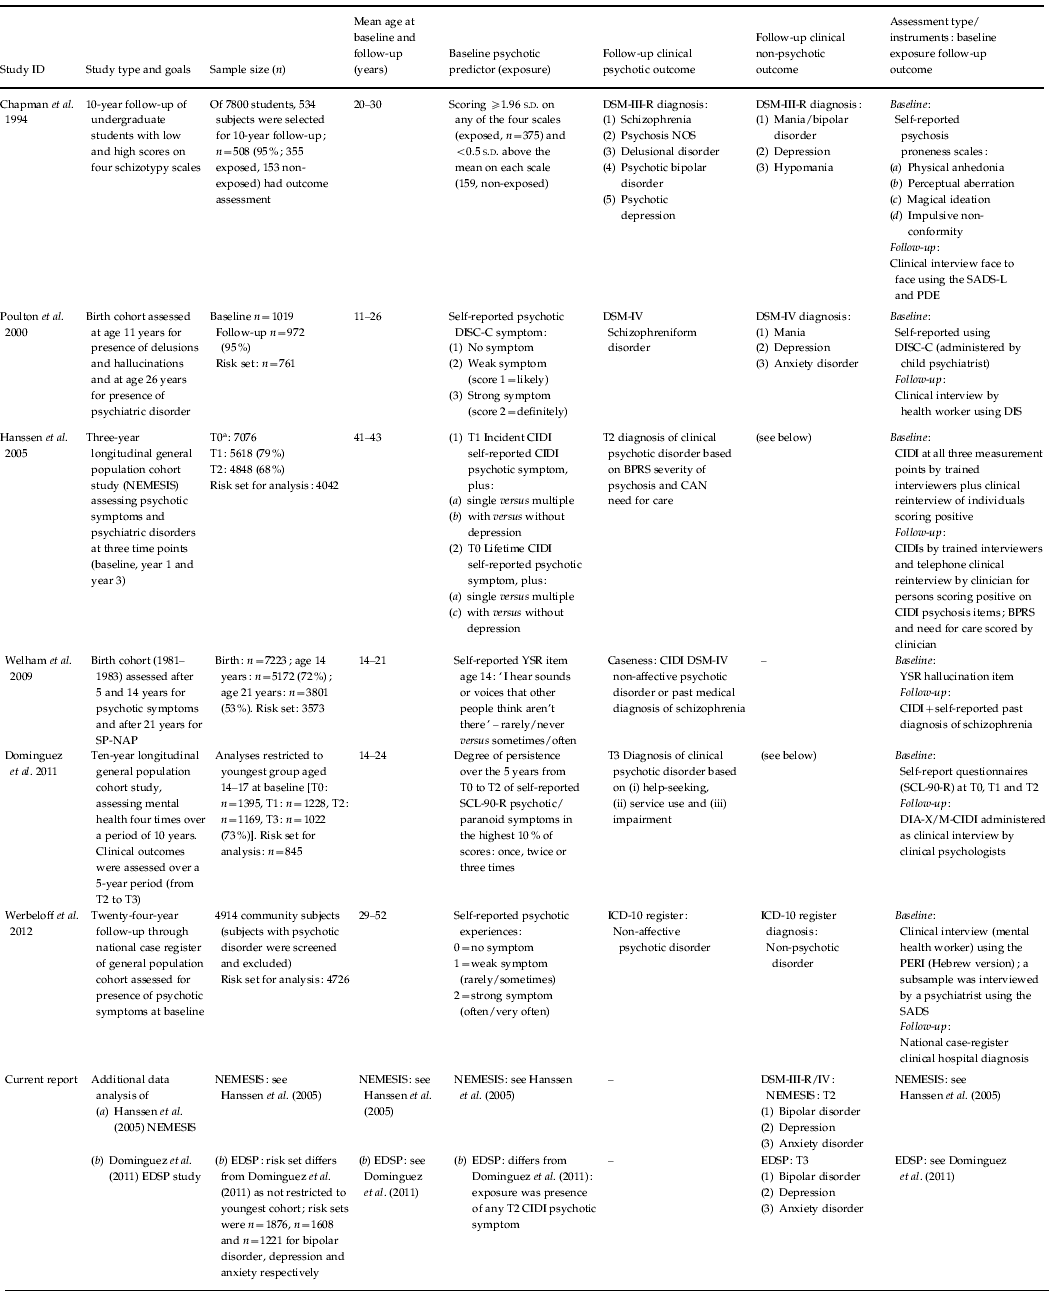
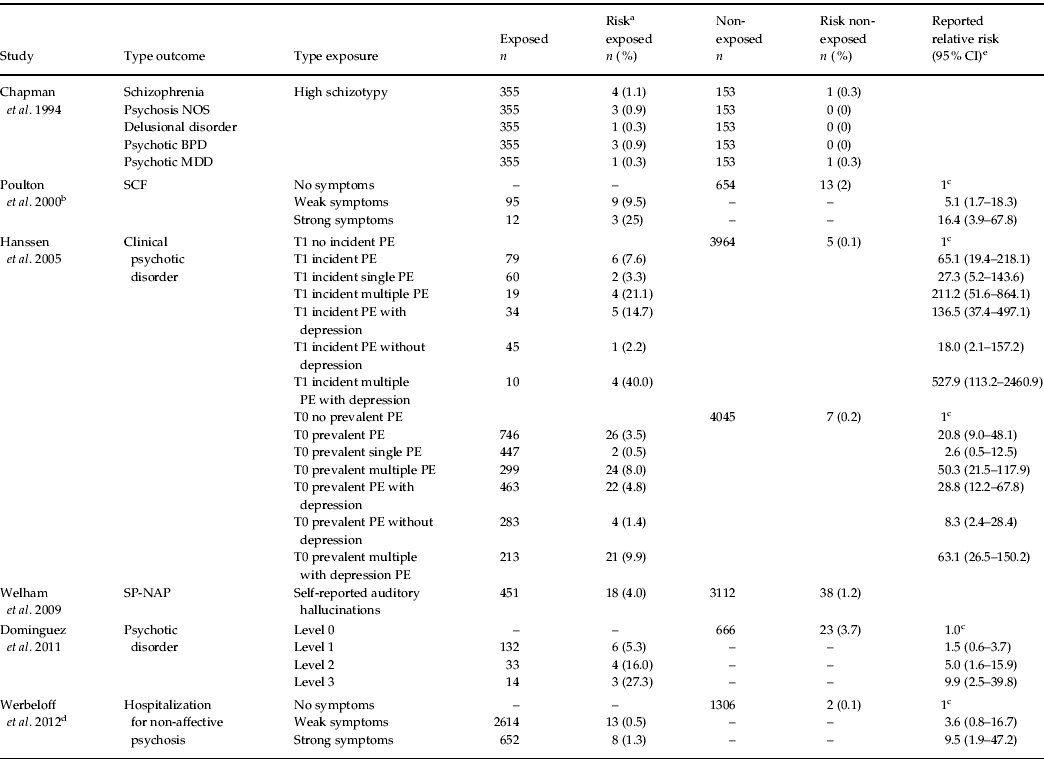
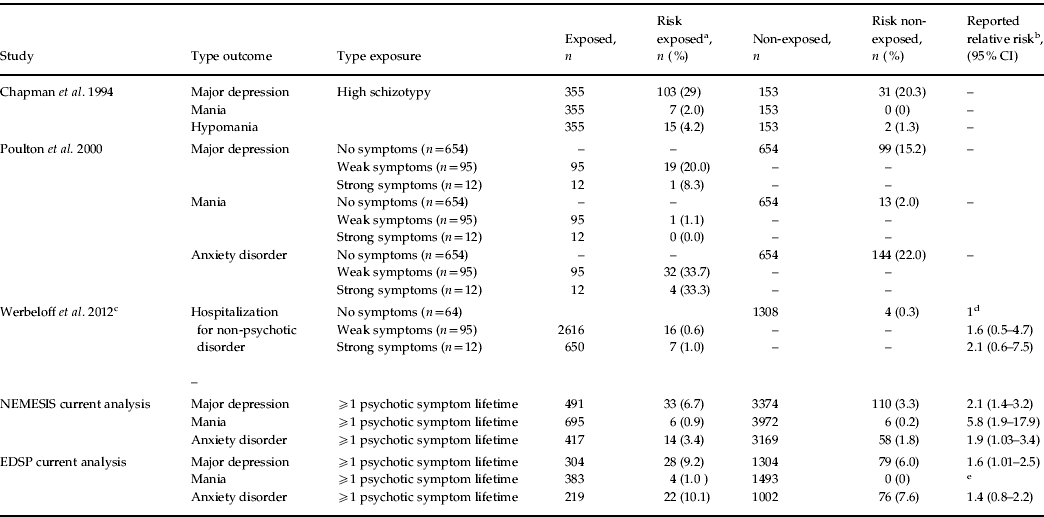
Table 1 a was compiled to provide a descriptive summary of selected studies, showing, for both psychotic and non-psychotic outcomes, the principal study characteristics including populations, observation periods, exposure and outcome definitions, main results and sample and study design features. Tables 1 b and 1 c show the quantitative data extracted from each study for psychotic and non-psychotic outcomes respectively.
Qualitative description of longitudinal studies in representative samples studying predictive value of self-reported subclinical psychotic experiences (exposure) for transition to clinical psychotic and non-psychotic disorders (outcome)

NEMESIS, The Netherlands Mental Health Survey and Incidence Study; EDSP, Early Developmental Stages of Psychopathology; SP-NAP, screen-positive non-affective psychotic disorder; NOS, not otherwise specified; s.d., standard deviation; PDE, Personality Disorder Examination; SADS-L, Schedule for Affective Disorders and Schizophrenia – Lifetime version (Endicott & Spitzer, Reference Endicott and Spitzer1978); DISC, Diagnostic Interview Schedule for Children (Costello et al. Reference Costello, Edelbrock, Kalas, Kessler and Klaric1982; NIHM DIS for Children: Child Version); DIS, Diagnostic Interview Schedule for DSM-IV (Robins et al. Reference Robins, Cottler, Bucholz and Compton1995); CIDI, Composite International Diagnostic Interview (WHO, 1992); YSR, Youth Self Report questionnaire (Achenbach, Reference Achenbach1991); SCL-90-R, Self-Report Symptom Checklist-90-R (Derogatis & Cleary, Reference Derogatis and Cleary1977); DIA-X/M-CIDI: updated version of the World Health Organization's CIDI version (Wittchen & Pfister, Reference Wittchen and Pfister1997; DIA-X versions of the WHO CIDI); PERI, Psychiatric Epidemiology and Research Interview (Shrout et al. Reference Shrout, Dohrenwend and Levav1986; Hebrew version: Roberts & Vernon, Reference Roberts and Vernon1981); BPRS, Brief Psychiatric Rating Scale (Overall & Gorham, Reference Overall and Gorham1962); CAN, Camberwell Assessment of Need (Slade et al. Reference Slade, Phelan, Thornicroft and Parkman1996).
a T0 baseline, T1 first follow-up, T2 second follow-up, T3 third follow-up.
Longitudinal studies in representative samples studying predictive value of self-reported subclinical psychotic experiences (exposure) for transition to psychotic disorders (outcome): qualitative data

NOS, not otherwise specified; BPD, bipolar disorder; MDD, major depressive disorder; SP-NAP, screen-positive non-affective psychotic disorder; SCF, schizophreniform disorder; PE, psychotic experience; CI, confidence interval.
a Transition rate in the group with PEs.
b The odds ratios (ORs) remained almost unchanged after controlling for sex, social class origins and age 11 IQ scores.
c Reference category.
d Weighted results.
e Mostly adjusted ORs from published studies, some ORs for the Netherlands Mental Health Survey and Incidence Study (NEMESIS) and the Early Developmental Stages of Psychopathology (EDSP) study were calculated on the basis of new analyses for the current paper.
Longitudinal studies in representative samples studying predictive value of self-reported subclinical psychotic experiences (exposure) for transition to non-psychotic disorders (outcome): quantitative data

NEMESIS, Netherlands Mental Health Survey and Incidence Study; EDSP, Early Developmental Stages of Psychopathology; CI, confidence interval.
a Transition rate in the group with psychotic experiences.
b Mostly adjusted odds ratios (ORs) from published studies, some ORs for the NEMESIS and the EDSP study were calculated on the basis of new analyses for the current paper.
c Weighted results.
d Reference category.
e OR infinite as no transition in non-exposed.
Approach to meta-analysis
Data from the selected studies were combined to estimate pooled rates with their corresponding 95% confidence intervals (CIs) under a random effects model, assuming that true effects were randomly distributed around the mean effect size. The random effect model presumes that variation in samples and design factors will occasion different true effect sizes across studies and represented a valid a priori choice, given that methods and populations across studies did not correspond to a degree that they could be regarded as estimating the same underlying effect. The between-study variance in the random effects model reflects heterogeneity across studies, the magnitude of which was evaluated using a χ2 test for heterogeneity, testing whether individual studies varied more than could be explained by chance alone. In the phase of reading and comparing the articles, various hypotheses for heterogeneity were identified.
Additional analyses undertaken in original datasets
For the specific purpose of the meta-analysis, exposure and outcome data as reported in the NEMESIS by Hanssen et al. (Reference Hanssen, Bak, Bijl, Vollebergh and van Os2005) and in the EDSP study by Dominguez et al. (Reference Dominguez, Wichers, Lieb, Wittchen and van Os2011) were subjected to additional analyses. Both the NEMESIS and the EDSP study followed general population cohorts, interviewing the entire cohort with the Composite International Diagnostic Interview (CIDI) on three occasions (NEMESIS: T0, T1 and T2; EDSP: T0, T2 and T3) over time (Bijl et al. Reference Bijl, Ravelli and van Zessen1998a , Reference Bijl, van Zessen, Ravelli, de Rijk and Langendoen b ; Wittchen et al. Reference Wittchen, Perkonigg, Lachner and Nelson1998; Lieb et al. Reference Lieb, Isensee, von Sydow and Wittchen2000). In the NEMESIS, fresh analyses were conducted to provide additional risk estimates for prevalent exposure [defined as lifetime report of subclinical psychotic experiences at T0, as described in van Os et al. (Reference van Os, Hanssen, Bijl and Ravelli2000) ], in addition to the incident exposure reported in the original paper (Hanssen et al. Reference Hanssen, Bak, Bijl, Vollebergh and van Os2005). In both the NEMESIS and the EDSP data sets, additional analyses were conducted with the following non-psychotic outcomes: T2 (NEMESIS) or T3 (EDSP) CIDI diagnosis of bipolar disorder, excluding individuals with a similar diagnosis at T0/T1 (NEMESIS) or T0/T2 (EDSP) (Regeer et al. Reference Regeer, Krabbendam, de Graaf, ten Have, Nolen and van Os2006, Reference Regeer, Krabbendam, de Graaf, ten Have, Nolen and van Os2009; Tijssen et al. Reference Tijssen, van Os, Wittchen, Lieb, Beesdo, Mengelers, Krabbendam and Wichers2010a , Reference Tijssen, van Os, Wittchen, Lieb, Beesdo, Mengelers and Wichers b ); T2 (NEMESIS) or T3 (EDSP) CIDI diagnosis of depressive disorder, excluding individuals with a similar diagnosis at T0/T1 (NEMESIS) or T0/T2 (EDSP) and individuals with a T2 (NEMESIS) or T3 (EDSP) CIDI diagnosis of bipolar disorder (Regeer et al. Reference Regeer, Krabbendam, de Graaf, ten Have, Nolen and van Os2006, Reference Regeer, Krabbendam, de Graaf, ten Have, Nolen and van Os2009; Tijssen et al. Reference Tijssen, van Os, Wittchen, Lieb, Beesdo, Mengelers, Krabbendam and Wichers2010a , Reference Tijssen, van Os, Wittchen, Lieb, Beesdo, Mengelers and Wichers b ); and T2 (NEMESIS) or T3 (EDSP) CIDI diagnosis of anxiety disorder, excluding individuals with a similar diagnosis at T0/T1 (NEMESIS) or T0/T2 (EDSP) and also individuals with a T2 (NEMESIS) or T3 (EDSP) CIDI diagnosis of depressive disorder or bipolar disorder (Bijl et al. Reference Bijl, Ravelli and van Zessen1998a , Reference Bijl, van Zessen, Ravelli, de Rijk and Langendoen b ; Zimmermann et al. Reference Zimmermann, Wittchen, Hofler, Pfister, Kessler and Lieb2003). All extra analyses were conducted in strict accordance with the methodology described in the original studies and are therefore not reported again in detail here (details available upon request).
Statistical analysis
All analyses were performed using Stata 11 (StataCorp, 2009). A data file including data pertaining to both psychotic and non-psychotic outcomes was constructed. One study reported five different psychotic outcomes (Chapman et al. Reference Chapman, Chapman, Kwapil, Eckblad and Zinser1994); these were combined into a single psychotic outcome.
First, dichotomized exposures were analysed. For these analyses, each record in the data included sample size, number of subjects with a particular outcome, years of study follow-up and information on modifiers. Using the first three variables, rates per 100 000 person-years were calculated. For each study, at least two records were filled (exposed, non-exposed). More records were used when rates were stratified by possible outcome modifiers (psychotic/non-psychotic disorder, hospital admission yes/no, incident/prevalent exposure). Bar charts were generated to present the rates per study for psychotic and also for non-psychotic outcomes (Saha et al. Reference Saha, Barendregt, Vos, Whiteford and McGrath2008; Linscott & van Os, Reference Linscott and van Os2010).
A meta-analysis stratified by exposure and by type of outcome (psychotic/non-psychotic) generated forest plots (Stata metan command). Subsequently, the rates were analysed using meta-regression analysis (Stata metareg command). As rates are not normally distributed, and the number of studies was small and heterogeneity was expected, meta-regression was repeated using 1000 permutations (Stata metareg command with option permute). In addition, meta-regression analyses were repeated for more homogeneous subsets of studies (as described below).
Second, to study dose–response effects, exposures were analysed as three-level variables including three categories of graded severity/frequency where available; if there were four categories, the two lowest categories were combined to create a similar three-level exposure variable. For this analysis, rates were also presented in a figure and meta-regression analysis was performed.
The study by Chapman et al. (Reference Chapman, Chapman, Kwapil, Eckblad and Zinser1994) was carried out in a sample of students and not in the general population. In addition, there was one study that can be considered an outlier with respect to outcome assessment (hospital admission) (Werbeloff et al. Reference Werbeloff, Drukker, Dohrenwend, Levav, Yoffe, van Os, Davidson and Weiser2012). Therefore, a planned sensitivity analysis was carried out excluding these studies, focusing on the four studies that used comparable CIDI-based methodology (Poulton et al. Reference Poulton, Caspi, Moffitt, Cannon, Murray and Harrington2000; Hanssen et al. Reference Hanssen, Bak, Bijl, Vollebergh and van Os2005; Welham et al. Reference Welham, Scott, Williams, Najman, Bor, O'Callaghan and McGrath2009; Dominguez et al. Reference Dominguez, Saka, Lieb, Wittchen and van Os2010).
Results
Search results
The search yielded seven articles with data that were pertinent to the meta-analysis as specified in the criteria above. One study (Kwapil et al. Reference Kwapil, Miller, Zinser, Chapman and Chapman1997) was excluded as it concerned a subgroup of persons included in the study by Chapman et al. (Reference Chapman, Chapman, Kwapil, Eckblad and Zinser1994), already included in the meta-analysis.
The characteristics of the six studies included in the meta-analysis are listed in Table 1 a . Most studies had general population sampling frames (two birth cohorts: (Poulton et al. Reference Poulton, Caspi, Moffitt, Cannon, Murray and Harrington2000; Welham et al. Reference Welham, Scott, Williams, Najman, Bor, O'Callaghan and McGrath2009); three representative general population cohorts (Hanssen et al. Reference Hanssen, Bak, Bijl, Vollebergh and van Os2005; Dominguez et al. Reference Dominguez, Wichers, Lieb, Wittchen and van Os2011; Werbeloff et al. Reference Werbeloff, Drukker, Dohrenwend, Levav, Yoffe, van Os, Davidson and Weiser2012) and one study presented a representative sample of undergraduate students (Chapman et al. Reference Chapman, Chapman, Kwapil, Eckblad and Zinser1994); follow-up varied from 3 to 24 years. All studies reported on variably defined self-reported psychotic experiences in the general population and the rate of transition to variably defined psychotic and non-psychotic clinical outcomes. One study used high level of schizotypy as predictor (Chapman et al. Reference Chapman, Chapman, Kwapil, Eckblad and Zinser1994); all other studies used CIDI or related measures of subthreshold psychotic experiences. Non-psychotic outcomes were depression, mania, anxiety disorder and admission to hospital for non-psychotic disorder. Some studies described various exposure subgroups, including classification on the basis of number of symptoms (no symptom, single symptom, multiple symptoms); frequency/certainty of psychotic symptoms (no symptom, ‘weak’ symptom and ‘strong’ symptom); psychopathological context (no symptom, symptom without depression, symptom with depression); and degree of persistence over 5 years (present at none, one, two or three assessments over 5 years). Some studies also described rates as a function of combinations of subgroups (e.g. multiple symptoms with and without co-morbid depression; Hanssen et al. Reference Hanssen, Bak, Bijl, Vollebergh and van Os2005). All six studies reported on psychotic clinical outcomes, and five studies additionally reported on other, non-psychotic, clinical outcomes. For one study (Hanssen et al. Reference Hanssen, Bak, Bijl, Vollebergh and van Os2005), measures of both incident (psychotic experiences with first onset in the previous year) and prevalent (lifetime presence of psychotic experiences) exposure were available. One study (Werbeloff et al. Reference Werbeloff, Drukker, Dohrenwend, Levav, Yoffe, van Os, Davidson and Weiser2012) reported service-based clinical outcome, defined as admission to hospital. All study populations were from developed nations including The Netherlands, Germany, Israel, Australia, New Zealand and the USA.
Description of the possible modifiers as causes of heterogeneity of the studies
Four studies (Poulton et al. Reference Poulton, Caspi, Moffitt, Cannon, Murray and Harrington2000; Hanssen et al. Reference Hanssen, Bak, Bijl, Vollebergh and van Os2005; Welham et al. Reference Welham, Scott, Williams, Najman, Bor, O'Callaghan and McGrath2009; Dominguez et al. Reference Dominguez, Wichers, Lieb, Wittchen and van Os2011) used similar methodology for exposure and outcome assessment based on the CIDI (Robins et al. Reference Robins, Wing, Wittchen, Helzer, Babor, Burke, Farmer, Jablenski, Pickens and Regier1988) whereas other studies (Chapman et al. Reference Chapman, Chapman, Kwapil, Eckblad and Zinser1994; Werbeloff et al. Reference Werbeloff, Drukker, Dohrenwend, Levav, Yoffe, van Os, Davidson and Weiser2012) used different instruments. Similarly, all studies reported exposure assessment based on prevalence estimates whereas one study also reported assessment of incident exposure (Hanssen et al. Reference Hanssen, Bak, Bijl, Vollebergh and van Os2005). Another important factor was that one study provided outcomes based on hospital admission (Werbeloff et al. Reference Werbeloff, Drukker, Dohrenwend, Levav, Yoffe, van Os, Davidson and Weiser2012), whereas all other studies were independent of health-care use.
Results for dichotomous exposure meta-analysis
Original study results
Findings from individual studies are summarized in Tables 1 b (psychotic outcomes) and 1 c (non-psychotic outcomes).
All studies showed that subclinical psychotic experiences strongly predicted clinical psychotic outcomes. The 3- to 24-year risk for the exposed was in the range 5–25%, substantially higher than the corresponding risk in the non-exposed (ranging from 0.1% to 3.7%), with 3- to 24-year odds ratios (ORs) in excess of 10 for the strongest level of exposure (Table 1 b ). The ORs for non-psychotic outcomes were weaker, mostly of the order of 2 (Table 1 c ).
Meta-analysis
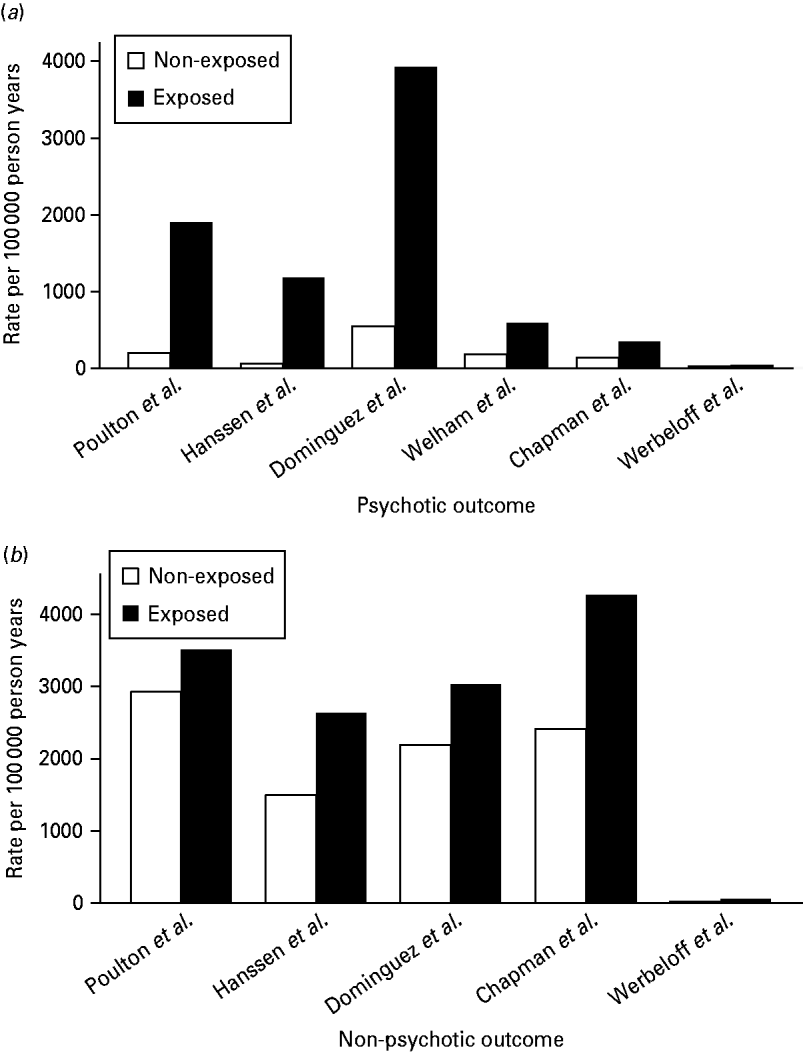
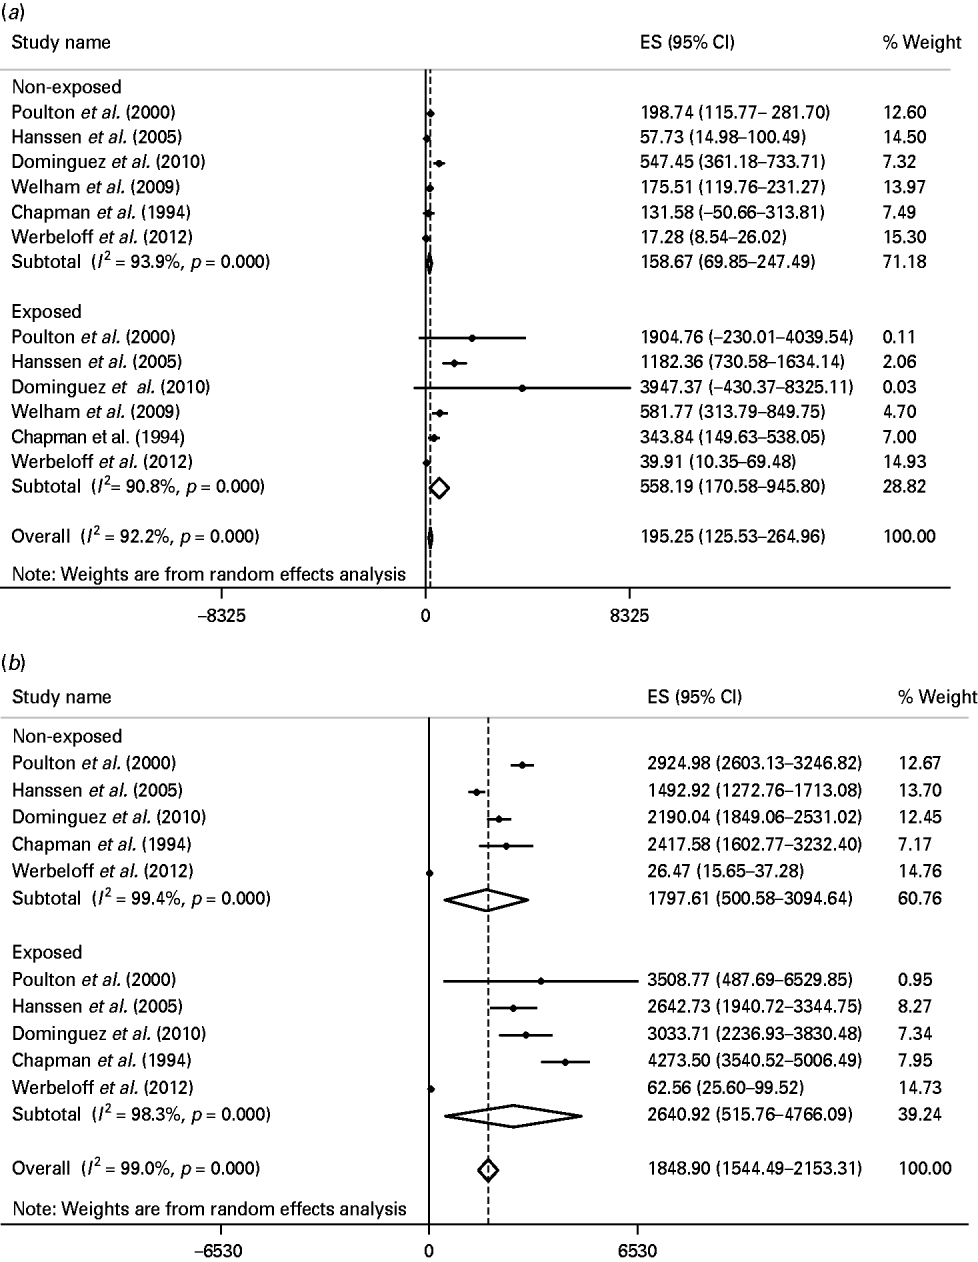
To facilitate comparison, rates for all studies were uniformly transformed to express incidence of psychotic and non-psychotic outcomes per 100 000 person-years (Fig. 1 a, 1 b). This confirmed the pattern of results in Tables 1 b and 1 c , in that the incidence of psychotic clinical outcome in the exposed was much higher than in the non-exposed, and that the difference in incidence between exposed and non-exposed was much greater for psychotic than for non-psychotic clinical outcome. In addition, the results showed that the absolute risk for clinical outcome in the only study based on hospital admission (Werbeloff et al. Reference Werbeloff, Drukker, Dohrenwend, Levav, Yoffe, van Os, Davidson and Weiser2012) was only a fraction of the risk in studies that did not depend on service use.
Rate per 100 000 person-years of (a) psychotic and (b) non-psychotic outcomes in exposed and unexposed subjects (prevalent exposure only).

Meta-analysis results for psychotic (Fig. 2 a) and non-psychotic (Fig. 2 b) clinical outcomes [for the Hanssen et al. (Reference Hanssen, Bak, Bijl, Vollebergh and van Os2005) study, based on NEMESIS data, results with prevalence exposure were included] show that the combined yearly incidence rate of psychotic clinical outcome, given the presence of a prevalent subclinical psychotic experience, was 159 per 100 000 person-years (0.2% per year) in the non-exposed and 558 per 100 000 person-years (0.6% per year) in the exposed. For the non-psychotic outcomes, yearly transition incidence rates for exposed and non-exposed were 2.6% and 1.8% respectively. For non-psychotic outcomes, CIs were wide and for both psychotic and non-psychotic outcomes, CIs overlap (Fig. 2 a, b), indicating that the difference in yearly incidence rate between exposed and non-exposed was non-significant for both psychotic and non-psychotic clinical outcome. Heterogeneity was large (psychotic outcomes non-exposed: χ2=81.6, df=5, p<0.001; psychotic outcomes exposed: χ2=54.1, df=5, p<0.001; non-psychotic outcomes non-exposed: χ2=666.9, df=4, p<0.001; non-psychotic outcomes exposed: χ2=235.4, df=4, p<0.001).
Forest plot of rates per 100 000 person-years of (a) psychotic and (b) non-psychotic outcomes in each study of the exposed and non-exposed subjects, prevalent exposure only.

Planned sensitivity analysis
Excluding the student-based and hospital-based studies (Chapman et al. Reference Chapman, Chapman, Kwapil, Eckblad and Zinser1994; Werbeloff et al. Reference Werbeloff, Drukker, Dohrenwend, Levav, Yoffe, van Os, Davidson and Weiser2012), focusing on the four studies that used similar CIDI-based methodology for exposure and outcome assessment (Poulton et al. Reference Poulton, Caspi, Moffitt, Cannon, Murray and Harrington2000; Hanssen et al. Reference Hanssen, Bak, Bijl, Vollebergh and van Os2005; Welham et al. Reference Welham, Scott, Williams, Najman, Bor, O'Callaghan and McGrath2009; Dominguez et al. Reference Dominguez, Saka, Lieb, Wittchen and van Os2010) revealed transition rates of psychotic outcomes in exposed and non-exposed of 1.0% (95% CI 0.38–1.6) and 0.2% (95% CI 0.09–0.37) respectively, with non-overlapping CIs. For psychotic outcomes, these rates were 2.8% (95% CI 2.3–3.4) and 2.2% (95% CI 1.3–3.1) respectively.
Meta-regression, including the four studies that used similar CIDI-based methodology for exposure and outcome assessment (Poulton et al. Reference Poulton, Caspi, Moffitt, Cannon, Murray and Harrington2000; Hanssen et al. Reference Hanssen, Bak, Bijl, Vollebergh and van Os2005; Welham et al. Reference Welham, Scott, Williams, Najman, Bor, O'Callaghan and McGrath2009; Dominguez et al. Reference Dominguez, Saka, Lieb, Wittchen and van Os2010), suggested that the effect of subclinical self-reported psychotic experiences on psychotic clinical outcome was significant (difference in incidence between exposed and non-exposed 648 per 100 000 person-years, p=0.043), whereas the effect for non-psychotic clinical outcome was not statistically significant (difference in incidence 694 per 100 000 years, p=0.31). Meta-regression using permutations showed similar or more conservative p values (non-psychotic outcomes exposure p=0.52; psychotic outcomes exposure p=0.11; t values were all in the same direction).
Results of the dose–response meta-analysis
Original study results
Where examined, studies reported clear dose–response relationships for variably defined levels of exposure severity (certainty of symptom, frequency of symptom, number of symptoms, persistence over time, co-morbid depression) in relation to risk of transition to psychotic clinical outcome (Tables 1 a and 1 b ). Only weak evidence for dose–response was present for non-psychotic clinical outcome (Tables 1 a and 1 c ).
Meta-analysis
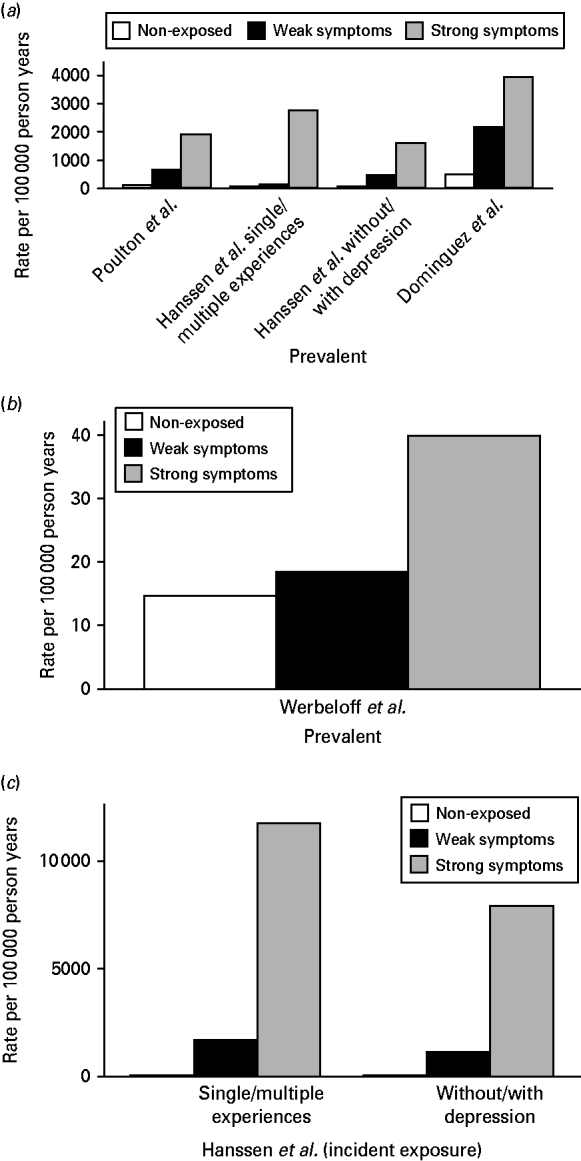
Transformation of all studies to the same person-year denominator showed comparable dose–response effects for psychotic clinical outcome, and also for the study reporting hospital-based outcomes (Werbeloff et al. Reference Werbeloff, Drukker, Dohrenwend, Levav, Yoffe, van Os, Davidson and Weiser2012) and incident exposure assessment (Hanssen et al. Reference Hanssen, Bak, Bijl, Vollebergh and van Os2005). Thus, the bars in Fig. 3 show that rates increase when exposure severity increases. Meta-regression including the three CIDI-based studies with linear multiple categories of exposure (Poulton et al. Reference Poulton, Caspi, Moffitt, Cannon, Murray and Harrington2000; Hanssen et al. Reference Hanssen, Bak, Bijl, Vollebergh and van Os2005; Dominguez et al. Reference Dominguez, Saka, Lieb, Wittchen and van Os2010) showed a statistically significant linear increase in yearly incidence of psychotic outcomes per unit increase in exposure severity (β=962, p=0.02). Permutation analysis of this result was also significant (p=0.03).
Rate per 100 000 person-years of psychotic outcomes in three categories of exposure: (a) outcome is diagnosis, prevalent exposure (b) outcome is hospital admission, prevalent exposure and (c) incident exposure (outcome is need for care).

Discussion
Subjects with a history of subclinical psychotic experiences displayed higher yearly rates of psychotic clinical outcome, as evidenced particularly by significant meta-analytic dose–response effects. The analyses suggest a degree of specificity, indicating increased transition for psychotic but not for non-psychotic outcomes, which was evident particularly in the sensitivity analysis of similar CIDI-based studies. However, this may reflect low statistical power as there were suggestive, albeit attenuated, differences between exposed and non-exposed in the transition to non-psychotic outcomes too (2.6% versus 1.8% respectively). In addition, individuals with transition to psychotic outcomes may have presented with unmeasured affective outcomes earlier in the trajectory. There was meta-analytic evidence for dose–response associated with number, certainty, frequency, persistence and level of affective co-morbidity of psychotic experiences. Furthermore, subsequent analyses in some of the individual studies presented here have also shown the importance of motivational impairment (Dominguez et al. Reference Dominguez, Saka, Lieb, Wittchen and van Os2010) and social dysfunction (Werbeloff et al. Reference Werbeloff, Drukker, Dohrenwend, Levav, Yoffe, van Os, Davidson and Weiser2012). Follow-up of these findings of individual studies is needed in future meta-analytic work when new studies are available.
In combination, these studies provide strong evidence for the validity of the notion that even self-reported subclinical psychotic experiences represent psychometric risk for later psychotic clinical outcome. Although it could be argued that CIDI measures of clinical outcome yield high rates of false positives, the predictive value of subclinical psychotic experiences was also apparent in predicting the ‘hard’ outcome of hospital admission. Additional validity is suggested by the presence of dose–response.
All studies in the meta-analysis assessed self-reports of psychotic experiences, precluding a comparison of transition rates as a function of mode of assessment. Self-reports of psychotic experiences generate false-positive ratings. Depending on how data are analysed, the rate of false-positive self-reported psychotic experiences when verified by clinical interview may vary from 7% (van Os et al. Reference van Os, Hanssen, Bijl and Vollebergh2001) to 61% (Kelleher et al. Reference Kelleher, Harley, Murtagh, Blanchard and Cannon2009). In the study by van Os et al. (Reference van Os, Hanssen, Bijl and Vollebergh2001), lay interviewer CIDI ratings of adult participants were compared with clinicians' ratings after telephone interviews. In the study by Kelleher et al. (Reference Kelleher, Harley, Murtagh, Blanchard and Cannon2009), clinicians' ratings were compared to self-report questionnaires filled out by adolescent participants. There is evidence, however, that ‘false positive’ in this context does not indicate absence of risk. Thus, Bak et al. (Reference Bak, Delespaul, Hanssen, de Graaf, Vollebergh and van Os2003) found that ‘false positive’ psychotic experiences (i.e. the presence of CIDI self-reports of psychotic experiences that were not confirmed by clinical interview) nevertheless were strongly associated with future psychotic disorder, albeit at a lower level than self-reported psychotic experiences confirmed by clinical interview. These findings echo those by Poulton et al. (Reference Poulton, Caspi, Moffitt, Cannon, Murray and Harrington2000), who showed that both ‘definite’ and ‘ likely’ psychotic symptoms predicted later clinical outcomes, and suggest that self-reported psychotic experiences do not come as either ‘true’ or ‘false’ positive. Instead, they may index risk as a continuum reflecting the level of certainty (Poulton et al. Reference Poulton, Caspi, Moffitt, Cannon, Murray and Harrington2000) as to what degree the experience of aberrant attribution of salience (Kapur, Reference Kapur2003) that an individual reports can be regarded as ‘psychotic’. A recent study that specifically compared self-report with interview-based assessment of psychotic experiences in a large general population sample (n=6646) suggested that self-reported psychotic experiences not confirmed by clinical interview may indeed represent the softest expression of an extended phenotype of aberrant attribution of salience that is phenotypically continuous with clinical psychosis, but discontinuous in need for care (van Nierop et al. Reference van Nierop, van Os, Gunther, Myin-Germeys, de Graaf, ten Have, van Dorsselaer, Bak and van Winkel2011).
Methodological issues
A comparison with the high-risk literature is not possible, as studies in this area follow selected samples of help-seeking subjects with psychotic experiences that are not population based, are assessed with different instruments, and use a range of sample enrichment strategies to boost the risk of transition. Nevertheless, the base rate of transition as analysed in this study may serve as a standard against which risk-enriched ultra-high-risk studies are conducted.
Many of the studies have not followed their samples through the age of peak risk for development of psychotic disorders. In addition, in calculating yearly incidence rates, the assumption was that the rate of transition would be spread evenly over the follow-up periods. This may not be valid, as there is some evidence that transition rates may be higher in the first 5–10 years (Werbeloff et al. Reference Werbeloff, Drukker, Dohrenwend, Levav, Yoffe, van Os, Davidson and Weiser2012). Therefore, yearly incidence rates in two studies with longer follow-ups (Poulton et al. Reference Poulton, Caspi, Moffitt, Cannon, Murray and Harrington2000; Welham et al. Reference Welham, Scott, Williams, Najman, Bor, O'Callaghan and McGrath2009) may vary and be somewhat higher in the earlier phases of the follow-up. Similarly, rates may vary according to age and sex, factors that could not be taken into account. Nevertheless, most studies were carried out in young people.
Because the present analysis included only six studies and the analyses focused on rates rather than ORs, funnel plots are difficult to interpret. Publication bias cannot be ruled out, as the small number of studies precluded formally testing this.
Permutation methods within meta-regression have been developed and implemented in Stata (StataCorp, 2009). Permutation is necessary because meta-regression gives increased rates of false positives when the number of studies is small and when heterogeneity is present (Higgins & Thompson, Reference Higgins and Thompson2004). In addition, in the present study the outcomes, which are rates, are not normally distributed, another reason to conduct permutations. As expected, p values were more conservative after permutations, but because results were similar, original coefficients and p values were presented.
The number of studies included in the meta-analysis was small and statistical power low, resulting in inconclusive findings in the more conservative permutation analysis. Nevertheless, meta-analytic evidence of dose–response remained statistically significant even in the permutation analysis.
Conclusions
Subthreshold self-reported psychotic experiences in epidemiological non-help-seeking samples index psychometric risk for psychotic disorder, with strong modifier effects of severity/persistence. The yearly transition rates are low and can serve as the population reference for selected and variable samples of help-seeking individuals at ultra-high risk, for whom much higher transition rates have been indicated.
Acknowledgements
This project was supported by the Netherlands Organization for Scientific Research (NWO) under project number 017.002.048. Dr Köhler was supported by the EU Interreg IVb project ‘Health and demographic changes’ (grant no. 30972507N).
Declaration of Interest
None.