


INTRODUCTION
There is special concern in determining lysine requirements of broiler chickens due to its role as a second limiting amino acid in the improvement of daily weight gain, feed efficiency (FE) and breast meat yield. Moreover, lysine is used as a reference amino acid in an ideal protein concept. Broiler chicken responses to indispensable amino acids may vary depending on dietary protein and energy, genetic strain, sex, experimental conditions and the statistical methods applied. Dietary protein level is one of the most important factors affecting lysine requirement. The relationship between lysine and protein requirements for optimum growth has been reported in many studies (Almquist Reference Almquist1952; Boomgaardt & Baker Reference Boomgaardt and Baker1973; Sterling et al. Reference Sterling, Pesti and Bakalli2003; Abdel-Maksoud et al. Reference Abdel-Maksoud, Yan, Cerrate, Coto, Wang and Waldroup2010). Genetic selections applied by industry have greatly increased growth rate and yield of edible meat, while reducing feed conversion ratio and the slaughter age of modern broiler chickens, thus influencing nutrient requirements (Dozier et al. Reference Dozier, Moran and Kidd2001; Fancher Reference Fancher2006). Although there are several recommendations for amino acid requirements, it is still difficult to choose the most advantageous dietary amino acid pattern, partly due to non-linearity of growth responses to changes in amino acids (Mercer Reference Mercer1982; MacLeod Reference MacLeod, Theodorou and France2000), interactions between or among amino acids, antagonism or toxicity (D'Mello Reference D'Mello1994), and interactions of some amino acids with other nutrients or anti-nutritive factors (Austic Reference Austic, Fisher and Boorman1986).
There is an ever-increasing body of information on lysine requirements of broiler chickens that can be used to make reliable general recommendations for this amino acid. Mathematical models can be used to integrate the available knowledge on nutrient utilization, performance and carcass characteristics of broiler chickens (Ahmadi & Golian Reference Ahmadi and Golian2010). In this way, using the potential of non-linear data-mining tools such as neural networks (NN) is constructive. An NN model is a biologically inspired computing scheme that can uncover highly complex relationships between several input and output variables. This approach has been applied successfully in several fields of broiler chicken production (Ahmadi & Golian Reference Ahmadi and Golian2010; Faridi et al. Reference Faridi, Mottaghitalab, Darmani-Kuhi, France and Ahmadi2011, Reference Faridi, Mottaghitalab and Ahmadi2012). The objectives of the current study were to: (i) compare the responses of two separate groups of pre- and post-2000 broiler chicks to protein and lysine through NN; (ii) determine the relative importance of protein and lysine on average daily gain (ADG) and FE using a sensitivity analysis test; (iii) find the optimum level of dietary protein and lysine required to maximize ADG and FE of chicks in the two time periods; and (iv) compare the predictive ability of NN models with that of classical regression models.
MATERIALS AND METHODS
Description of data
One hundred and eighty lines of broiler chicks’ dose responses (ADG and FE) to protein and lysine were extracted from the literature and arbitrarily divided into two sets of 104 and 76 data lines of pre- and post-2000, respectively. The experiments of pre-2000 were conducted during 1972–93, while post-2000 were conducted from 2000–10. A mixed-sex total of 10 262 birds from Ross, Cobb and Hubbard commercial strains were used in both time periods. The data were collected using the following criteria:
-
1. They appeared in peer-reviewed published articles.
-
2. The levels of lysine were solely used as treatments, except for Costa et al. (Reference Costa, Rostagno, Albino, Gomes, Toledo and de Vargas Junior2001c ) in which different levels of protein were considered as treatments.
-
3. The dietary levels of lysine (total lysine) and protein were clearly defined.
-
4. The ADG (g/bird per day) and FE (g gain/g feed intake) were reported or could be calculated.
-
5. The experiments published after 2000 were conducted over 0–21 days of age, with the exceptions of Abdel-Maksoud et al. (Reference Abdel-Maksoud, Yan, Cerrate, Coto, Wang and Waldroup2010) and Kidd & Fancher (Reference Kidd and Fancher2001) in which the period was from 0 to 18 days and Sterling et al. (Reference Sterling, Pesti and Bakalli2006) in which it was 7–21 days, whereas all experiments published before 2000 were conducted over 7–21 days of age, except for Latshaw (Reference Latshaw1993) who used 0–21 days of age.
The data used to develop NN models for ADG and FE of broiler chicks reared pre- and post-2000 are summarized in Tables 1 and 2, respectively.
Description of the pre-2000 (1972–93) published data used to develop artificial NN models*

* Lys: lysine; M: male; F: female; ME: metabolizable energy (MJ/kg); ADG: average daily gain; FE: feed efficiency; ND: not determined.
Description of the post-2000 (2000–10) published data used to develop artificial NN models*

* Lys: lysine; M: male; F: female; ME: metabolizable energy (MJ/kg); ADG: average daily gain; FE: feed efficiency; ND: not determined.
NN model development
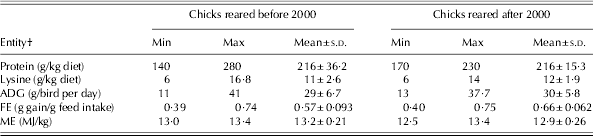
Determining an appropriate network topology is one of the most critical tasks in NN model development. The NN's topology is determined by its size, synaptic weight connections and the hidden-units activation function (Andrews et al. Reference Andrews, Morris and Bonner2008). In the current study, four feed-forward multilayer perceptrons, each with protein (g/kg diet) and lysine (g/kg diet) as input variables, were employed to predict ADG and FE in chicks raised in either time period. The configuration of all developed models consisted of only one hidden layer. In all the models developed, the hyperbolic tangent was considered as an activation function, whereas the quasi-Newton method was used as a training algorithm and two different random data groups were considered in developing models. The first group was the training set and used for updating the network weights and biases, and the remainder was used as the testing set. The range of data used to develop the models during both time periods is summarized in Table 3. The Statistica Neural Networks software version 8.0 was used to construct and train the NN models (StatSoft 2009). Quantitative examination of the predictive ability of both models was made by R 2, mean square error and bias.
The ranges of data used to develop the NN models for pre- and post-2000 chicks’ responses to protein and lysine*
* Before 2000 refers to 1972–93 and after 2000 refers to 2000–10.
† ADG: average daily gain; FE: feed efficiency; ME: metabolizable energy.
Sensitivity analysis
A sensitivity analysis technique indicates the input variables that are considered as the most important variables in the developed model. This often identifies variables that can be safely ignored in subsequent analysis, and key variables that must always be retained (Faridi et al. Reference Faridi, Mottaghitalab and Ahmadi2012). There are several approaches for conducting sensitivity analyses. The sensitivity of response models to protein and lysine as input variables was determined by the missing value problem proposed by Hunter et al. (Reference Hunter, Kennedy, Henry and Ferguson2000); in this method each input variable is replaced in turn with missing values and the effect upon the output error, named variable sensitivity error (VSE), is assessed. By the same token, the variable sensitivity ratio (VSR) is a relative indication of the ratio between the VSE and the error of the developed model when all variables are available. The more important variable is matched with the higher VSR (Lou & Nakai Reference Lou and Nakai2001; Ahmadi & Golian Reference Ahmadi and Golian2010).
Model optimization
Optimization is defined as finding a set of values for input variables in which the predictive model yields the desired responses. Therefore, the optimized ADG and FE models describe the levels of dietary protein and lysine required for maximum ADG and FE. The random search method, a common optimization method provided in the Statistica software (StatSoft 2009), was applied to the models developed. In this method, iterative random samples of the input variables are taken and model prediction is computed and compared with the best value found from the previous iterations. If the newly found value is better than the previous one, the new results are stored. This process is repeated until the end of iterations is reached. The random search should be confined to the data range in which the models were developed, otherwise it may lead to unreliable results.
Regression models
Conventional linear regression models were compared to the NN models. The data investigated were subjected to linear regression analysis using the REG procedure of SAS (1999). Both dietary protein and lysine levels were considered in developing regression models for ADG and FE responses. The regression models were developed based on the same training data used to develop NN models, and the testing sets were used to evaluate the performance of the regression models.
RESULTS
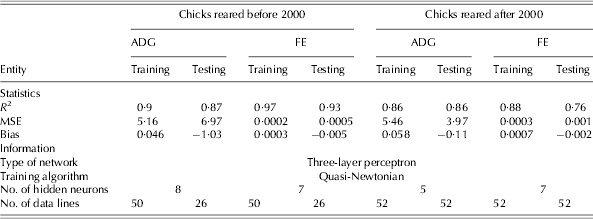
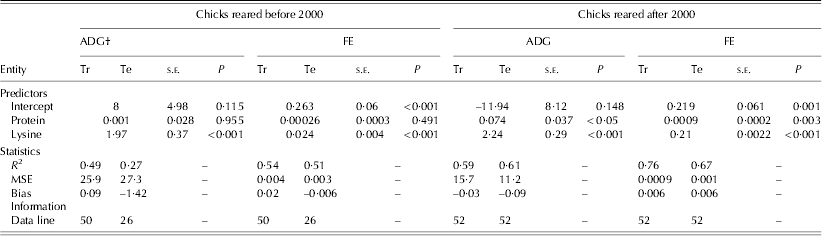
The statistics and information used to develop the NN and regression models to study the responses of chicks reared before and after 2000 are shown in Tables 4 and 5, respectively. The NN models showed a higher coefficient of determination compared to that of the regression models. The calculated values of goodness of fit indicated that in all developed NN models, the training sets provided higher values of R 2 than those in the testing sets, with the exception of the ADG model for chicks raised after 2000, in which a similar value of R 2 in both training and testing sets was achieved (Table 4). As measured by bias, all the developed models showed very little over- and under-estimation of ADG and FE for broiler chicks.
Statistics and information for the development of NN models to estimate ADG and FE of birds reared before and after 2000*
* Before 2000 refers to 1972–93 and after 2000 refers to 2000–10; MSE: mean square error.
Statistics and information for the development of linear regression models to estimate the ADG and FE of birds reared before and after 2000*
* Before 2000 refers to 1972–93 and after 2000 refers to 2000–10.
† MSE: mean square error; Tr: training set; Te: testing set; s.e.: standard error.
Scatter plots of NN models for actual v. predicted values of ADG and FE for chicks reared before and after 2000 are shown in Figs. 1–4, respectively. Moreover, based on the developed NN models using a distance-weighed least squares fitting method, 4 three-dimensional graphs were generated to show the responses of chicks to simultaneous changes in protein and lysine (Figs. 5–8).
Scatter plot of actual v. model-predicted values for ADG (g/bird per day) for pre-2000 chicks (1972–93; black dots). (a) Training set (n = 50); (b) testing set (n = 26). The solid line shows the simple regression line fitted on the scatter points.

Scatter plot of actual v. model-predicted values for FE (g gain/g feed intake) for pre-2000 chicks (1972–93; black dots). (a) Training set (n = 50); (b) testing set (n = 26). The solid line shows the simple regression line fitted to the scatter points.

Scatter plot of actual v. model-predicted values for ADG (g/bird per day) for post-2000 chicks (2000–10; black dots). (a) Training set (n = 52); (b) testing set (n = 52). The solid line shows the simple regression line fitted to the scatter points.

Scatter plot of actual v. model-predicted values for FE (g gain/g feed intake) for post-2000 chicks (2000–10; black dots). (a) Training set (n = 52); (b) testing set (n = 52). The solid line shows the simple regression line fitted to the scatter points.

Distance-weighted least squares plot of changes in model predicted values of ADG (g/bird per day) for pre-2000 (1972–93) chicks fed diets different levels of protein and lysine.

Distance-weighted least squares plot of changes in model predicted values of FE (g gain/g feed intake) for pre-2000 (1972–93) chicks fed diets different levels of protein and lysine.

Distance-weighted least squares plot of changes in model predicted values of ADG (g/bird per day) for post-2000 (2000–10) chicks fed diets different levels of protein and lysine.

Distance-weighted least squares plot of changes in model predicted values of (FE (g gain/g feed intake) for post-2000 (2000–10) chicks fed diets different levels of protein and lysine.

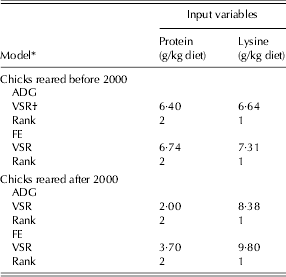
The relative importance of the input variables to broiler responses was determined using a sensitivity analysis test. The sensitivity analysis results for all of the NN models indicated that the responses of broiler chicks (ADG and FE) were more sensitive to dietary lysine (VSR = 6·64 and 7·31 for ADG and FE of pre-2000 and 8·38 and 9·8 for post-2000, respectively) than to protein (VSR = 6·4 and 6·74 for ADG and FE of pre-2000 chicks, and 2 and 3·7 for post-2000 chicks, respectively; Table 6).
Overall sensitivity analysis of input variables in the NN models for the ADG and FE during the starter period for chicks reared in two time periods
* Before 2000 refers to 1972–93 and after 2000 refers to 2000–10.
† VSR: variable sensitivity ratio.
The optimization results for all the developed models during two time periods are summarized in Table 7. The ranges of protein and lysine in the optimization process were the same as the ranges used to develop the model (Table 3). The optimization of models developed based on the data published before 2000 indicated that maximum ADG (32·6 g/bird per day) and FE (0·594 g gain/g feed intake) were achieved with diets containing 241·3 and 247 g protein and 10·76 and 11·18 g lysine/kg diet, respectively. Based on the data published after 2000, maximum ADG (33 g/bird/day) and FE (0·692 g gain/g feed intake) were obtained with diets containing 224·3 and 228·3 g protein and 11·75 and 13·1 g lysine/kg diet, respectively. These results indicate that the optimum dietary protein levels to maximize ADG and FE in chicks reared after 2000 were lower than for those reared before 2000.
Optimization analysis of the artificial NN models to achieve maximum ADG and FE in the starter period for chicks reared in two time periods
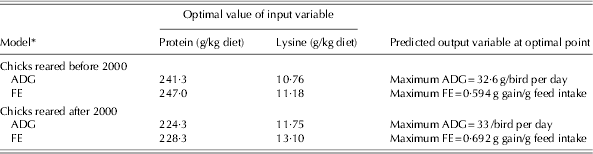
* Before 2000 refers to 1972–93 and after 2000 refers to 2000–10.
DISCUSSION
In the current study, NN models were developed to investigate the response of broiler chicks to dietary protein and lysine in data groups covering two different time periods. The prediction ability of the NN models was compared with that obtained from the regression models. The results indicated that the NN-based estimation technique for chicks’ responses to protein and lysine is more suitable than conventional regression analysis, partly due to the non-linear responses of chicks to protein and lysine.
In the current study, the calculated values of VSE and VSR were considered as criteria to determine the relative importance of protein and lysine on model output (ADG and FE). The input variables with VSR ⩽ 1 can be safely ignored in the model development, whereas a higher value of VSR indicates a more important variable in the developed model. In all of the developed NN models, the calculated values of VSR for protein and lysine were >1, which indicates the significant influence of dietary protein and lysine levels on the performance of chicks. Similar findings have been reported by other researchers investigating the response of broiler chicks to dietary protein and lysine (Sterling et al. Reference Sterling, Pesti and Bakalli2002, Reference Sterling, Pesti and Bakalli2003). However, the weight for dietary protein and lysine on the responses of chicks usually depends on the experimental design and the statistical methods. The sensitivity analysis of the NN models developed for two time periods showed that the response of broiler chicks was more sensitive to lysine than to protein. In accordance with the current findings, Gous & Morris (Reference Gous and Morris1985) stated that chick growth is strictly a function of the first limiting amino acid and is not influenced by protein intake. The higher sensitivity of chicks’ growth and FE to lysine in the models developed may be proof of the postulated concept to ‘decrease the levels of dietary protein and balance the most critical essential amino acids in order to decrease the dietary costs and the nitrogen excretion to environment’ (Lopez & Leeson Reference Lopez and Leeson1995; Kidd et al. Reference Kidd, Kerr, Firman and Boling1996). Nitrogen retention efficiency can be increased by feeding a low protein diet supplemented with essential amino acids in a pattern that meets maintenance and tissue accretion requirements.
Simultaneous changes in protein and lysine levels while tracking the responses of chicks can help nutritionists evaluate the combined effects of protein and lysine (Figs. 5–8). In each graph, the variation in dietary protein and lysine is considered in the range of the experimental dataset. Based on these figures, the highest values of ADG and FE can be achieved at the high levels of dietary protein and lysine. However, at the low levels of dietary protein, the increased lysine had a more pronounced effect on ADG and FE compared to the increased protein at low lysine levels. Therefore, the models developed show that the chicks’ responses are more sensitive to lysine than to protein.
One of the most useful applications of the NN models is to subject them to the optimization process to find the optimum level of input variables (protein and lysine requirements), which would lead to the desired responses. Optimization results for the models developed based on the data published before 2000 indicated that maximum ADG and FE were achieved with diets containing 241·3 and 247 g protein and 10·76 and 11·18 g lysine/kg diet, respectively. A wide range of lysine, from 8·5 (Hewitt & Lewis Reference Hewitt and Lewis1972) to 14·1 g/kg diet (Han & Baker Reference Han and Baker1991) has been suggested in the literature to achieve maximum ADG and FE. Such differences in lysine recommendations may be due to differences in the genetics, environments and dietary factors in those experiments. The optimization results for the models developed from post-2000 data indicated that maximum ADG and FE could be obtained with diets containing 224·3 and 228·3 g protein and 11·75 and 13·1 g lysine/kg diet, respectively. The lysine requirement of 11·74 (Barboza et al. Reference Barboza, Rostagno, Albino and Rodrigues2000) to 13·5 g/kg diet (Corzo & Kidd Reference Corzo and Kidd2004) was suggested for the chicks raised after 2000. However, the optimum level of dietary lysine to maximize performance is influenced by dietary protein level and amino acid balance (Abdel-Maksoud et al. Reference Abdel-Maksoud, Yan, Cerrate, Coto, Wang and Waldroup2010). The results of the current study indicated that the optimum level of dietary lysine for chicks reared after 2000 was higher than that suggested by NRC (1994) for maximum weight gain (11·75 v. 11 g/kg) and FE (13·1 v. 11 g/kg) with the starter diet.
The optimization results showed that the optimum dietary protein to maximize ADG and FE in chicks reared after 2000 was lower than for those reared before 2000, while the requirement for lysine, which increases protein synthesis and decreases protein degradation in chicks, was higher. The change in lysine requirement may be due to the genetic alterations of meat-type birds through breeding programmes (Kidd & Fancher Reference Kidd and Fancher2001); therefore genetic alteration may be the reason for the higher lysine requirement found in the current study in broiler chicks reared after 2000 as compared to those reared before 2000.
Although more data are required to confirm this hypothesis, due to similar ADG for chicks reared after and before 2000 (33 v. 32·6 g/bird per day) and higher values of FE for those reared after 2000 (0·692 v. 0·594 g gain/g food intake), it is postulated that the genetic selection pressure applied by the breeder companies during previous decades was focused more on FE than on ADG. Similarly, Sterling et al. (Reference Sterling, Pesti and Bakalli2006) stated that breeding companies had focused on improving FE and higher meat yields in the previous decade. It should be noted that the main proportion of data collected after 2000 was from 1 to 21 days of age, whereas the bulk of data collected for birds of before 2000 was from 7 to 21 days of age, which may have caused the equal ADG for chicks of the two time periods. Moreover, the high protein requirement found for broilers raised before 2000 might be true because of the complex and low-quality ingredients used pre-2000 compared with recent maize–soy diets. From the animal nutrition point of view, plant breeders have tried to produce high-quality plants with: minimum use of resources (e.g. water, fossil energy, etc.), increased resistance to pests, low anti-nutritional factors and an increase in the bioavailability of nutrients such as amino acids, fatty acids and minerals (Flachowsky et al. Reference Flachowsky, Chesson and Aulrich2005). Moreover, the use of new techniques (genetic engineering) to modify the genetic makeup of plants has led to a new generation of genetically modified plants with improved nutritive values. Lucas et al. (Reference Lucas, Taylor, Hartnell, Nemeth, Glenn and Davis2007) compared the nutritional value of lysine maize (genetically modified maize with high levels of lysine) and conventional maize in broiler diets and concluded that the genetically modified maize can be more nutritious than conventional maize, without any unexpected effects on bird health or performance.
The current results indicated that the protein and lysine requirements suggested by the NN models to maximize FE were relatively higher than those for ADG. Similarly, Han & Baker (Reference Han and Baker1993) and Leclercq (Reference Leclercq1998) reported that the lysine requirement for feed conversion is higher than that for weight gain in broiler chicks. However, the most economical levels of dietary protein and amino acids in feed may not necessarily reflect the levels that are required for maximum growth, but the diets providing the largest difference between costs and returns (Costa et al. Reference Costa, Miller, Houston and Pesti2001a ).
The optimization processes conducted in the current study did not consider the economic benefits. In addition, the nutrient requirements may differ based on the criteria chosen for production purposes (e.g. maximum ADF, FE, breast meat, edible meat or minimum abdominal fat). It is worth pointing out that the available data in the poultry literature are limited and finding a large and sufficiently homogeneous dataset for a specific genetic line of bird with the same experimental design and diet is impossible. However, modellers should look to find the most useful and reliable data based on the criteria and objectives of their study.
In conclusion, the NN models can act as a facilitator to understand the relationship between dietary nutrients (protein and lysine) and chicks’ responses (ADG and FE) when large datasets are used. The sensitivity analysis revealed that, in all the developed models, the responses of broiler chicks were more sensitive to lysine than protein. The optimization results showed that protein and lysine requirements for maximum performance of broiler chicks after 2000 are lower and higher, respectively, compared to those reared before 2000.
The authors would like to thank the Office of Vice President of Research, Ferdowsi University of Mashhad for the funding of this project (no. 2/16521-15-10-1389).



