Introduction
The goal of ex situ conservation is to preserve genetic variation, as well as the biological and economic potential of species of interest (National Research Council, 1993). This strategy is relevant at times when there are major threats to plant resources due to changes in land use, including agricultural practices and habitat fragmentation and degradation, from overexploitation or as a result of the attack of exotic pests and diseases (Zoro Bi et al., Reference Zoro Bi, Maquet, Degreef, Wathelet and Baudoin1998; Goodall-Copestake et al., Reference Goodall-Copestake, Hollingsworth, Hollingsworth, Jenkins and Collin2005; Feres et al., Reference Feres, Guidugli, Mestriner, Sebbenn, Ciampi and Alzate-Marin2009; Khoury et al., Reference Khoury, Laliberte and Guarino2010; Xie et al., Reference Xie, Agrama, Kong, Zhuang, Hu, Wan and Yan2010). The goal of the present study was to design ex situ germplasm collection guidelines by incorporating the genetic structure of a plant species under attack by an exotic forest pest.
Sampling strategies for adequate ex situ conservation of plant genetic variation have been examined by many authors, with various proposed outcomes (Marshall and Brown, Reference Marshall, Brown, Frankel and Hawkes1975; Lawrence et al., Reference Lawrence, Marshall and Davies1995a, Reference Lawrence, Marshall and Daviesb; Lawrence and Marshall, Reference Lawrence, Marshall, Maxted, Ford-Lloyd and Hawkes1997). However, the number of plants needed to capture most of the alleles in a population differs widely among the studies, with some proposing that a small number of plants are sufficient to capture most of the alleles in a population (Marshall and Brown, Reference Marshall, Brown, Frankel and Hawkes1975; Lawrence et al., Reference Lawrence, Marshall and Davies1995a, b). Other authors have recommended divergent sampling strategies for highly heterogeneous and homogeneous populations (Hawkes, Reference Hawkes1980; Yonezawa and Ichihashi, Reference Yonezawa and Ichihashi1989). However, these recommendations differ from the guidelines for rare plant collections recommended by the Center for Plant Conservation (CPC), wherein at least 50 individuals from each of up to 50 populations are recommended to maximize genetic diversity in the sample (Center for Plant Conservation, Reference Faulk and Holsinger1991; Guerrant et al., Reference Guerrant, Fiedler, Havens, Maunder, Guerrant, Havens and Maunder2004; Trusty et al., Reference Trusty, Miller, Boyd and Goertzen2009). By contrast, Brown and Hardner (Reference Brown, Hardner, Young, Boyle and Boshier2000) have stated that 15 individuals should be sampled per population to capture alleles with >0.10 frequency for tree species.
The USA is experiencing a prolific invasion of the emerald ash borer (EAB). Native to Asia, Agrilus planipennis Fairmaire is a wood-boring pest of ash trees (Haack et al., Reference Haack, Jendek, Liu, Marchant, Tetrice, Poland and Ye2002). While adult beetles cause relatively minimal damage while feeding on foliage, larvae feeding on phloem disrupt water and nutrient transport. Once infested, tree mortality occurs within 2 to 4 years (Herms et al., Reference Herms, Stone, Chatfield, Chatfield, Draper, Mathers, Dyke, Bennett and Boggs2004). As of 2013, EAB distribution included established populations in 18 US states and Canada. This invasion potentially compromises the future of every New World species within the Fraxinus genus (Widrlechner, Reference Widrlechner2010).
Our specific objective was to establish a sampling protocol for ex situ conservation of green ash (Fraxinus pennsylvanica) based on genetic structure. Five microsatellite marker loci were used to determine the genetic diversity of green ash from eight Metroparks near Toledo, Ohio. Using these marker data, we determined the genetic structure and variability within and among the populations to define a germplasm sampling strategy that maximizes the genetic diversity preserved for the area sampled. It is necessary to establish sampling priorities because of the continued spread of the EAB, the nearly complete mortality rate once infested, and the potential for functional extinction of ash in the native forested landscape.
Materials and methods
Study species
F. pennsylvanica Marsh. (green ash) was selected as the model species because of its distribution and dominance throughout the state of Ohio. These perennial, dioecious trees are wind pollinated and have wind-dispersed seeds. Reproductive maturity outside cultivation may take 10 to 25 years with abundant seed crops being produced in 3- to 5-year cycles (Bonner, 1974). F. pennsylvanica has the broadest distribution among all the New World Fraxinus species and is found across 42 of the lower 48 states (excluding most Western states) and much of Canada (USDA NRCS, 2010).
Study site
This study was conducted in Northwest Ohio in Lucas County. In the spring of 2005, eight populations of F. pennsylvanica were selected from eight Metroparks in the Toledo area. The distance between the populations (parks) ranges from 2.4 to 36.1 km with an average distance of 16.8 km. These areas represent over 2800 ha of natural, historical and cultural parklands in Lucas County, including the Oak Openings Region, the Great Black Swamp, the Maumee River, the Ottawa River and Swan Creek corridors (Fig. S1, available online).
Sample collection
In 2005, leaf tissue samples were collected from 15 trees within each of the eight populations (15 trees × 8 populations = 120 samples). Two samples failed to yield good-quality DNA, leaving 118 trees for genetic analysis. There was a minimum distance of 15–20 m between the selected trees. This distance between trees is typically used when sampling trees for germplasm collections (National Research Council, 1991, 1993; Guarino et al., Reference Guarino, Ramanatha Rao and Reid1995). Pole pruners were used to clip the tips of branches with expanding leaves. The leaves were then placed into plastic freezer bags and kept at − 20°C until being transferred to the laboratory. Samples were then kept at − 80°C until DNA extraction. Geographical coordinates for all trees were taken with a Garmin eTrex® Legend HCx® GPS unit (Garmin International, Inc., Olathe, KS, USA), and a permanent metal tag with a distinct identification number was attached to the south-facing base of each tree sampled.
DNA isolation
Total genomic DNA was extracted from the leaves of each ash tree using a modification of the cetyltrimethylammonium bromide (CTAB) protocol described by Cullings (Reference Cullings1992) and Doyle and Doyle (Reference Doyle and Doyle1987). The genetic structure was determined based on five microsatellite loci: Femsatl 1, Femsatl 4, Femsatl1 11, Femstal1 6 and Femsatl1 9. These markers were developed for a European species of ash, Fraxinus excelsior L., and were tested in 14 other species within the genus including our study sample, F. pennsylvanica (Lefort et al., Reference Lefort, Brachet, Frascaria-Lacoste, Edwards and Douglas1999). Polymerase chain reactions (PCRs) were carried out using the PTC-200 DNA Engine Thermal Cycler (MJ Research, Watertown, MA, USA) in a 20 μl solution containing 50–80 ng of genomic DNA, 10 mM Tris buffer, pH 8.0, 10 mM MgCl2, 0.2 mM dNTPs, 0.5 μM of each primer, and 1 unit of Taq polymerase (Fermentas, Vilnius, Lithuania). The PCR program included an initial denaturing step of 1 min at 96°C, followed by 35 cycles of 1 min at 94°C, 30 s at 45°C (Femsatl1 11 and Femstal1 6), 50°C (Femsatl 4), 54°C (Femsatl 19) or 56°C (Femsatl 1), and 1 min at 72°C and a final extension cycle of 2 min at 72°C. After the initial PCR, a second PCR was conducted using the leading universal M13 ( − 21) sequence labelled with WellRED fluorescent dyes (D4-TGT AAA ACG ACG GCC AGT-3′) as the primer (Schuelke, Reference Schuelke2000). For the second reaction, all PCR conditions were kept the same as described above, except for a 48°C annealing temperature. Genotyping was conducted using capillary electrophoresis on an automated genomic DNA analysis system (CEQ 8800; Beckman Coulter, Fullerton, CA, USA). For capillary electrophoresis, 4 μl of PCR product were mixed with 28 μl of formamide and 0.4 μl of 400 bp DNA size standard (Genolab; Beckman Coulter, Fullerton, CA, USA). Fragments were identified on the basis of their size and according to their mobility in relation to the size standard based on a cubic function according to the manufacturer's recommendation (Roby et al., Reference Roby, Dobbs, Clark, Boyer and Threadgill2000; Beckman Coulter, Inc., 2009).
Genetic diversity analysis
Genetic variability within and between the populations was analysed using the program POPGENE 1.31 (Yeh et al., Reference Yeh, Yang and Boyle1999) to determine the observed and effective number of alleles and observed and expected heterozygosity for each locus and as averaged over all the loci, as well as to calculate Nei's genetic diversity (Nei, Reference Nei1978). Samples collected from trees in each of the eight parks were considered as samples taken from independent populations. To determine how genetic variation is distributed, POPGENE 1.31 was used assess Wright's inbreeding coefficient (F IS) and determine genetic structure from hierarchical F-statistics, including the overall inbreeding coefficient (F IT) and the genetic variance among the populations (F ST). Differences in allele frequencies were assessed by conducting a Fisher exact test (Fisher, Reference Fisher1925; Weir, Reference Weir1996).
Genetic structure analysis
Spatial structure was determined using the software STRUCTURE (version 2.3.3; Hubisz et al., Reference Hubisz, Falush, Stevphens and Pritchard2009), which is a Bayesian model-based algorithm that identifies groups of individuals based on their genotypes at multiple loci. This method infers the presence of distinct populations by assigning individuals to a user-defined number of clusters or gene pools. The number of population clusters (K) is estimated by the probability that an individual belongs to a given cluster Pr(X/K) (Pritchard et al., Reference Pritchard, Stephens and Donnelly2000). STRUCTURE predicts the most likely number of subpopulation clusters for the populations sampled and recalculates F-statistics. All STRUCTURE runs used a burn-in length of 20,000, followed by 100,000 Markov chain Monte Carlo repetitions. Options were selected to allow admixture, assume independence among the loci and ignore population affiliations when defining clusters. To determine the likeliest number of subpopulation clusters (K), we followed the methodology proposed by Evanno et al. (Reference Evanno, Regnaut and Goudet2005). All probable K values (2–8) were run 20 times to obtain ΔK, which is an ad hoc measure based on the second-order rate of change in the likelihood function with respect to each K value (Evanno et al., Reference Evanno, Regnaut and Goudet2005). According to this procedure, the modal value of ΔK can be used as an indicator of the number of ancestral population clusters in the area. The ΔK value was based on the rate of change in the log probability of the data between successive K values. The software program STRUCTURE HARVESTER version 6.0 (Earl and von Holdt, Reference Earl and von Holdt2011) was used for calculating the parameters of Evanno et al. (Reference Evanno, Regnaut and Goudet2005). Furthermore, to determine whether there was a relationship between the genetic distance among the populations and their geographical proximity, a Mantel correlation test was carried out on a pairwise matrix of F ST/(1 − F ST) and the natural logarithm of geographical distance in km (Rousset, Reference Rousset1997; Heuertz et al., Reference Heuertz, Hausman, Tsvetkov, Frascaria-Lacostes and Vekemans2001). The pairwise degree of relatedness between the populations, based on Nei's (Reference Nei1973) genetic distances, was used to construct a dendrogram with the Unweighted Pair Group Method with Arithmetic Mean (UPGMA) method in the software package TFPGA version 1.3 (Miller, Reference Miller1997).
Sampling strategy
We examined the relationship between the number of individuals sampled and the number of alleles captured. To do so, we determined the cumulative number of alleles in our collective sample as each of the 118 individuals in our study was randomly added to it. In addition, we replicated each genotype in our sample an equal number of times until a population size of about 10,000 was reached as proposed by Bashalkhanov et al. (Reference Bashalkhanov, Pandey and Rajora2009). On doing so, the resulting dataset had the same distribution of allele frequencies as the original sample, and it was used to generate four sets of 50 test subsamples of 20, 50, 75 and 100 individuals, respectively. The mean cumulative number of alleles was calculated for each sample size. Computations were carried out using Microsoft Excel 2010.
Germplasm collection recommendations were established based on a probability model developed by Yonezawa and Ichihashi (Reference Yonezawa and Ichihashi1989). This model calculates the probability of capturing all alleles in a population given their frequencies, the number of mother trees to be sampled and the number of seeds to be collected per mother tree. The sampling probability was estimated for a theoretical population where five loci have four alleles with two alleles found at a high frequency (>0.45) and the other two alleles found at a low frequency (0.005). These frequencies were established as a reasonable comparison to the measured allele frequencies identified in this study, in which approximately 40% of the allele frequencies were < 1%. The probability that all alleles at each of the five loci (20 alleles in total) are captured in our theoretical sample is the product of the probability at each locus. Different sampling strategies were examined by varying the number of seeds collected (50, 100 and 200) from each of three, five or ten mother trees. An effective sampling strategy was identified when the number of seeds collected per mother tree resulted in at least 99% probability of capturing all alleles.
Results
Allelic diversity
There were high levels of allelic diversity in F. pennsylvanica for all the five microsatellite loci and across all the populations included in the study. There were a total of 82 alleles identified from 118 individuals. The observed number of alleles per locus ranged from 10 to 24; however, the effective number of alleles per locus ranged from 4.3 to 15, indicating that many alleles were found at a low frequency ( < 0.1) (Table 1). In addition, our data also revealed that the observed heterozygosity was roughly 10% higher (H O= 0.9075) than that expected (H E= 0.8054) based on the Hardy–Weinberg equilibrium (average F IS= − 0.123) (Table S1, available online).
Levels of genetic diversity in green ash (Fraxinus pennsylvanica) from eight Metroparks in Toledo, Ohio, estimated using five microsatellite loci from (a) variation in the observed (n a) and effective (n e) number of alleles per locus and (b) mean number of alleles (N a), mean effective number of alleles per locus (N e), mean observed heterozygosity (H O), Levene's expected heterozygosity (H E) and inbreeding coefficient (F IS) for each of the populations

N, sample size; st. dev., standard deviations.
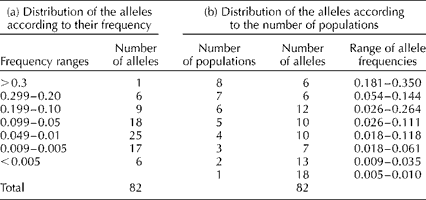
We found that 16 of the 82 alleles were found at frequencies >0.10 (Table 2). However, only six of the common alleles were present in all the eight sampling locations, while six were found in seven locations (Table 2). These alleles were considered to be common and widespread (sensu; Marshall and Brown, Reference Marshall, Brown, Frankel and Hawkes1975). There was a single allele with a frequency >0.10 present at four locations, suggesting that all locally common alleles were included in this sample. Moreover, we also found 25 low-frequency alleles (0.01 ≤ P≥ 0.05) and 23 rare alleles (P< 0.01).
Distribution of the number of alleles according to (a) their frequency among the trees sampled and (b) the number of populations where the alleles were founda
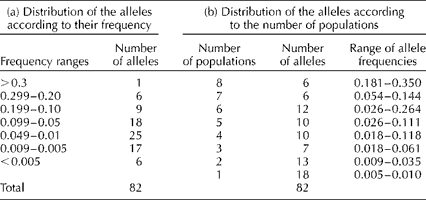
a The range of allele frequencies for the alleles found in each of the populations is also given.
Genetic differentiation among the populations
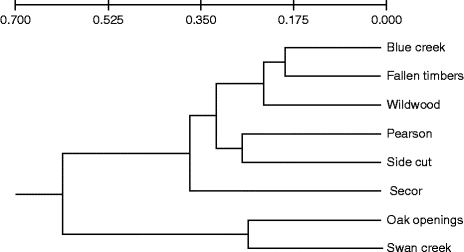
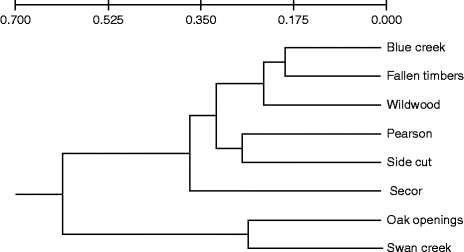
Genetic differentiation among the populations was visualized with an UPGMA-created dendrogram that identified six nodes based on Nei's genetic distance (Fig. 1). Across all the eight populations, there were moderate levels of differentiation (F ST= 0.083) and low levels of inbreeding (F IS= − 0.171) (Table S2, available online). However, no significant relationship between genetic and geographical distances was identified when comparing F ST/(1 − F ST) ratios (Rousset, Reference Rousset1997) for pairs of populations in relation to the natural logarithm of geographical distance (Mantel test, P= 0.54 and R 2= − 0.056) (Fig. S2, available online).
Genetic relationship between green ash populations from eight Toledo Metroparks. The Unweighted Pair Group Method with Arithmetic Mean dendrogram is based on Nei's (Reference Nei1973) standard genetic distances estimated from five polymorphic loci.
The STRUCTURE analysis identified three distinct clusters among the eight populations (K) (Fig. S3, available online). The likelihood that individual trees belong to each cluster varied within and between the populations. Trees from two populations, Oaks Opening and Swan Creek, consistently exhibited a higher likelihood of belonging to cluster 1. Cluster 2 predominately included the populations from Side Cut and Wildwood. The other four populations (Blue Creek, Fallen Timbers, Pearson and Secor) exhibited a higher likelihood of belonging to cluster 3 (Fig. 2).
Population structure of green ash populations from eight Toledo Metroparks as determined using STRUCTURE. STRUCTURE identified three distinct clusters: cluster 1 (Oak Openings and Swan Creek), cluster 2 (Side Cut and Wildwood) and cluster 3 (Blue Creek, Fallen Timbers, Pearson and Secor). Each pie chart illustrates the proportional assignment of individuals at each location to each of the three clusters.

Sampling design
When we examined the relationship between the number of individuals sampled and the number of alleles captured, we found a logarithmic relationship between the number of individuals included in our sample and the number of alleles carried by them (Fig. 3). In general, most of the common alleles were included in a sample of only 15–20 individuals. When sample sizes exceeded 20, the likelihood of finding a new allele as an additional individual added to the sample was relatively low, one new allele for every additional two to three individuals included in the sample.
(a) Relationship between the sample size and the number of alleles captured in the sample. Cumulative number of alleles was calculated by randomly adding a new individual until all the 118 green ash trees included in this study were sampled. (b) Average number of alleles captured in a sample of 20, 50, 75 and 100 trees. Samples were taken, as proposed by Bashalkhanov et al. (Reference Bashalkhanov, Pandey and Rajora2009), from a sample of 10,000 individuals that replicated the abundance of each genotype to maintain the same allele frequencies as the original sample of 118 trees.

We examined the average number of alleles captured in the 50 samples of 20, 50, 75 and 100 individuals taken at random from 10,000 individuals (Fig. 3). We found that, on average, sample sizes of 100 individuals would capture most of the alleles (average = 78.74), but only seven of these 50 samples effectively captured all the 82 alleles. Smaller samples (n= 20, 50 and 75) captured, on average, only 50, 78 and 90% of the alleles present in the study population, respectively. These findings indicate that samples of more than 100 individuals are needed to capture all the known alleles with frequencies >0.005.
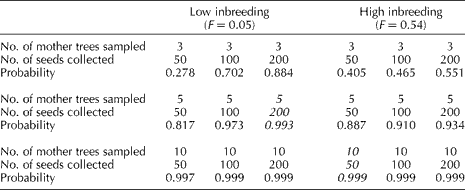
The probabilistic model developed by Yonezawa and Ichihashi (Reference Yonezawa and Ichihashi1989) was used to determine an optimal germplasm sampling strategy for green ash. According to this model, recommendations for seed collection depend on the number of mother trees and the level of inbreeding in a population (Table 3). This study did not recognize significant levels of inbreeding; however, to avoid a potential sampling error, a minor level of inbreeding (F= 0.05) was conservatively added to the estimates. With this level of inbreeding, a collection of 200 seeds from each of five mothers would have the highest likelihood of capturing all alleles (P>99%) present in a theoretical population where all loci have four alleles, with two alleles being present at a high frequency (>0.45) and two at a low frequency (0.005). In addition, Table 3 also includes the possible scenario for high levels of inbreeding (F= 0.54) that may be representative for other species in the Fraxinus genus. In this scenario, the previously mentioned sampling design would only have a 93% probability of capturing all alleles present in a population. Therefore, the collection protocol for a population with high levels of inbreeding should include twice as many mother trees but may include fewer seeds per mother tree (ten mother trees and 50 seeds each) (P>99%) (Table 3).
Germplasm collection recommendations based on the level of inbreeding, the number of mother trees sampled and the number of seeds collected from each mother treea

a Note: Collection scheme established with four alleles, two at high frequencies (0.48 and 0.51) and two at low frequencies (0.005 and 0.005) at each of the five independent loci. Italicized values indicate the recommended number of seeds collected per mother tree with the highest probability of capturing the genetic variability for an individual population depending on the assumption of low or high levels of inbreeding.
Discussion
Since the introduction of the EAB, the future of ash trees in eastern deciduous forests has been compromised. F. pennsylvanica is a common and dominant tree species across the deciduous forests in Ohio. However, the long-term survival of a population is not guaranteed for even common species in a fragmented landscape (Van Rossum et al., Reference Van Rossum, Campos De Sousa and Triest2004). With tens of millions of ash trees being killed already, the ecological as well as the economic impacts are likely to escalate with the continued spread of this exotic beetle. Due to the likelihood and speed with which an ash tree dies after infestation, there is now great concern about the loss of genetic variability (Widrlechner, Reference Widrlechner2010), especially for the potential loss of any locally adaptive genotypes or unique rare alleles.
In contrast to extensive studies on the genetic structure of F. excelsior across Europe (Heuertz et al., Reference Heuertz, Hausman, Tsvetkov, Frascaria-Lacostes and Vekemans2001, Reference Heuertz, Hausman, Hardy, Vendramin, Frascaria-Lacostes and Vekemans2004; Rudinger et al., Reference Rudinger, Dacasa, Glaeser, Hebel and Dounavi2008) and Fraxinus mandshurica across Northeast China (Hu et al., Reference Hu, Uchiyama, Shen, Saito, Tsuda and Ide2008, Reference Hu, Uchiyama and Shen2010), there is limited genetic information on native North American species of Fraxinus with most of the information being based on morphological and ecological attributes between species (Taylor, Reference Taylor1971; Karnosky and Steiner, Reference Karnosky and Steiner1981; Carter, Reference Carter1996; Geyer et al., Reference Geyer, Lynch, Row, Schaeffer and Bagley2005). Our research is one of the first attempts made to study the genetic structure of F. pennsylvanica by examining molecular markers. Knowledge of the genetic structure is important for the development of conservation strategies, as it provides information necessary to capture and maintain genetic diversity with a non-uniform configuration (National Research Council, 1991, 1993).
In general, we determined that there was a high degree of allelic diversity in the green ash populations that we studied, resembling other deciduous temperate tree species when analysed for microsatellite variation (Streiff et al., Reference Streiff, Labbe, Bacilieri, Steinkellner, Glossl and Kremer1998; Degen et al., Reference Degen, Streiff and Ziegenhagen1999; Heuertz et al., Reference Heuertz, Hausman, Tsvetkov, Frascaria-Lacostes and Vekemans2001), though there was a greater observed heterozygosity than expected under the Hardy–Weinberg equilibrium. There were 16 common alleles among the populations (P≥ 0.1); however, each population also had a locally distinctive combination of common alleles. This distinctive combination of alleles contributed to the moderate level of genetic differentiation observed among the populations within a fairly limited geographical area in northwestern Ohio. Moreover, 22% of the alleles were found at a low frequency (P≤ 0.01) and present in only one of the eight populations. Our analysis of the optimal sample size revealed that samples of less than 100 individuals were not likely to capture as many alleles as those included in our original sample. These findings suggest that the maternal genotype of at least 100 seed trees represents a good sample of the variation present in the eight populations from the study area.
In this study, we assumed that pollen and ovule frequencies do not differ; however, studies of the mating structure of trees have shown that ovule frequencies estimated from maternal genotypes may be significantly different from pollen frequencies estimated from the paternal contribution of the seed crop (Rocha and Aguilar, Reference Rocha and Aguilar2001). In general, differences in pollen and ovule frequencies may indicate a limited number of pollen donors that contribute to the seed crop of each tree; thus, seeds need to be collected from a larger number of mother trees. To fully understand and determine the mating structure of green ash and other species of ash, we would need to determine the average number of trees siring the seed crop of each tree, the effective allele frequencies in the pollen and the spatial distribution of pollen dispersal. This information would generate a sampling strategy that defines not only the number of fruiting trees to be sampled from each population but also the number of seeds to be taken from each tree.
This study marks a starting step in developing better sampling procedures to maximize the genetic variation in plants collected for ex situ conservation. The CPC guidelines for the establishment of ex situ collections recommend collecting seeds from 50 individuals from each population and up to 50 populations (Guerrant et al., Reference Guerrant, Fiedler, Havens, Maunder, Guerrant, Havens and Maunder2004). Previous work has suggested greater sample sizes of 50 seeds from 100 individuals (Hawkes, Reference Hawkes1980) or fewer, such as the recommendations made by Brown and Hardner (Reference Brown, Hardner, Young, Boyle and Boshier2000), who indicated that a sample of 15 trees should be enough to capture most of the relevant variation in a population for the survival of the target species. Moreover, Brown and Briggs (Reference Brown, Briggs, Falk and Holsinger1991) concluded that the minimum number of individuals to be sampled from each population is 10. The same authors argued that 50 trees represent an ideal sample when seeds are easy to collect.
Our recommendations for germplasm collection were made based on the number of mother trees rather than on the number of seeds per mother tree. Given the allele frequencies that we found, these results are similar to the original computations carried out by Yonezawa and Ichihashi (Reference Yonezawa and Ichihashi1989) for plant species with low levels of inbreeding. It is important to note that these smaller sample sizes are achieved because F. pennsylvanica is a dioecious, wind-pollinated plant with minimal levels of inbreeding. Therefore, a germplasm collection representing >99% likelihood of capturing all alleles in a population is achieved by collecting a minimum of 200 seeds from at least five individuals from each population. An alternative sampling design was also established for other species of Fraxinus where there may be an increased likelihood of inbreeding due to localized rarity, limited geographical distribution, low-density, highly fragmented populations, or a high proportion of monoecious trees. Consequently, germplasm collections for species of Fraxinus with assumed higher levels of inbreeding (F= 0.54) should double the number of mother trees with fewer seeds being collected per mother tree such that 50 seeds from each of ten mother trees would accurately capture 99% of alleles in the population. It should be noted that increasing the number of mother trees or seeds beyond these recommendations does not provide a significantly greater representation of the genetic variability based on our calculations. However, if one considers the entire range of this species, there are potential scenarios where increasing either the number of mother trees or the number of seeds might be recommended, i.e. when samples are taken from small isolated populations in areas with high levels of fragmentation and high spatial heterogeneity that may lead to ecotypic variation (Brown and Briggs, Reference Brown, Briggs, Falk and Holsinger1991).
The patterns of allele frequency are also being taken into account for the development of collection strategies. Marshall and Brown (Reference Marshall, Brown, Frankel and Hawkes1975) proposed grouping alleles by their frequencies and geographical distributions into four classes: (1) common and widespread, (2) common and local, (3) rare and widespread, and (4) rare and local. They also argued that common and local alleles deserve special attention while designing sampling strategies, as they may represent alleles that could confer specific adaptations to local conditions. We argue that low-frequency alleles (rare and widespread) may also be important when searching for novel genes that might translate into EAB resistance or tolerance. With respect to the EAB, our native ash trees are naive to this pest and, therefore, have had no history to warrant the positive effects of co-evolutionary natural selection processes. To the extent that the presence of the EAB represents a selection pressure not experienced previously, any differential resistance or tolerance attribute that the native ash trees may already possess would never have been selected. If such a tolerance attribute exists, one might expect it to be present at a very low frequency. Moreover, when an area is being sampled, seeds should be collected from at least five trees from each population to effectively sample the genetic diversity. Furthermore, seeds from no less than 100 trees should be collected from an area of approximately 1500 km2 to assure a good representation of the genetic diversity. However, higher ecological heterogeneity across the landscape may require a larger sample size.
Our results also indicate that patterns of genetic diversity among populations cannot be explained solely on the basis of physical distance. While genetic structure has been shown to increase at larger spatial scales for a widespread tropical tree species (Rivera-Ocasio et al., Reference Rivera-Ocasio, Mitchell Aide and Owen McMillan2006), genetic isolation by distance, as proposed by Rousset (Reference Rousset1997), was not supported in this study. Similarly, Hu et al. (Reference Hu, Uchiyama, Shen, Saito, Tsuda and Ide2008) did not find a significant correlation between population differentiation and geographical distance for Manchurian ash (F. mandshurica Rupr.) at population distances ranging from 5 to 1000 km. By contrast, isolation by distance has been reported in two studies of common ash (F. excelsior) for population distances ranging from 0.7 to 400 km and from 5 to 2500 km (Heuertz et al., Reference Heuertz, Hausman, Tsvetkov, Frascaria-Lacostes and Vekemans2001, Reference Heuertz, Hausman, Hardy, Vendramin, Frascaria-Lacostes and Vekemans2004). The present study was conducted on a smaller scale, with paired population distances ranging from 2.4 to 36 km, suggesting that the genetic distance for F. pennsylvanica is not correlated with the geographical distance at this scale. The fact that there was a lack of measurable isolation by distance, but a moderate level of differentiation among the populations (F ST= 0.083), suggests that the genetic structure may be influenced by restricted gene flow due to fragmentation by land-use practices or a relic of glacial history.
The different habitat types found across the study area bear some relationship with the distribution of genetic diversity at the landscape level. Genetic analysis using the program STRUCTURE identified three main clusters or lineages based on the multilocus genotypes of the individuals sampled in each location. Our findings suggest that the likelihood of a population belonging to each cluster appears to be related to the shared physical characteristics of the habitat. For example, trees at Oak Openings and Swan Creek share a high likelihood of belonging to cluster 1. These two locations share the same sandy soil types that are typical of oak savannas. The Oak Openings and Swan Creek populations also form a distinct group that sets them apart from the other populations based on Nei's genetic distance (Fig. 1). On the other hand, cluster 3 includes most of the trees in the Pearson population, which is representative of the Great Black Swamp with poorly drained Latty clay soils (USDA NRCS, 2006). Unique soil types are also found in cluster 2 (Side Cut and Wildwood), where both populations grow in similar loam soils that occasionally flood. The distribution of cluster 3 is associated with the sub-watersheds and riparian corridors formed along the Maumee River, which may reflect greater gene flow connectivity during founder and/or dispersal events.
Low levels of differentiation among populations within riparian habitats have been documented for F. excelsior (Rudinger et al., Reference Rudinger, Dacasa, Glaeser, Hebel and Dounavi2008) as well as for populations of F. mandshurica (Hu et al., Reference Hu, Uchiyama and Shen2010). Similar results were obtained in this study for cluster 1, wherein both primary populations (Oak Openings and Swan Creek) are found along the Swan Creek floodplain. However, the geographical distribution of the different clusters cannot be solely characterized by using geological features. The weak relationship that we observed between the spatial distribution of the geological formations and the distribution of the different clusters may result from high levels of admixture and/or pollen flow among the individual trees found in each location. It should be noted that Lucas County, Ohio, is currently a highly fragmented landscape, due to localized, but expanding, urbanization surrounded by extensive tracts of intensive agriculture.
Clear evidence for phylogeographical structure is not apparent in this study. While our clusters exhibit some trends, these are not universal across all the populations or between each pair of clusters. These results may be attributed to our sampling design, as we did not seek to address phylogeographical relationships explicitly or there may be a compounding influence from habitat fragmentation that has already altered pre-settlement, but post-glacial landscape attributes. The lack of a clear genetic structural relationship among populations may make future conservation efforts of Fraxinus species more challenging. Germplasm collection efforts are obviously needed, even urgent, but efficient protocols for the effective capture of the genetic diversity of Fraxinus populations are lacking to date. To this end, herein, we propose a sampling scheme based on a test of eight F. pennsylvanica populations that ensures capturing all the common and widespread and common and local alleles and a large portion of the rare and widespread and rare and local alleles.
Supplementary material
To view supplementary material for this article, please visit http://dx.doi.org/10.1017/S1479262114000033
Acknowledgements
The authors thank Tim Gallaher, Tim Schetter, Marty Overholt, Bob Jacksy and the rest of the Toledo Area Metropark staff and volunteers for their support and assistance in the field. They also thank Mark Widrlechner, Jeff Carstens and Terry Robison for their advice, comments and/or criticisms on a previous version of this manuscript. This project was financially supported with funding from Art and Margaret Herrick Research Grants of the Department of Biological Sciences at Kent State University (KSU), Ohio Biological Survey, Metropark District of the Toledo Area, and the KSU Graduate Student Senate.