1. INTRODUCTION
This work was part of an international joint industry research project for the study of hydrodynamic, control and operational aspects related to Ship-to-Ship (STS) operations. The research project was established in 2007 by the Norwegian Marine Technology Research Institute (MARINTEK) in co-operation with the Department of Marine Technology, Norwegian University of Science and Technology (NTNU) and international partners.
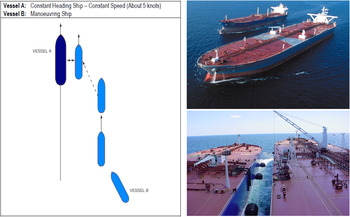
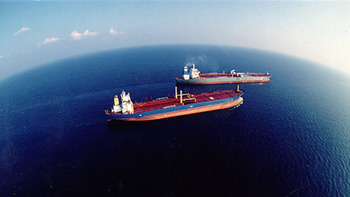
A Ship-to-Ship (STS) lightering operation typically involves two tankers manoeuvring in close proximity, at speeds in the range of 4–6 knots, in order to position alongside and commence cargo transfer. The operation often takes place out on the open sea, while the two ships are underway and sailing, as can be seen in Figure 1. One ship maintains speed and course, while the other ship slowly manoeuvres alongside. In an STS lightering operation the approach phase is critical in order to avoid steel-to-steel contact.
The principles of a standard approach manoeuvre in STS lightering operations (left) (OCIMF and ICS, 2005). Images of the landing phase (Courtesy of SPT Ltd).

In the guidance found in The Oil Companies International Marine Forum (OCIMF) “Ship to Ship Transfer Guide” (OCIMF and ICS, 2005), one ship is required to maintain speed and course, and this ship is referred to as the Constant Heading Ship, or Ship to be Lightered (STBL). The Manoeuvring Ship, or Service Ship (SS), will approach until it is on a parallel course, one cable (200 yards) off the beam of the STBL and adjust to equal velocity, as can be seen in Figure 1 (OCIMF and ICS, 2005). In the final approach phase the SS slowly manoeuvres in towards the STBL with a small deviation of 3–5° in relation to the STBL's course, so that it lands simultaneously on all fenders with minimum force, as seen in Figure 1.
The motivation for performing these operations is a lack of deep water ports. These types of marine operations are expected to increase significantly in frequency, and expand into new geographical areas in the coming years. An example is the development of Northwest Russian onshore and offshore oil and gas fields, which will increase the need for STS transfer from a fleet of smaller ice-strengthened vessels to standard deep draft vessels in ice-free areas. This will require reverse lightering operations performed close to the coastline, which is vulnerable to any discharge into the environment (Pedersen et al., Reference Pedersen, Shimizu and Berg2008).
In an STS lightering operation, the masters are, as always, in charge of their respective ships. However, it is an industry standard to have a mooring master on board the manoeuvring ship, acting as pilot and advising the captain and his crew on how to navigate and manoeuvre. This experienced and trained officer is normally also authorised to terminate the operation if safety is at risk.
Limited knowledge about the hydrodynamic interaction forces and lack of equipment available to determine with sufficient accuracy the relative motion between the vessels, e.g. speeds, distances, Rate-Of-Turn (ROT), are issues that affect safety in the final approach phase of these operations. The officer in charge of a lightering operation, the mooring master, is heavily reliant on his external visual capacity when the two ships are closing in. Any misjudgement in control commands, rudder or engine during the final stage could cause the relative transverse speed to exceed a safety value which could result in steel-to-steel contact.
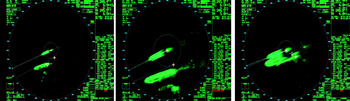
A user survey, contextual observations and interviews have been conducted at the Ship Modelling & Simulation Centre (SMSC) in Trondheim, Norway, during lightering courses among European and US mooring masters. This confirms that the support from standard navigation systems onboard the vessels are limited (Husjord and Pedersen, Reference Husjord and Pedersen2009). Radar is mainly used for navigation in the initial approach phase, when the ships are some distance from one another. One user, with 39 years’ experience on tankers and four years as mooring master, says: “Radar is extremely important, I use it for parallel indexing during the approach and for monitoring local traffic which could affect the STS operation.” In the final part of the approach, which is critical in order to avoid steel-to-steel contact, the radar's physical limitations become apparent as seen in Figure 2, resulting in the mooring master receiving incorrect measurements of distances and angles and having to rely only on visual observations in order to navigate.
Radar images from the final phase (Pedersen et al., Reference Pedersen, Husjord, Yoo and Shimizu2010).

In cases where STS lightering is carried out in lightering zones exposed to heavy swell, the relative differences of the motion in roll direction is a parameter the mooring master needs to take into consideration to avoid steel-to-steel contact, especially of the vessels' superstructure. Controlling the relative approach angle of 3–5°, is normally done by observing the course of the SS and it is taken for granted that the STBL remains steady on its given course, which cannot be guaranteed. Thus, in some situations, such as in heavy swells, an assistant mooring master is required to be shipped on board the STBL to monitor course and speed and communicate with the SS (Husjord and Pedersen, Reference Husjord and Pedersen2009). After mooring, the cargo transfer can commence, either while still under way or after one of the vessels has dropped anchor.
2. THEORETICAL FRAMEWORKS
For a decision maker on a ship's bridge, perception and cognition are vital, and strongly connected to the situation awareness, as can be seen in Figure 1 in Endsley (Reference Endsley1995), and elaborated in Endsley and Garland (Reference Endsley and Garland2000). Human perception is a collective process for the reception and management of information (Greitzer and Podmore, Reference Greitzer and Podmore2008), and as a task, the process is complex and involves:
-
• Understanding and applying meaningful concepts.
-
• Relating visual input to memorised pictures from previous experience.
-
• Assessing motion relative to mental, dynamic models.
-
• Allocating priorities to the different alternatives.
Cognition is about mental actions and processes of acquiring knowledge and understanding through thoughts, experience, and senses (Røed, Reference Røed2007). A mooring master in a lightering operation is part of a cognitive system, together with the crew on both vessels. Lintern (Reference Lintern2005) explains that the cognitive work expands the view of what is cognitive, beyond the individual mind, to encompass coordination between people and their use of resources and materials. This view is also in accordance with the theory of distributed cognition enunciated by Hutchins (Reference Hutchins1995).
2.1. Situation Awareness (SA) and Decision-Making
SA describes the processes of attention, perception and decision-making, which together form the navigator's mental model of the current situation (Endsley, Reference Endsley1995; Tenney et al., Reference Tenney, Adams, Pew, Huggins and Rogers1992). SA is formally defined as “the perception of elements in the environment within a volume of time and space, the comprehension of their meaning, and the projection of their status in the near future” (Endsley, Reference Endsley1988. P.97). “This includes an operator's perception of critical factors in the environment (Level 1 SA), an understanding of the meaning of those factors in light of the operator goals (Level 2 SA), and at the highest level, an understanding of what will happen to these factors projected into the near future (Level 3 SA)” (Endsley and Kiris, Reference Endsley and Kiris1995; Endsley, Reference Endsley, Parasuraman and Mouloua1996). SA has a critical effect on decision-making in dynamic systems (Endsley, Reference Endsley1993). Operators who lose SA may be slower to detect problems and require extra time to re-orient themselves to relevant system parameters (Endsley and Kiris, Reference Endsley and Kiris1995. P.382), and a lack of SA may be directly responsible for much of the out-of-the-loop performance. So if the automated systems affect the navigator's SA, especially in the critical higher SA (Level 3 SA), this becomes a part of the out-of-the-loop performance problem (Endsley and Kiris, Reference Endsley and Kiris1995).
Decision-making in navigation can be regarded as an outcome of cognitive processes, leading to the selection of a course of action among several alternatives (Eisenfuhr et al., Reference Eisenfuhr, Weber and Langer2011). The output may be an action or an opinion on available choices. From a cognitive perspective, the decision-making process in navigation must be regarded as a continuous process integral to, and interacting with, the environment. It might also be regarded as a problem-solving activity which is terminated when a satisfactory solution is found. Therefore, the decision-making process may be seen as an embodied reasoning system (Lakoff and Johnson, Reference Lakoff and Johnson1999; Klein et al., Reference Klein, Orasanu, Calderwood and Zsambok.1994), with the human eye as the most important instrument, measuring height, width and depth.
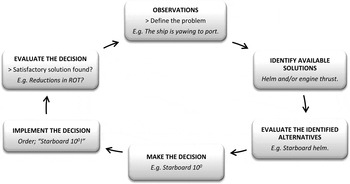
The naturalistic decision-making in navigation, as can be seen in Figure 3, is primarily a descriptive approach that seeks to explain human decision-making in terms of expert performance and the process is recognition-primed (Klein, Reference Klein, Zsambok and Klein1997; Reference Klein and Hancock1999).
Steps in the natural intuitive decision-making process in navigation.

For the mooring master, the practical experience accumulated over several years of conducting lightering operations is partly conscious and partly not. This was observed in interviews: It is much easier for them to describe what they do, than describe what they are thinking when they are doing it. Regarding the reasoning prior to their choice of rudder and engine orders, they could in some cases describe the parameters that they observed and how the correlation values of these parameters influenced the decision they made. In other cases, the decision-making process was explained as: “From experience I just know what the right choices are.” Decision-makers’ experience and knowledge are subconsciously primed, a process that takes place without any conscious optimisation of the solution. The original tacit knowledge held by individuals is unique to them. It is a product of their total experience and not a direct source of generalisable knowledge (Rust, Reference Rust2004; Moggridge, Reference Moggridge2007).
2.2. Interaction Design (IxD)
IxD can be seen as a tool to identify what the user wants (Moggridge, Reference Moggridge2007). It includes human-oriented design activities such as understanding users’ needs, motivations and contexts. What clearly marks IxD as a design field is that it imagines things as they might be, rather than focusing on how things are. “Interaction design is concerned most significantly with satisfying the needs and desires of the people who will interact with a product or service” (Cooper et al., Reference Cooper, Reimann and Cronin2007, P. xxviii). From the perspective of IxD, navigation is an activity that involves interaction between human beings and technological artefacts. The bridge of a modern ship is equipped with several different types of navigational instruments. These provide large amounts of various information to the navigator on watch.
If we compare navigation today with classic navigation, (before approximately 1960), there has been tremendous development in the nautical profession. The huge increase in technological aids for navigation has changed nautical performance. The volume of information available on the bridge, along with an increasing amount of automated systems and processes, has made the navigator more perceptive of the computer-based instrumentation around him, and less dependent and aware of visual observations. The available information presented on the bridge today is often post processed, weighted and filtered (Forssell, Reference Forssell1991; Farrell, Reference Farrell2007) and the navigator is not always fully included in these processes. Different providers of navigational instruments also make use of different methods to collect and calculate the data. Accordingly, this can create uncertainty and reduce the reliability with regard to the information presented to the officer of the watch and result in the out-of-the-loop performance problem (Endsley and Kiris, Reference Endsley and Kiris1995; Parasuraman, Reference Parasuraman2000). Various navigational systems, with different user interfaces, make it hard for the navigator, as a decision-maker, to have control and insight into the physical limitations and the mode of operation. “It's a sad truth that the digital technology industry doesn't have a good understanding of what it takes to make users happy. In fact, most technology products get built without much understanding of the users” (Cooper et al., Reference Cooper, Reimann and Cronin2007, P.8). To have complete control, the navigator needs to be a part of the voyage, integrated in time and space, able to calculate, predict or imagine what can be expected ‘around the next turn’, and what challenges may be faced.
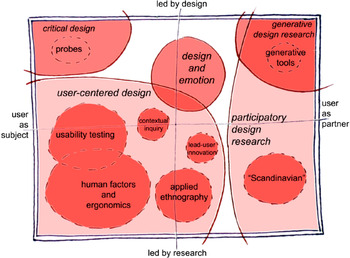
The span of approaches to IxD is mapped by Sanders and Stappers (Reference Sanders and Stappers2008) in Figure 4. A large portion of IxD has a research perspective, viewing the “user as subject” for design (Sharp et al., Reference Sharp, Rogers and Preece2007). However, this study also takes the “user as partner” perspective during the early exploratory phase (Husjord et al., Reference Husjord, Pedersen and Øritsland2011), by inviting mooring masters to participate in the creation of designs and make suggestions regarding information to be displayed.
Mapping the span of approaches to IxD (Sanders and Stappers, Reference Sanders and Stappers2008).

The term usability, in the lower left quadrant of Figure 4, is important in IxD. One of its main references is ISO 9241-11 which defines usability as: “The extent to which a product can be used by specified users to achieve specified goals with effectiveness, efficiency and satisfaction in a specified context of use” (ISO/IEC 9241-11, 1998). So, we have to understand discipline, technical requirements and constraints. We then use this knowledge to create products whose form, content and behaviour is useful, usable and desirable, as well as economically viable and technically feasible (Cooper et al., Reference Cooper, Reimann and Cronin2007, P.4).
2.3. Graphical User Interface (GUI) and Information Visualisation
Well-designed presentations of important information consist of complex ideas communicated with clarity, precision and efficiency, and give the viewer the greatest number of ideas in the shortest time with the least ink in the smallest space (Tufte, Reference Tufte1983. P.51). Simplification of the graphical presentation is important. “Among the most powerful devices for reducing noise and enriching the content of displays is the technique of layering and separation, visually stratifying various aspects of the data” (Tufte, Reference Tufte1990. P.53).
In graphical presentations in navigation, the response time of the perception of the GUI is important, i.e. if the navigator does not see the graphical changes early enough, his decision-making can be interrupted (Miller, Reference Miller1968). If the response time is up to 0·1 seconds, users perceive the system's response instantaneously. With a response time up to one second, users feel that the system is responsive, and while they are more likely to notice a delay, the response time is still small enough for their thought processes to stay uninterrupted (Miller, Reference Miller1968; Cooper et al., Reference Cooper, Reimann and Cronin2007). “Spatial dimension to the design of graphic will have the effect that the information is moving over space as well as over time” (Tufte, Reference Tufte1983. P.40).
It was a conscious choice to interact with the end-users in the design, within a working environment in a ship-handling simulator. The mooring masters gave feedback and comments particularly on the GUI. When users have been involved in the design of a product, they know from an early stage what to expect from a product and they feel that their ideas and suggestions have been taken into account during the process.
3. DECISION-MAKING IN STS LIGHTERING
The decision-making process, as can be seen in Figure 6, is influenced by the mooring master's experience. Experience and SA may be imagined as filters influencing what kind of information to select. The information is processed unconsciously and is selected and shaped by experience and SA. The output is the selected information needed to solve the actual task (Paris et al., Reference Paris, Salas and Cannon-Bowers2000).
3.1. Comparisons
An important part of the decision-making process is to compare the perceived situation with the images from similar memorised experience and recollect the control measures that were used then. Consider an approach phase where the SS yaws to starboard, away from the STBL and the angle between the vessels is widening. Imagine now that the mooring master gives the helm order: “Port 10”. When does the unwanted relative starboard movement stop? This stopping-point is important, as it indicates how much rudder force, over a period of time, is needed to stop the vessel's motion. Observations of the yaw movement or changes in the ROT will determine how long the existing order can stand before it has to be changed, e.g. by reducing the rudder to midships. If the vessel's yaw movement is not stopped “in time”, the force must be increased by a larger rudder order to port, or a kick ahead using the engine. However, an experienced mooring master knows that excessive rudder force may lead to an uncontrollable situation if the ship's ROT stops too quickly and builds up too rapidly in the opposite direction.
In the landing phase, the mooring master must simultaneously observe two sight lines from his post at the port bridge wing, one to the SS's bow or to the port anchor bed, and the other to the STBL's hull or bow post. Visually focusing and making dynamical comparisons based on two different spots simultaneously is difficult to accomplish (Husjord et al., Reference Husjord, Pedersen and Øritsland2011). The human eye has limited depth perception (Klein, Reference Klein2008), which makes it hard for the mooring master to observe the angle between the two ships and verify relative yaw. Depth perception is mainly based on comparisons and experience, or experienced mental models (Sand et al., Reference Sand, Sjaastad, Haug and Bjålie2006). So an experienced and well-trained mooring master relies on previous experience of similar situations to make a decision in the present.
3.2. Spatial Awareness
Spatial awareness is used to describe how things or persons are relating to space and time. “Spatial contextual awareness consociates contextual information such as an individual's location, activity, and proximity to objects” (Chen and Kotz, Reference Chen and Kotz2000). When a spatial entity changes over time, the history and potential futures of the object become more important. In the landing phase, as seen in Figure 5, the mooring master has to imagine “before his inner eye” where the two ships will be in the future (Hutchins, Reference Hutchins1995). Gathering the necessary information in the present, and calling on previous experience, will give the mooring master an “a priori” solution for where both vessels will be, i.e. a high level (Level 3) of SA (Endsley and Kiris, Reference Endsley and Kiris1995). This is especially necessary in the final approach where the two ships are so close that they are both subject to asymmetrical hydrodynamic forces.
Spatial experience enables the mooring master to “see the vessels’ movements before his inner eye”. (Courtesy of SPT Ltd).

3.3. Modelling the Decision-making Cycle
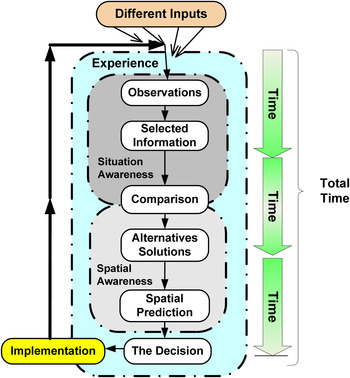
A mooring master's cognitive work consists of experiencing, understanding, planning, observing, comparing, finding alternative solutions, predicting and making decisions, while he is fully integrated with perceiving and acting (Husjord and Pedersen, Reference Husjord and Pedersen2009). A model of the mooring master's decision-making cycle is illustrated in Figure 6. This model is inspired by Endsley's model of situation awareness in dynamic decision-making (Endsley, Reference Endsley1995. P. 35). Shaped like a flow diagram the process moves in steps from the top where several input sources are available. The mooring master chooses what to observe and selects the information needed. This information is then compared with similar previously experienced situations to discover similarities and differences. The results from this comparison are potential alternative solutions, which through the mooring master's spatial understanding and predictive ability then gives us the final decision.
A model of the decision-making cycle in STS lightering with experience, situational and spatial awareness as the underlying layers.

The time-factor, shown to the right in Figure 6, is an important dimension which applies throughout the process from start to decision. Time is needed to observe, select, compare, decide and implement. It can be seen as several parallel circular processes acting on different elements and also moving beyond or outside the decision-making process itself. In the last part of the process the decision is more directly connected to the time factor and the mooring master's ability to predict the relative position as a function of time through spatial awareness and spatial prediction. Lack of control of the time dimension was described in the interviews as a cause that could give the navigator a “bad gut feeling” and this may reduce performance, due to stress, for instance. To be in control, the mooring master needs to be a step ahead of the tasks expected of him and be capable of carrying out several decision-making processes simultaneously.
3.4. Challenges and Weaknesses in the Decision-Making Process in an STS operation
In an STS operation there are several limitations, which make challenges to the mooring master's decision-making. These challenging tasks are connected to the limitations in the vessels manoeuvring ability, the unstable hull making it hard to steer, the large inertia of the vessels, limitation in the rudder acceleration and a propulsion system with a fixed propeller. In addition the mooring master has to take into account the external forces from wind, waves, current and the hydrodynamic interaction force. Therefore, manoeuvring alongside and mooring in the open sea is a task that demands a high level of situational awareness (Level 3 - see Section 2.1) of problem-solving ability. Activities at a high level have serious consequences if an error occurs, and the process can be especially prone if a new element shows up and the task becomes non-routine (Rasmussen, Reference Rasmussen and Green1982). New elements may be changes in the external forces, giving rise to a need for improvisation. The human being as a decision-maker, influenced by a number of different factors such as stress, fatigue, noise etc., suffers from variations in performance which may at any time be at the lower end of the performance scale. Low performance is often called “human error”, but some cognitive systems engineers state that this must be seen as a natural variation in human performance (Hollnagel, Reference Hollnagel1998). Motivation, attitude, knowledge, experience and frequent training are fundamental to achieving a robust decision-making process and maintaining a high level of performance.
3.5. Potential Improvements in the Decision-Making Process
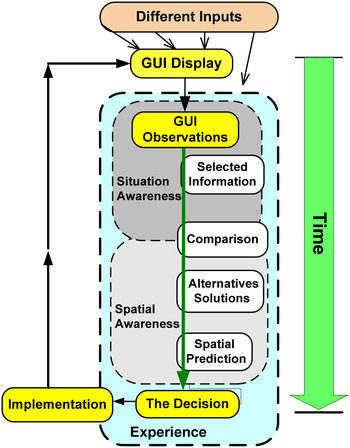
Information, presented to the mooring master, about the vessels' motions, their relative position and the external forces, will make the reception and management of information easier. The mooring master can understand the vessels’ behaviour and their movements projected into the near future (Level 3 - see Section 2.1). An IxD of the GUI, developed in cooperation with mooring masters (users) and with focus on SA, has potential to give this information and improve the performance (Endsley et al., Reference Endsley, Bolté and Jones2003). “By creating designs that enhance the pilot's awareness of what is happening in a given situation, decision-making and performance can improve dramatically” (Wise et al., Reference Wise, Hopkin and Garland2009. P.12–17). Input from the GUI display can pass more easily through the steps in the decision-making process and does not need to be selected or filtered, as illustrated in Figure 7. The commands from the mooring masters could potentially be given earlier and with lower degrees of uncertainty. An error in the DSS, e.g. in the hose connection point, may be visually observed and thus adjusted by the mooring master.
Improvement of SA in the decision-making cycle.

4. DEVELOPMENT OF A GUI FOR STS OPERATIONS
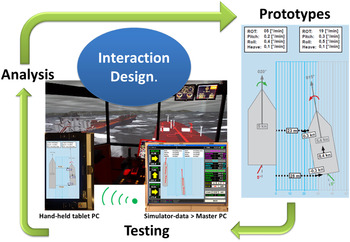
In accordance with IxD principles, the mooring masters have, during four iterations, contributed to the design of a DSS prototype for STS operations. After each iteration cycle the results have been analysed and the design of the GUI has been improved, as can be seen in Figure 8.
The iterative IxD-cycle used in the development of the GUI.

4.1. The First Iteration
A questionnaire on lightering operations, containing 19 questions, was used as a guide during the semi-structured interviews in the first iteration in spring 2009. Four mooring masters, who performed lightering operations off the US west coast, particularly outside California, participated. One had 15 years’ experience as a mooring master and had worked with lightering operations since 1982. The other three subjects were more inexperienced as mooring masters, but with long experience as deck officers and sea pilots. In addition, two of the teaching staff at the Ship Modelling & Simulation Centre (SMSC) with lightering experience, were included in the interviews.
The questionnaire was also completed by the training manager of a shipping company that carries out regular lightering operations off the coast of Houston, Texas. All of the users agreed with the steps in the natural intuitive decision-making process in lightering as shown in Figure 3. After an explanation of the contents of the figure, they also agreed upon the model of the decision-making cycle in STS lightering as seen in Figure 6, which includes the presence of spatial awareness. Sketches the users themselves made showed vessels in a “bird's eye view” perspective and presented so that the motion was clearly shown. To the question “In what way would you like the relative, spatial, information to be presented”, the oldest and most experienced mooring master wrote: “In bird's eye view on a monitor for me to look at, without input of something else.”
Three paper prototypes were presented in the interviews, in ‘far field,’ ‘intermediate’ and ‘near field’ mode (Husjord and Pedersen, Reference Husjord and Pedersen2009). Operating with multiple modes was not considered a problem by the younger users. However, subsequent discussions revealed that when a mooring master had to switch from one mode to another, the information could be misunderstood or interpreted incorrectly. It was suggested therefore to create one graphical presentation that could be used both when the vessels were far apart and when they came closer. The size of the vessels on the GUI, in relation to the distance between them, does not have to be accurate, so long as the relative distances and the angles are correct, for example indicated with numerical values. If the size of the vessels were programmed in advance of the operation it would give a more accurate presentation, the users said.
Norman (Reference Norman1988) has four basic proposals for how a design should be:
-
1) Make it easy to determine what actions are possible at any time
-
2) Make things visible, including the conceptual model of the system, the alternative actions and the results of actions
-
3) Make it easy to evaluate the current state of the system
-
4) Follow natural mappings between intentions and required actions, between actions and the resulting effect, between the information that is visible and the interpretation of the system state (Norman, Reference Norman1988, P.188).
So, the natural mapping must be maintained as far as possible, without introducing too many differences into the presentation. A new DSS must provide information to the decision-maker so that the reasoning process remains the same throughout the entire operation. It is mentally difficult for a navigator to switch between different media and parameters during an operation (Hutchins, Reference Hutchins1995).
All users agreed that the key parameter was the relative approach speed, but that additional information could include distances and the critical angle between the two vessels. As there are heavy swell conditions in the waters off California, the users proposed that the vessels’ rolling movements should be presented by curved arrows or numbers. In the final decisive phase, the mooring master is usually on the bridge wing. A static device inside the bridge would be inaccessible, while a hand-held device capable of communicating the necessary information would be within the mooring master's reach at all times. This was stated by users in both the questionnaires and the interviews.
4.2. The second Iteration
The second user test was conducted in autumn 2009 with a group of three mooring masters. They had 15 to 20 years’ experience as sea pilots off the coast of Northern Ireland, Wales and in the English Channel. After a specialisation, they practiced now as mooring masters in all European waters, including Malta and Europort, which has the highest number of lightering operations in Europe.
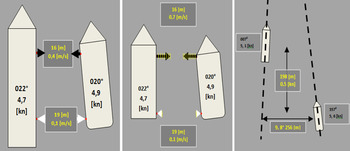
Based on the analysis of the information requested in the first iteration, new paper prototypes were made, as seen in Figure 9. The focus was to give accurate information about the relative motion and distance between the ships, seen in “bird's eye view”. In order to obtain more information from the mooring masters and further develop the GUI prototype, three different mock-ups of various sizes were made, which the paper prototypes were glued upon. The mock-ups were handed out during mooring masters’ lightering course at SMSC (Husjord et al., Reference Husjord, Pedersen and Øritsland2011). The course consisted of theory classes and simulation exercises, with briefings and debriefs before and after the exercises. The author participated in the discussion of the topics raised in two theory classes and at the briefings. In three exercises, each lasting 90 minutes, contextual observations were made of procedures and the users’ behaviour, communication and distribution of work. In addition, questions were asked regarding the way the tasks were solved, as well as the priority and the sequence in which the tasks were performed. In addition, semi-structured interviews were carried out, both individually and with the group as a whole, in two 45-minute sessions.
Paper prototypes of the second iteration.

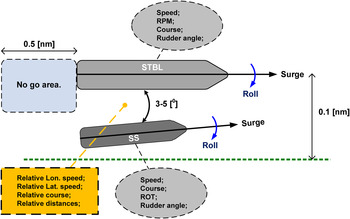
The discussions focused on how an ideal GUI might appear. Graphical sketches were drawn on paper or on the blackboard, like the one that can be seen in Figure 10. They all agreed on the key parameters to be the relative approach speed, distances and the angle between the two vessels, but additional real-time information from both ships might be course, speed, ROT and rudder angle. It was discussed how much information the GUI should contain. All users envisioned graphically dynamic presentations where the relative motion could be observed visually, in addition to numerical values that showed the movements more precisely.
A sketch used for discussions with the mooring masters.

The users described how they evaluated the received observations and how they made a decision based on this evaluation. Local considerations such as traffic, applicable regulations and the vessels’ sizes had a considerable impact on how the vessels should be manoeuvred and how the operation should be performed. Thus, the SS, or “daughter” as they prefer to call it in Europe, may approach the STBL, or “mother”, using different approach angles. During the interviews, “mock ups” proved far more useful than paper prototypes. By holding the “mock-ups” and pointing at a particular part of the GUI, the mooring masters could easily share their opinions and discuss these with the author and the others in the group. The GUI in the middle of Figure 9 got particular attention from the users.
All three users answered positive to the question of whether a DSS was needed in STS lightering, especially for inexperienced mooring masters or an experienced mooring master experiencing a new situation. The users preferred a hand-held DSS, but to the question of whether the same information should be presented inside the bridge, this user group's response was rather surprising: “If the same information is made available to the captain on board, it could result in conflicts and uncertainties”, e.g. the captain could get the impression from the DSS that his vessel was coming in too hard during the landing phase. In this context, it should be pointed out that many oil tankers perform lightering operations only occasionally, which means that some captains have little experience with such operations.
4.3. Third Iteration
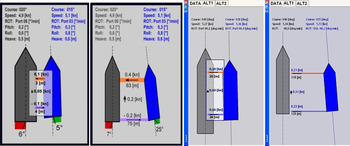
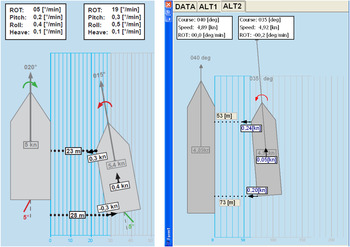
As a result of the second iteration, two different GUI alternatives were proposed, as can be seen in Figure 11 and Figure 12, to be further integrated and tested. A small hand-held tablet PC was found to be a suitable platform for programming the GUIs and for communicating with the simulator system (Husjord et al., Reference Husjord, Pedersen and Øritsland2011). The tests in the third iteration, using questionnaires, interviews and contextual observations, were performed at SMSC during a lightering course for mooring masters in March 2011.
GUI alternative 1. Paper prototypes (left) and a screen shot of the tablet PC (right).

GUI alternative 2. Paper prototypes (left) and a screen shot of the tablet PC (right).

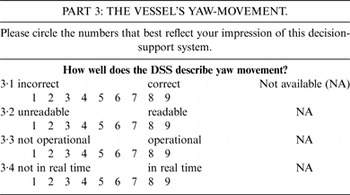
The tests were an interactive process, focusing on the context of using the DSS during the operational setting. The users did not use any electronic instruments other than the DSS during these prototype tests. The questionnaires used Likert scales, which are psychometric scales commonly used to identify user experience (Converse and Presser, Reference Converse and Presser1986). This method allows for neutral answers, but can only be defined with reference to a particular context (Sharp et al., Reference Sharp, Rogers and Preece2007). After each session, the mooring masters’ opinions were documented on multi-item scaled questionnaires. Each questionnaire testing one parameter consisted of a single question or scenario with three or four descriptive responses. Each response was rated by the mooring masters on a scale from 1 to 9 (1 being the lowest score and 9 the highest). Each question was carefully linked to the test subject's observations of the DSS prototype, while performing a STS lightering operation. The multi-item scaled questionnaire of one parameter, Part 3; the vessel's yaw-movement, can be seen in Table 1.
Example of questionnaire for one parameter.

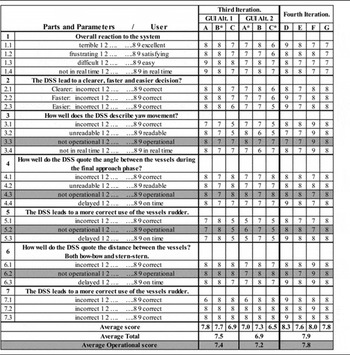
There were three people taking part in this test, one with over 20 years’ experience as a mooring master, labelled A in Table 2. One less experienced mooring master, labelled B, and an experienced captain with previous experience of lightering operations, labelled C in Table 2. All three users were tested while using both GUI alternatives. The test scenario was a normal lightering approach, where the SS started about 3–4 cables astern of the STBL's starboard side and the duration of the scenario was about one and a half hours. Contextual observations from the bridge were carried out, including how the GUI was used in the decision-making process. The users pointed out what parameters they perceived from the GUI and how this information was used to correct the ship's course and speed.
The seven parameters with sub questions are scaled from 1 to 9 by the users A, B and C, in the third iteration, and by the users D, E, F and G in the fourth iteration.

Table 2 shows the different scores, scaled from 1 to 9, provided by the test subjects to the seven different questions and sub questions, for each of the two GUI alternatives. The index (*) marks the users’ second test-run. The operational scores, marked grey, may indicate the usability in real life lightering operations. All participants felt the graphics and the data presented on the GUIs were easy to understand.
Semi-structured interviews were performed following the Likert tests. This gave additional feedback of the operational level along with a deeper understanding of the mooring masters’ thoughts and ideas regarding the system, and how the GUI could be improved. From the results in Table 2, GUI Alternative 1, as seen in Figure 11, was given a higher average score from all three users and also a slightly better operational score. In the interviews, the test subjects found Alternative 1 to have the best presentation, as this was more intuitive to both read and perceive than the more directly integrated information connected to the shape of the SS in Alterative 2, Figure 12. The amount of information connected to the graphics of the SS made this information harder to perceive because it changed when the vessel moved.
Suggestions for improvement from the users included implementation of Speed Over Ground (SOG) and Course Over Ground (COG) and inclusion of the SS's heading on the GUI. In the approach phase, the advance distance between the stern and the bow was preferred. Information about the hose connection-point, the manifold, could also be included in the graphics. This connection-point is the longitudinal reference point on the STBL and the SS has to be in line with this position before the moorings can be made fast. In terms of further development, the test subjects thought that Alternative 1 combined with the underlying grid-division and the ROT arrows from Alternative 2 would offer the best presentation of the DSS.
4.4. Fourth Iteration
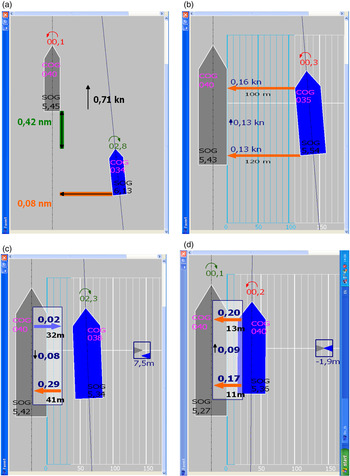
The fourth and final iteration of the GUI is seen as screen shots from the hand-held tablet PC in Figure 13. No information is shown on top of the screen, but instead, is integrated in the shape of the vessels. SOG and COG are included and when the vessels are very close, as can be seen in Figure 13c and Figure 13d, the longitudinal distance between the hose connection-points is visualised using a box containing one grey and one blue triangle. When the two triangles are level, the ships are in the correct longitudinal position. The number under the box indicates the distance forward to the connection-point. If this number moves in front of the box, the vessel has to move astern to come into position. The ships’ manifolds do not have to be exactly in position before hose connection, so the graphic will still show them level even though the longitudinal position may be two metres off, as Figure 13d shows.
Screen shots of the fourth and final iteration. (a) The vessels in the approach phase. (b) Closer to the landing. (c) In the landing phase the longitudinal distance to the hose connection-point can be seen in the indicator to the right. The SS has to move 7·5 (m) ahead to come into position to moor. (d) The SS has landed in position, just 1·9 (m) in front of the STBL's hose connection-point.

The final GUI test was performed in August 2011 at SMSC. The test group consisted of four inexperienced mooring masters from the United Kingdom (UK). Although they had less experience in lightering operations, they had many years of experience as UK sea-pilots. The same seven parameters, as can be seen in Table 2, were used in the questionnaires as in the third iteration GUI test. Two of the mooring masters performed an STS lightering operation in the simulator, alternating between being the officer in charge using the DSS, and as helmsman. The questionnaires, as can be seen in Table 2, and interviews were performed immediately after the simulator exercises.
As can be seen from the psychometric scaling in Table 2, all four users gave a very positive response, with ratings averaging around score 8. One suggestion for improvement was that the manifold connection point could be presented earlier. The following statements were made by this test group:
-
- “I liked the DSS. It is a useful instrument and it reduces the need for verbal communication between the members on the bridge, bridge and deck and also between the two ships. The handheld device is able to present the operation in a very good way.”
-
- “The GUI with graphics, colours and font-size is easy to understand. No unnecessary information is presented, and this is good.”
-
- “The decision support system could be further developed so it can be used in docking operations and in relative positioning operations, relative to a fixed point or to limit values. Fender pressure can be included in the GUI.”
5. THE INITIAL PERFORMANCE TEST
The next step was to perform an initial performance test, to find improvement indicators in the performance. This last test was performed in the simulator centre at UiT The Arctic University of Norway in May 2013.
5.1. System Structure of the DSS
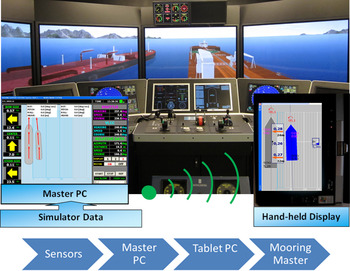
The master Personal Computer (PC) collects positions (Global Positioning System - GPS) and Headings (HDT) from the ship-handling simulator and calculates positions and movements. The hand-held tablet receives the pre-computed data by wireless link from the master PC and presents the result as GUIs, as seen in Figure 14. The vessels sizes, Length Over All (LOA) and beam, as well as the positions of their GPS antenna, must be entered into the master PC before start up. The COG, in Figure 13, was changed to HDT before the initial performance test.
System structure. (Courtesy of UiT The Arctic University of Norway).

5.2. Vessel Specifications
The test subjects were briefed on the vessels’ specifications. The SS was a 123,600 (dwt) shuttle tanker in ballast with an LOA of 264·7 (m) and a beam of 42·5 (m). The vessel had good manoeuvrability, with two propellers and two highly effective Becker rudders. The STBL was a 395,900 (dwt) very large crude carrier (VLCC) with an LOA of 352·8 (m) and a beam of 52·9 (m). The STBL was equipped with Yokohama fenders. The STBL's throttle was set to 14%, corresponding to 4·92 knots, and its autopilot was pre-set to a high gain, to resist the hydrodynamic interaction forces in the landing phase.
The STS interaction forces implemented in the Kongsberg Maritime simulator are modelled using an empirical approach. Forces on the hulls of the two ships are computed based on the hulls’ dimensions, relative orientation and speed through the water. The coefficients defining the magnitude of the interaction force are mainly functions of lateral and longitudinal separations between the two hulls. Coefficients are individual for each ship model and based on research by Dand (Reference Dand1977; Reference Dand1987). It may be noted that as a part of the international joint industry research project for studies of hydrodynamic, control and operational aspects related to STS operations, the hydrodynamic interaction effects are determined based on the towing tank model test programme implemented by Flanders Hydraulics Research and Ghent University, Belgium (Lataire et al., Reference Lataire, Vantorre and Delefortrie2009; Reference Lataire, Vantorre, Vandenbroucke, Eloot and Pettersen2011). The results from these tests will be implemented in ship-handling simulators at a later stage.
5.3. Participants
The test group consisted of twelve test subjects. Half of the test subjects used standard decision-making tools, such as radar, gyro and Doppler log. This group is referred to as the Standard (STD) test group. The other half of the test subjects, the DSS test group, used solely the Decision-Support System (DSS), and observed the GUI on the tablet to make their decisions. All test subjects had access to visual observations. Both groups consisted of one captain with some STS experience, two deck officers and three nautical higher grade students. In two of the test runs, using students as test subjects, the logged data was corrupt, so the total number of subjects tested, analysed and presented is ten. Although it would have been preferable to use participants with more STS experience, the use of inexperienced STS operators in this test allowed for better identification of improved performance. It could be argued that using more experienced mooring masters might automate the STS operations in a way that would affect the test, due to tacit knowledge etc. (Rust, Reference Rust2004; Moggridge, Reference Moggridge2007). For the education and simulator training of mooring masters, the use of inexperienced officers in the test is appropriate.
5.4. Test Setup
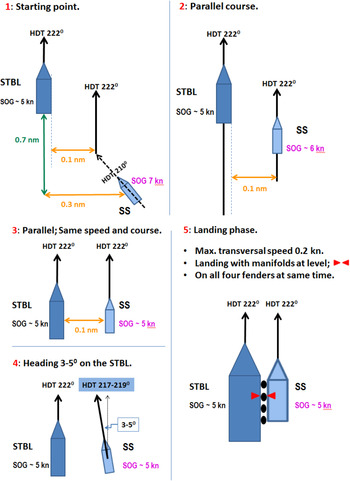
The test began with an introduction to the lightering operation, including a short film, showing the performance of the operation. The Oil Companies International Marine Forum (OCIMF) operational guidelines for lightering operations (OCIMF & ICS, 2005) were presented. The routes to be followed were reviewed in detail on separate sketches which were presented to the test subjects, as seen in Figure 15.
The criteria and optimum track to follow in the test scenario, presented in sketches from Position 1 to Position 5.

The SS started 7 cables astern of the STBL on her starboard side, three cables off. The initial phase, from the starting point until the STBL was almost overtaken, lasted for about 40 minutes and was not part of the test. The test subject used this time to become familiar with the simulator and the radar or the DSS. Information regarding interaction effect, in particular the transverse force on the SS's bow, was provided. In the scenario there was no current, wind or waves to affect the vessels. All test subjects operated with manual steering control, controlling the rudder and the engine themselves. The STD group inserted the parallel index into the radar and used this along with the Variable Range Marker (VRM) to control the manoeuvre.
The participants in the STD group used radar in the approach and visual observations in the landing phase. Like the human eye, a ship-handling simulator has limitations in visual depth perception (Pfautz, Reference Pfautz2002). The error in depth perception depends on where the participants are located in relation to the simulators’ viewpoint and the graphical visual content displayed (Pfautz, Reference Pfautz2002). In this test setup, the participants stood at the viewpoint by the manoeuvre console. The depth perception in this position, with the graphical visual content onsite, was 85–90% according to the provider Kongsberg Maritime and this is also in accordance with Pfautz (Reference Pfautz2002). The bearing error at the viewpoint was negligible. So, the participants were minimally affected by the visual limitations in this test setup and this was emphasised before the test started.
6. RESULTS OF THE INITIAL PERFORMANCE TEST
The results of the test have to be seen in light of the low number of participants, i.e. the statistical limitations, and the limitations in the test setup. This test just provides performance improvement indicators. To further validate the improvements of the DSS, a higher number of test subjects, and different test setups, are needed.
The parameters of the vessels’ positions, true and relative motion and distances from the SS's bow and stern to the STBL were all calculated and logged in the DSS. Rudder and engine commands were logged in the Kongsberg Maritime simulator. Based on this data, the different tests were analysed and graphically presented.
6.1. Parallel Course, one Cable off the STBL
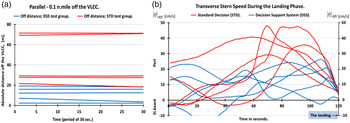
One of the criteria in the test was to achieve a parallel course and to adjust to equal velocity, one cable off the starboard beam of the STBL - position 3 in Figure 15. Deviations observed in course and velocity were minimal, but as Figure 16 shows, in the STD test group all had a larger absolute deviation in keeping the SS 0·1 nautical miles off the STBL, in steel-to-steel distance.
(a) Deviations from one cable off. (b) Transverse stern speed,
 $\; {\left\vert {\dot \eta} \right\vert_{Aft}}$
, in the landing.

6.2. Stern Transverse Velocities in the Landing
The interaction effect can produce a yawing moment which results in the stern moving rapidly towards the STBL. This can cause the stern fender to blow, resulting in unwanted steel-to-steel contact between the vessels. Figure 16 (b) shows transverse stern speeds,
 $\; {\left\vert {\dot \eta} \right\vert_{Aft}}$
, during the last 120 seconds of the landing. In the landing a maximum transverse stern speed was set to,
 $\; \; {\left\vert {\dot \eta} \right\vert_{Aft}}\, \le 0\!\cdot\! 2\,{\rm kn}{\rm } \approx {\rm } 10\!\cdot\! 3\,{\rm cm/s}$
. The difficulty of observing and controlling this movement is evident in the significantly higher stern transverse velocity in the STD group, shown in red in Figure 16 (b). All users in the STD group had
 $\; {\left\vert {\dot \eta} \right\vert_{Aft}}\, \gt 29\,{\rm cm/s}$
, compared to the DSS group where all had
 ${\left\vert {\dot \eta} \right\vert_{Aft}}\, \gt 26\,{\rm cm/s}$
. On average, the STD users had 22·7 cm/s higher stern transverse velocities than the DSS users in the landing.
6.3. Rudder Commands and Transverse Stern Speed during the Landing Phase
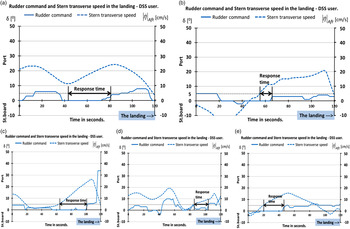
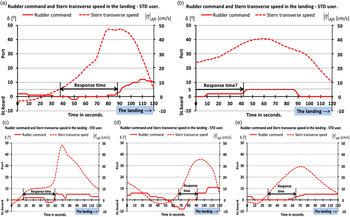
Figure 17 and Figure 18 show individual figures of rudder commands, δ, and transverse stern speed,
 $\; {\left\vert {\dot \eta} \right\vert_{Aft}}$
, during the last 120 seconds of the landing phase. Figure 17 presents the test subjects’ data for the DSS group and Figure 18 presents the data for the STD group. The left axis shows rudder command, δ, to port (positive) and to starboard (negative) in degrees. On the right axis is the transverse stern speed,
 $\; {\left\vert {\dot \eta} \right\vert_{Aft}}$
in (cm/s). The response time, from port transverse stern movement exceeds 5 cm/s until a correct rudder command to port exceeds 3°, is highlighted for each of the test subjects.
Rudder commands, δ, and transverse stern speed,
 $\; {\left\vert {\dot \eta} \right\vert_{Aft}}$
, during the landing, DSS test group.

Rudder commands, δ, and transverse stern speed,
 $\; {\left\vert {\dot \eta} \right\vert_{Aft}}$
, during the landing. STD test group.

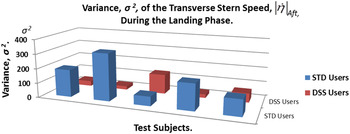
The DSS group, Figure 17, shows use of rudder more synchronised with the transverse stern speed movement. On the other hand, the STD group in Figure 18 shows examples of inadequate use of rudder, e.g. rudder commands the wrong way and more delay in making corrective rudder commands. An incorrect rudder command to starboard will increase the transverse stern movement. For the STD user in Figure 18 (d) the transverse stern speed started to build up after about 60 seconds, but an incorrect rudder command to starboard was kept for another 20 seconds, with an angle up to 8°. This caused a rapid increase in the acceleration of the transverse port stern speed. A correct rudder command to port was given after around 90 seconds. The STD users had an overall larger variance, σ2, in the transverse stern speed,
 $\; {\left\vert {\dot \eta} \right\vert_{Aft}}$
, during the landing phase, Figure 19.
Variance, σ2, of the transverse stern speed,
 $\; {\left\vert {\dot \eta} \right\vert_{Aft}}$
, during the landing phase.

6.4. Feedback from the users
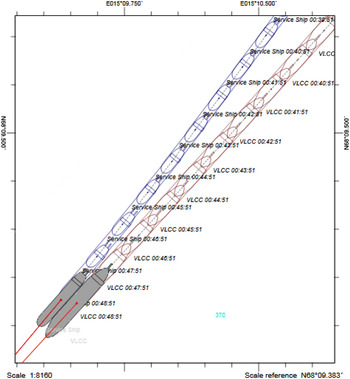
The DSS users observed the GUI on the DSS intensely, by holding it in their hands or placing it on the console beside the engine and steering control. The users displayed positive reactions to the GUIs and easily perceived the information presented. They found the hand-held device easy to use and were able to adjust the light and contrasts on the GUI comfortably. One of the users, a chief officer, suggested that the DSS could also be used in docking operations. Figure 20, shows a recorded plot of the last nine minutes of a DSS users’ landing.
A recorded plot from the nine last minutes of a DSS users’ landing.

7. CONCLUSION
A model of the mooring master's decision-making cycle in Ship-To-Ship (STS) lightering has been proposed using contextual observations and interviews. A prototype of a handheld Decision-Support System (DSS) has been developed and tested.
Focusing on Interaction Design (IxD) principles using a process of four iterative cycles, and including different analysis techniques, a Graphical User Interface (GUI) tailor-made for STS operations and a prototype of a handheld DSS were developed. With the focus on usability, the mooring masters actively and systematically participated in the development of the DSS. They gave their feedback during different tests, while also participating in STS lightering courses in a ship-handling simulated environment.
The final prototype, a wireless hand-held DSS with a tailor-made GUI, received positive feedback from the users and some even suggested other areas of application for the DSS, beyond STS operations.
An initial performance test was conducted, with officers who had less experience in STS operations, to identify improvement indicators in the performance. The test subjects’ performance during approach and landing was evaluated, and analysis of the time-series plots showed the quality of each STS approach manoeuvre. The improvement indicators identified using the DSS were, improved vessel control during the approach phase, including better rudder commands with a shorter response time. The critical transverse stern speeds during the landing phase were, on average, over 22 cm/s higher for the group that used standard navigation equipment (the STD group), than the DSS group. Maximum transverse stern speed in the landing for a vessel of this size is about 10 cm/s. Furthermore, the analysis identified indicators which showed that the DSS group gave better rudder commands, with a shorter response time, than the STD group. Correct and fast response time is particularly critical in the landing phase due to hydrodynamic interaction and the large moment of inertia of the vessel. As the setup in the test had limitations, along with the fact that the number of participants was low, this test was not a complete performance-test but rather an initial test, to identify improvement indicators in the performance.
The tailor-made GUI for STS operations, based on IxD principles, has a potential to enhance awareness and lead to an improvement of less experienced mooring masters' decision-making processes. This work is considered to contribute to the enhancement in the simulator training for inexperienced mooring masters, and thus enhance the efficiency and safety in STS operations.
The next step will be to implement the results of this work in full-scale STS operations.