


Non-technical Summary
As species evolve across different habitats, they will sometimes become adapted to local conditions. This can be documented with some ease in a modern species with a wide range. However, in the fossil record, low sampling rates can hide variation within a species. To understand how phenotypic variation within a species may have played a different role in past environments, we documented shape variation in fossils of American mink (Neogale vison) mandibles across four sites. We compared these shapes with the mandibular shapes found across the native range of modern N. vison. For two fossil sites, we had multiple samples: Conard Fissure, Arkansas, and Cumberland Bone Cave, Maryland. N. vison was chosen as the focal species because previous research has documented phenotypic variation among subspecies, especially in the teeth, skull, and jaws. In our analyses, fossil mandibles from Conard Fissure had distinctly shaped chewing muscle attachments compared with modern mandibles and fossil mandibles from Cumberland Bone Cave. These changes may have increased achievable bite forces for these individuals, which suggests N. vison at Conard Fissure may have had a different diet from modern N. vison. N. vison are generalist carnivores and eat a wide variety of foods, often in proportion to their availability. N. vison at Conard Fissure may have been able to consume larger or different prey by achieving higher bite forces with their distinct jaw morphology. These results are an example of how detailed analysis of fossils can reveal subtle variation and change over time as part of broader discussions about patterns and causes of stasis and change over time.
Introduction
Phenotypic and genotypic variations within a species permit evolutionary change and the formation of new species. The persistence of multiple phenotypes in a species, and changes in these phenotypes over time, may indicate evolutionary trends or constraints (Futuyma, Reference Futuyma1987; Kurtén, Reference Kurtén1988; Renaud et al., Reference Renaud, Auffray and Michaux2006; Hansen and Houle, Reference Hansen and Houle2008; Polly, Reference Polly2008). Thus, genetic or developmental constraints may prevent the appearance of new phenotypes, and new phenotypes that do appear may be lost due to random processes. Constraints can also bias evolutionary change in the direction of greatest genetic variation (Schluter, Reference Schluter1996; Hansen and Houle, Reference Hansen and Houle2008; McGlothlin et al., Reference McGlothlin, Kobiela, Wright, Mahler, Kolbe, Losos and Brodie2018). In cases where constraints are limiting evolution, lineages may appear to have little to no phenotypic change, and display a pattern of stasis, even in the face of changing environments.
On shorter time scales, the amount of genetic variation within a species is positively correlated to the species’ rate of evolution (Harmon et al., Reference Harmon, Pennell, Henao-Diaz, Rolland, Sipley and Uyeda2021; Rolland et al., Reference Rolland, Henao-Diaz, Doebeli, Germain and Harmon2023; Tsuboi et al., Reference Tsuboi, Sztepanacz, De Lisle, Voje and Grabowski2024). The ephemeral divergence hypothesis reconciles standing genetic variation with apparent phenotypic stasis by suggesting that local adaptations are frequently lost to gene flow and are only rarely registered in the fossil record (Futuyma, Reference Futuyma1987, Reference Futuyma2010). These ephemeral phenotypes may be important to the natural history of a species and indicate adaptive potential or different roles in past environments. However, ephemeral phenotypes are difficult to detect in sparse fossil records and may make a lineage’s phenotype appear static through time (Lieberman and Dudgeon, Reference Lieberman and Dudgeon1996; Hunt, Reference Hunt2007; Futuyma, Reference Futuyma2010). More recent fossil records, particularly starting in the Pleistocene, present a density that may capture environmental and climatic changes and provide test cases for ephemeral phenotypes (Barnosky, Reference Barnosky and Genoways1987; Bell et al., Reference Bell, Lundelius, Barnosky, Graham, Lindsay, Ruez, Semken, Webb, Zakrzewski and Woodburne2004).
Our objective here is to examine patterns and potential causes of intraspecific phenotypic change, or lack of change, among populations of the American mink, Neogale vison (Schreber, Reference Schreber1777), through time by quantifying and comparing mean mandibular shapes. N. vison was selected as the focal species because it has a wide range of phenotypes and occupied habitats. A high degree of phenotypic variation within the species has been previously reported and described in detail, including in an extinct sister species (Bangs, Reference Bangs1896; Hollister, Reference Hollister1913; Burns, Reference Burns1964; Humphrey and Setzer, Reference Humphrey and Setzer1989; Larivière, Reference Larivière1999; Mead et al., Reference Mead, Spiess and Sobolik2000; Sealfon, Reference Sealfon2007; Gálvez-López and Cox, Reference Gálvez-López and Cox2022). As generalists, modern N. vison inhabit a wide variety of habitats across North America, although they are expected to preferentially inhabit wetlands and riparian regions across biomes (Soper, Reference Soper1942; Larivière, Reference Larivière1999; Reid et al., Reference Reid, Schiaffini and Schipper2016; Holland et al., Reference Holland, Schauber, Nielsen and Hellgren2019; Hapeman et al., Reference Hapeman, Smith, Kosciolek, Winchester and Gore2021). Previous work suggested the diets of N. vison may vary regionally or seasonally with prey availability (Dunstone and Birks, Reference Dunstone and Birks1987; Ben-David et al., Reference Ben-David, Hanley, Klein and Schell1997; Hapeman et al., Reference Hapeman, Smith, Kosciolek, Winchester and Gore2021). Because of this, we expect to see functional variation in mandibular shape among populations of the species as measured with three-dimensional (3D) geometric morphometrics. Because the current geographic range of N. vison does not encompass all conditions experienced by the lineage over its evolutionary history, fossils of N. vison may display divergent phenotypes.
Previous descriptive work has reported subspecific phenotypic differentiation across the geographic distribution of N. vison, especially in craniodental elements (Bangs, Reference Bangs1896; Hollister, Reference Hollister1913; Burns, Reference Burns1964; Humphrey and Setzer, Reference Humphrey and Setzer1989; Larivière, Reference Larivière1999). Additional variation in craniodental morphology is present in invasive populations on other continents (Wiig, Reference Wiig1985; Kruska and Sidorovich, Reference Kruska and Sidorovich2003; Melero et al., Reference Melero, Palazón and Gosàlbez2008; Korablev et al., Reference Korablev, Korablev and Korablev2013; Gálvez-López and Cox, Reference Gálvez-López and Cox2022). The extinct sea mink, Neogale macrodon (Prentiss, Reference Prentiss1903), is the sister species to N. vison and is known for its larger body size and distinct tooth morphology (Mead et al., Reference Mead, Spiess and Sobolik2000; Sealfon, Reference Sealfon2007; Work et al., Reference Work, Lewis, Johnson and Bourque2025). This evidence of abundant phenotypic variation suggests that N. vison is an ideal system for studying emerging phenotypic differentiation. However, despite evidence of spatial divergence, descriptions of the oldest fossils attributed to N. vison are described as falling within the size and shape range of modern specimens, suggesting stability through time (Gidley and Gazin, Reference Gidley and Gazin1938; Anderson, Reference Anderson1977).
The fossil record of N. vison is made up primarily of craniodental elements found in Pleistocene limestone trap caves (Brown, Reference Brown1908; Gidley and Gazin, Reference Gidley and Gazin1938; Anderson, Reference Anderson1977, Reference Anderson1984, Reference Anderson, Seal, Thorne, Bogan and Anderson1989). Estimates for the age of the Neogale clade range from the Pliocene to the late Miocene: molecular divergence dates range from 3.3–3.2 Ma (Koepfli et al., Reference Koepfli, Deere, Slater, Begg, Begg, Grassman, Lucherini, Veron and Wayne2008) to 7.4–6.5 Ma (Hassanin et al., Reference Hassanin, Veron, Ropiquet, van Vuuren, Lécu, Goodman, Haider and Nguyen2021), with intermediate estimates published as well (Sato et al., Reference Sato, Wolsan, Prevosti, D’Elía, Begg, Begg, Hosoda, Campbell and Suzuki2012; Law et al., Reference Law, Slater and Mehta2018; Patterson et al., Reference Patterson, Ramírez-Chaves, Vilela, Soares and Grewe2021). The oldest fossils attributed to N. vison are from the Middle Pleistocene and were found at Cumberland Bone Cave, Maryland, and include several partial crania and mandibles (Gidley and Gazin, Reference Gidley and Gazin1938). N. vison is known from younger sites as well, including several mandibles from Conard Fissure, Arkansas (Brown, Reference Brown1908; Anderson, Reference Anderson1977, Reference Anderson, Seal, Thorne, Bogan and Anderson1989). These sites often contain fossils from multiple individuals, allowing us to test for the degree of variation present in past populations.
Materials and methods
Sample
For this study, American mink (Neogale vison) mandibles (n = 290) were sampled from museum collections across the United States. N. vison were sampled to maximize the breadth of geographic representation within the species’ native range. Known juveniles and individuals from fur farms or zoos were excluded as domestic N. vison are known to display distinct morphologies (Lynch and Hayden, Reference Lynch and Hayden1995; Tamlin et al., Reference Tamlin, Bowman and Hackett2009). To be included in the sample, specimens were required to possess a complete set of premolars and molars on at least one side of the dentary. When possible, samples collected within the past 50 years, with intact crania, and with coordinate data were preferentially selected. In cases where GPS coordinates were not available, these were estimated to the nearest 0.1 decimal degrees (approximately 11.1 km) from location descriptions.
In addition, 13 mandibles from fossil localities were included in the dataset. These fossils and localities were initially selected from database searches and information from the literature suggesting the presence of multiple partial or complete mandibular fossils (Brown, Reference Brown1908; Gidley and Gazin, Reference Gidley and Gazin1938; Anderson, Reference Anderson1977; Humphrey and Setzer, Reference Humphrey and Setzer1989).
Fossils came from four localities spread across North America (Fig. 1). Three mandibles were from Cumberland Bone Cave, Maryland, a late Irvingtonian (Middle Pleistocene) site and the oldest site included in this study. According to U-series Electron Spin Resonance, Cumberland Bone Cave is dated between 830 and 660 ka with a most likely age of 756 +87/–98 ka (Withnell et al., Reference Withnell, Joannes-Boyau and Bell2020). The greatest number of fossils (n = 8) were found at Conard Fissure, Arkansas. This site’s age has been regarded to be about 610 ka (Lundelius et al., Reference Lundelius, Downs, Lindsay, Everett, Semken, Zakrzewski, Churcher, Harington, Webb and Woodburne1987; Eshelman et al., Reference Eshelman, Bell, Graham, Semken and Withnell2025). Conard Fissure is also late Irvingtonian (Middle Pleistocene) in age but has been inferred to be younger than Cumberland Bone Cave because of the absence of some large mammalian taxa known from the Pleistocene and earlier as well as turnover in prairie vole species and a greater diversity of small mammals (Brown, Reference Brown1908; Gidley and Gazin, Reference Gidley and Gazin1938; Lundelius et al., Reference Lundelius, Downs, Lindsay, Everett, Semken, Zakrzewski, Churcher, Harington, Webb and Woodburne1987; Eshelman et al., Reference Eshelman, Bell, Graham, Semken and Withnell2025). Two much younger mandibles were also included in the dataset. One is from a Rancholabrean (Late Pleistocene) site near Fairbanks, Alaska, on the north side of the Tanana River Valley. Its age, according to carbon-14 dating of nearby bison, ox, and mammoth material, is estimated to be 12.46–40 ka or older (Anderson, Reference Anderson1977). The final mandible is from Aucilla River, Florida; it is early Holocene (Santarosean) in age, specifically 8–14.5 ka (Halligan, Reference Halligan2021).
Sampling locations for N. vison included in this study. The gray region represents the native range of N. vison as reported by the International Union for Conservation of Nature. Dark gray diamonds represent N. vison sampled from modern mammalogy collections; large colored circles represent fossil sites.

Figure 1. Long description
A map of North America with a coordinate grid ranging from 20 degrees North to 60 degrees North and 80 degrees West to 130 degrees West.Legend in the top-right corner titled Site:* Modern (n = 290) represented by small grey diamonds.* Conard Fissure (n = 8) represented by a light blue circle.* Cumberland Bone Cave (n = 3) represented by a dark blue circle.* Tanana River Valley (n = 1) represented by a dark green circle.* Aucilla River (n = 1) represented by a light green circle.Geographical Distribution:* Northwest: A dark green circle marks the Tanana River Valley in Alaska. Two black rectangular boxes outline dense clusters of modern sites along the Alaskan and Canadian coasts. These areas are magnified in two inset panels on the left side of the map.* Central and East: Grey diamonds representing modern sites are scattered across the continent, with higher concentrations along the West Coast, the Great Lakes region, and the Northeast coast.* Southeast: Three specific fossil sites are labeled with colored circles. Cumberland Bone Cave (dark blue) is located in the Northeast U.S. region. Conard Fissure (light blue) is located in the central U.S. Aucilla River (light green) is located in the Florida panhandle.
Imaging
Mandibles from modern collections were laser light scanned using an Artec Space Spider (3D point accuracy: 0.05 mm; 3D resolution of models: 0.1 mm). They were imaged in three profiles on a turntable, and these three partial scans were merged and converted into a surface in Artec Studio 17 or Artec Studio 18 (Artec 3D, Senningerberg, Luxembourg) following a standard protocol based on the procedure distributed by Artec 3D. First, each partial scan was globally aligned separately from the others (features: geometry and texture; registration mode: collective; key frame ratio: 0.3; search features within 5 mm; smart subsampling on). The bases of the scans were removed using the Base Selection tool or, if this failed, using the Lasso Select tool. Outlier removal (3D-noise level: 1; 3D resolution: 0.1 mm) was then run individually on each partial scan. The partial scans were then aligned automatically, when possible, or by manually placed homologous points if auto-alignment failed. The aligned scans were then globally registered collectively (settings as above). To generate a surface, we used Sharp Fusion (3D resolution: 0.1 mm; fill holes with radius smaller than 20 mm; exclude erroneous frames: off). If this produced extraneous polygons, the small-object filter was used to remove all objects except the largest one. The texture was re-applied, and this and the surface were exported in PNG and PLY formats, respectively.
Fossils were imaged using micro-computed tomography (micro-CT). Specimens housed at the Florida Museum of Natural History were imaged at the museum’s Digital Imaging Division on a Phoenix V|Tome|X M dual-tube nano-CT system (115 kV, 215 μA, 0.5 mm copper filter, 360° of rotation). The voxel size for these scans was 22.08 μm. All other specimens were imaged on a Bruker SkyScan 1173 at the Visualization Center at the Old Westbury Campus of the New York Institute of Technology (75 or 130 kV, 106 or 61 μA, 1.0 mm aluminum or 0.25 mm brass filter, 0.4° rotation step, 360° of rotation, six-frame averaging). The voxel size for these scans ranged from 35.79 to 38.65 μm.
Scan segmentation and surface generation were performed in Slicer3D 5.6.2 (Fedorov et al., Reference Fedorov, Beichel, Kalpathy-Cramer, Finet and Fillion-Robin2012; Rolfe et al., Reference Rolfe, Pieper, Porto, Diamond, Winchester, Shan, Kirveslahti, Boyer, Summers and Maga2021). SlicerMorph’s ImageStacks utility was used to import the micro-CT data in TIF stack format (Rolfe et al., Reference Rolfe, Pieper, Porto, Diamond, Winchester, Shan, Kirveslahti, Boyer, Summers and Maga2021). Thresholding was performed using the Threshold tool under the Segment Editor module. In cases where multiple elements or specimens were present in one scan, the Scissors tool was used to remove non-focal elements.
Additional cleaning steps were taken on modern specimens in Geomagic Wrap 2021 (Hexagon AB, Stockholm, Sweden) to facilitate the automated placement of pseudolandmarks for a separate project. Each mandible surface was bisected using the Trim with Plane tool at the mandibular symphysis. The side with a complete set of cheek teeth or, if all teeth were present and whole, with better image quality was kept. If both sides were acceptable, the left half was kept. Then the canine and front portion of the mandible were removed with a slice perpendicular to the tooth-mandibular junction between the canine and most anterior premolar using the Trim with Plane tool. This section of the mandible was removed due to a high rate of missing and broken canines. Large scan errors, such as large spikes and bubbles in concave areas, were manually removed using a combination of the Lasso and Defeature tools. For smaller files (fewer than 200,000 polygons), the surface was then further cleaned and smoothed using the Relax tool (smoothness set to 4, strength and curvature priority at the minimum setting, fix boundary on), the Mesh Doctor tool (all analyses checked, except in cases where leaving spikes checked changed occlusal morphology), the Remesh tool (target edge length set to default, use existing boundaries only on, no fixed vertices, keep boundaries checked), and the Decimate tool (reduction mode set to triangle count, target triangle count 25,000, fix boundaries unchecked). For large files (more than 200,000 polygons), an extra decimation was performed (reduction mode set to triangle count, target triangle count 50,000, fix boundaries unchecked) between running the Mesh Doctor and Remesh tools to avoid an uneven size distribution of polygons.
Landmarking
A landmarking scheme (Fig. 2) was designed from previous works that focused on the functional morphology of carnivoran jaws (Hartstone-Rose et al., Reference Hartstone-Rose, Hertzig and Dickinson2019; Grossnickle, Reference Grossnickle2020; Gálvez-López and Cox, Reference Gálvez-López and Cox2022) or distinguishing among mustelid lineages via jaw morphology (Wiig, Reference Wiig1985; Tamlin et al., Reference Tamlin, Bowman and Hackett2009; Gálvez-López and Cox, Reference Gálvez-López and Cox2022). Preliminary analyses also showed high variation in the shape of the posterior of the dentary. Landmarks and semilandmarks were placed using the Markups module in Slicer3D (Fedorov et al., Reference Fedorov, Beichel, Kalpathy-Cramer, Finet and Fillion-Robin2012; Rolfe et al., Reference Rolfe, Pieper, Porto, Diamond, Winchester, Shan, Kirveslahti, Boyer, Summers and Maga2021). Ten landmarks and 16 semilandmarks split between two curves were placed at locations listed in Table 1. The effects of specimen size, position, and rotation were removed using Procrustes superimposition via the gpagen function in the Geomorph package (Adams et al., Reference Adams, Collyer, Kaliontzopoulou and Baken2023). In this step, semilandmarks were slid to minimize bending energy (Gunz and Mitteroecker, Reference Gunz and Mitteroecker2013).
The landmarking scheme used for geometric morphometric analysis in this study, placed on UAM-52241 as an example. Shown in (1) lateral, (2) dorsal, (3) medial, and (4) posterior views. Large black points represent fixed landmarks, and small gray points represent curve semilandmarks. Point definitions are provided in Table 1.

Landmark and semilandmark definitions

Table 1. Long description
The ten landmark descriptions include: (1) the most anterolateral point of the p2 alveolus, (2) the p4–m1 lateral contact point, (3) the most anterolateral point of the m1 alveolus, (4) the most concave point between m2 and coronoid process, (5) the most dorsal point of coronoid process, (6) the most concave point between coronoid and condylar processes, (7) the lateral tip of condylar process, (8) the medial tip of condylar process, (9) the most posterior point of angular process, (10) the most ventral point on the body of the mandible that, when a line is drawn through LM 10 and LM 3, the line is perpendicular to the line through LM 2 and LM 3. The semilandmark curves, each made up of eight points, are placed on the anterior and posterior edges of the ramus, between LM4-LM5 and LM5-LM6, respectively.
Due to the incomplete nature of some fossils, only eight dentaries could be landmarked in full. To include additional specimens, including those from the sites in Fairbanks, Alaska, and Aucilla River, Florida, a second dataset was constructed excluding landmarks 5 and 7 and both semilandmark curves. Procrustes superimposition was applied to this dataset as described in the preceding.
Statistical analyses
To assess differences among N. vison from modern collections and fossil sites, Procrustes ANOVA was applied to the output of each Procrustes superimposition using the procD.lm function from the Geomorph package (Adams et al., Reference Adams, Collyer, Kaliontzopoulou and Baken2023). The standardized coordinates were input as the response of the model, and the specimen source (modern or the specific fossil site) was input as the factor. Post hoc testing was carried out to determine which comparisons were significant using the pairwise function in the RRPP package (Collyer and Adams, Reference Collyer and Adams2018). The standardized distance between group means was used as the test statistic, and the confidence level was set to 0.95. To visualize these data, a principal component analysis (PCA) was applied to each Procrustes superimposition. An additional Procrustes ANOVA was applied to the superimposed data from the modern N. vison and those from Cumberland Bone Cave and Conard Fissure to test for any differences in centroid size among these groups. To test for potential sexual size and shape dimorphism, a Procrustes ANOVA was used to examine the effects of sex, centroid size, and their interaction on shape. A Procrustes ANOVA and post hoc testing were also applied as above to the dataset that includes partial fossils, totaling four sites, and excluding several landmarks and all semilandmarks.
Landmark placement is a known source of error in geometric morphometric studies, especially those of 3D data (Fruciano, Reference Fruciano2016). To minimize this source of error, all landmarks were placed by one individual (A.M.P.). To measure the role of landmark placement error in the analysis, 20 individuals were selected and landmarked in triplicate. After Procrustes superimposition of these 60 sets of landmarks, custom code was used to calculate the average repeatability and percentage measurement error (Yezerinac et al., Reference Yezerinac, Lougheed and Handford1992). In addition, to determine whether any points were introducing error, the analysis of percentage measurement error was re-run with each point sequentially removed (Fruciano, Reference Fruciano2016).
To assess potential biasing effects of dense semilandmark placement (Cardini, Reference Cardini2019, Reference Cardini2020; Goswami et al., Reference Goswami, Watanabe, Felice, Bardua, Fabre and Polly2019), the generalized Procrustes superimposition, Procrustes ANOVA, and post hoc tests were repeated on sparser curves. Each semilandmark curve was resampled from eight to four points using the function digit.curves in the R package Geomorph (Adams et al., Reference Adams, Collyer, Kaliontzopoulou and Baken2023). This analysis was repeated only on the first dataset as both semilandmark curves were removed from the reduced landmarking scheme to include more broken fossils. Results were qualitatively the same as when all semilandmarks were included and are reported in Supplementary Information (SI) Tables 2 and 3.
Repositories and institutional abbreviations
Specimens included in this study were obtained through loans courtesy of the American Museum of Natural History (AMNH; New York, New York, USA), the Carnegie Museum (CM; Pittsburgh, Pennsylvania, USA), the Florida Museum of Natural History (FLMNH; Gainesville, Florida, USA), the Louisiana State University Museum of Natural Science (LSUMZ; Baton Rouge, Louisiana, USA), the Museum of Southwestern Biology (MSB; Albuquerque, New Mexico, USA), the New York State Museum (NYSM; Albany, New York, USA), and the Museum of the North (UAM; Fairbanks, Alaska, USA). Catalog numbers for all specimens are included in SI Table 1.
Results
The first PCA, run on the full dataset, resulted in 74 principal components describing variation among 298 mandibles. A broken stick analysis showed that the first eight principal components explain significantly more variation than expected, but only the first two account for more than 10% of the total variation. The first 18 principal components are required to explain 90% of the variance. A table of eigenvalues and percentage variance explained is provided in SI Table 4. The first two principal components explain 37.1% of the total shape variation (Fig. 3). The second PCA, performed on the reduced set of landmarks, included 303 mandibles. To include fossils with damage to their coronoid and condylar processes, two landmarks and both semilandmark curves were excluded from this dataset (Fig. 2). This analysis makes additional comparisons with the fossils from Fairbanks, Alaska, and Aucilla River, Florida. The results did not qualitatively differ from the first PCA and are included in the supplementary material. The first two principal components of this dataset explain 39.4% of the total shape variation (SI Fig. 1). Full results for the associated ANOVA and post hoc testing are presented in SI Tables 5, 6.
PCA plot of principal components 1 and 2 for the analysis of all landmarks and semilandmarks. In the plot, gray points represent N. vison sampled from modern mammalogy collections, whereas colored points represent fossil N. vison and are labeled with specimen numbers. Wire-frame diagrams show the difference in shape from the mean: the light gray points and shape are the mean shape, whereas the dark lines and red points represent the minimum or maximum score along the axis.

Figure 3. Long description
The central scatter plot uses P C 1 on the x-axis, accounting for 25.3 percent of variance, and P C 2 on the y-axis, accounting for 11.8 percent of variance. The data points are categorized by Site in a legend at the top-right. Modern samples are represented by grey dots forming a dense cluster centered near the origin. Conard Fissure samples are light blue dots labeled F M dash 1 1 7 7 7 G, B, A, E, C, and F, which are generally positioned in the upper-left quadrant. Cumberland Bone Cave samples are dark blue dots labeled 3 0 2 0 7 and 4 1 3 5 9, located near the center-left.Surrounding the plot are five wireframe diagrams of jaw morphology. Each diagram shows a black outline representing a specific shape variation overlaid on a light grey reference outline.- Top-left and top-right diagrams show variations in the height and curvature of the coronoid process.- Two diagrams on the far left show variations in the length of the horizontal ramus and the angle of the angular process.- The wireframes illustrate how moving along the P C axes corresponds to physical changes in jaw structure, such as the steepness of the anterior edge of the coronoid process and the depth of the mandibular notch.
The first principal component axis (PC1) explains 25.3% of the variation in the dataset (Fig. 3). Low values of PC1 represent a coronoid process with a more posteriorly directed apex, a more anteriorly positioned angular process, and a more anterodorsal condylar process relative to the mean shape. The anterior portion of the mandibular body is more ventral relative to the mean shape. Overall, the angle between the coronoid process and mandibular body is greater for low values of PC1 than the mean. A high value of PC1 represents the reverse: a more anterior apex of the coronoid process, a more posterior angular process, and a more posteroventral condylar process. For high values of PC1, the anterior portion of the mandibular body is more dorsally positioned, resulting in a lower angle between the coronoid process and the mandibular body.
The second principal component (PC2) explains 11.8% of the shape variation in the dataset, which is less than the null expectation. Even so, it reflects some aspects of shape variation not shown on PC1 (Fig. 3). Low values of PC2 represent mandibles with shorter and narrower coronoid processes, slightly more dorsal angular and condylar processes, and slightly longer mandibular bodies. High values of PC2 represent mandibles with taller and slightly wider coronoid processes, more ventral angular and condylar processes, and shorter mandibular bodies relative to the mean shape.
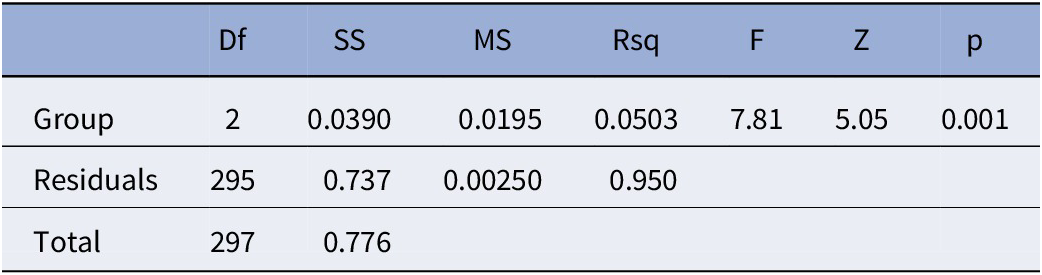
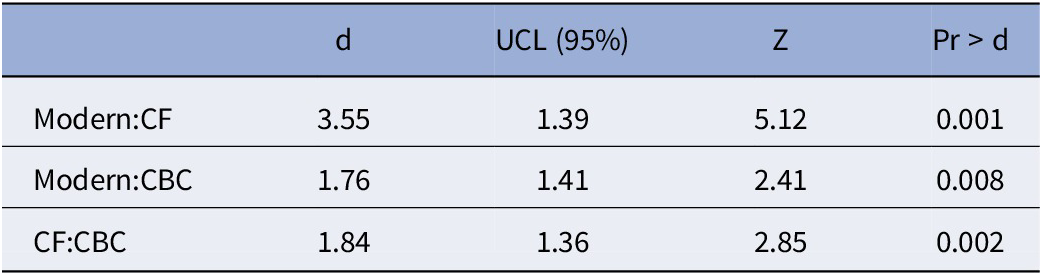
To evaluate whether the mean mandibular shape at each fossil site was different from the modern mean shape, a Procrustes ANOVA was applied to the superimposed coordinate data (Table 2). The ANOVA was highly significant (F = 7.808, p < 0.001), and post hoc pairwise testing was employed. All three groups were significantly different from one another (Modern:Conard Fissure d = 3.545, p < 0.001; Modern:Cumberland Bone Cave d = 1.761, p = 0.008; Conard Fissure:Cumberland Bone Cave d = 1.844, p = 0.002; Table 3). The mean shapes for each group are shown in comparison in Figure 4. Compared with the modern sample, the average N. vison mandible from Conard Fissure has a more posterior coronoid process, a more anterior angular process, and a slightly narrower mandibular body around the midpoint. The average N. vison mandible from Cumberland Bone Cave is more like the modern sample than the average N. vison mandible from Conard Fissure but also displays a shorter and slightly narrower coronoid process. Compared with one another, the average N. vison mandible from Conard Fissure has a taller coronoid process, a more anterior angular process, and a slightly narrower mandibular body than the average N. vison mandible from Cumberland Bone Cave. The Procrustes ANOVA for centroid size found no significant differences among these three groups (F = 0.0709, p = 0.918). The Procrustes ANOVA for sexual shape and size dimorphism found effects of size (F = 14.066, p < 0.001) and sex (F = 2.315, p = 0.020) but not their interaction (F = 1.835, p = 0.057) on shape. On average, male N. vison display slightly wider coronoid processes and more posterior angular processes than female N. vison.
The results of a Procrustes ANOVA comparing mandibular shape among N. vison from modern collections and two fossil sites

Table 2. Long description
The table consists of eight columns: Df, S S, M S, Rsq, F, Z, and p.
* The first row, Group, has the following values: Df is 2, S S is 0.0390, M S is 0.0195, Rsq is 0.0503, F is 7.81, Z is 5.05, and p is 0.001.
* The second row, Residuals, has the following values: Df is 295, S S is 0.737, M S is 0.00250, and Rsq is 0.950. The F, Z, and p columns are empty for this row.
* The third row, Total, shows a Df of 297 and an S S of 0.776.
Abbreviations are defined as: Df for degrees of freedom, S S for sum of squares, M S for mean squares, Rsq for R-squared coefficient of determination, F for F-ratio, Z for z-score, and p for p-value.
Note: Df = degrees of freedom; SS = sum of squares; MS = mean squares; Rsq = R2 or the coefficient of determination; F = F-ratio for ANOVAs; Z = z-score for the F-ratio; p = p-value.
Post hoc comparisons of standardized distances between group means (using pairwise) for the Procrustes ANOVA comparing among modern N. vison and two fossil sites (Table 2)

Table 3. Long description
The table consists of five columns: Comparison Group, d (standardized distance), U C L (95 percent upper confidence limit), Z (z-score), and Pr > d (p-value).
* Row 1: Modern compared to C F (Conard Fissure) shows d = 3.55, U C L = 1.39, Z = 5.12, and Pr > d = 0.001.
* Row 2: Modern compared to C B C (Cumberland Bone Cave) shows d = 1.76, U C L = 1.41, Z = 2.41, and Pr > d = 0.008.
* Row 3: C F compared to C B C shows d = 1.84, U C L = 1.36, Z = 2.85, and Pr > d = 0.002.
All comparisons are statistically significant at the p < 0.05 level.
Note: All post hoc comparisons are significant at the p < 0.05 level. CF = Conard Fissure; CBC = Cumberland Bone Cave; d = standardized distances between means; UCL = upper confidence limit; Z = z-score for d; Pr > d = p-value comparing d and the upper confidence limit.
Direct comparisons between groups for the mean mandible shape as described landmarks and semilandmarks. Comparisons are made between (1) modern (gray) and Conard Fissure (light blue, large points) N. vison, (2) modern and Cumberland Bone Cave (dark blue, large points) N. vison, and (3) Conard Fissure (light blue, small points) N. vison and Cumberland Bone Cave (dark blue, large points) N. vison. The mean shapes for these groups were all found to be significantly different from one another (Tables 2, 3).

The role of measurement error due to landmark placement was assessed by calculating repeatability and percentage measurement error and then recalculating these statistics with each point sequentially removed. The average repeatability was 88.2%, and the percentage measurement error was 11.8%. The jackknife tests revealed that removing any single point caused the percentage measurement error to increase above 13.0%. Landmarks 1 (anterior to the first premolar) and 9 (tip of the angular process) were particularly important, with their removal leading to percentage measurement error scores of 15.3% and 14.2%, respectively.
Discussion
In this study, we aim to quantify variation in Neogale vison mandibular shape among fossil assemblages and populations of modern N. vison. We describe shape variation in several bony processes and the mandible as a whole. We also find significant differences in mandibular shape among fossil assemblages. Previous studies have directly compared fossil individuals with modern individuals living in the same geographic region and have shown potentially functional differences in shape (Gidley and Gazin, Reference Gidley and Gazin1938; Anderson, Reference Anderson1977). Here we directly compare fossils from multiple North American sites with a continent-wide sample of modern N. vison. In doing so, we describe unique forms among fossils, especially those from Conard Fissure, and demonstrate a subtle pattern of change in this lineage (Fig. 3; SI Tables 2, 3).
Significant shape divergence is recovered between modern N. vison and two fossil sites and concentrated in specific regions of the mandible. Both PCAs show variation in the shape of the angular process and in the relative anteroposterior breadth of the coronoid process, with high loadings on the landmarks defining these structures in the most strongly explanatory PCs (Fig. 3; SI Fig. 1). The PCA on the full landmarking scheme shows additional variation in the shape of the coronoid process in the first principal components (Fig. 3). Both Procrustes ANOVAs are significant for differences in shapes among groups (Table 2; SI Table 5). Post hoc testing finds the mean mandibular shape among fossils from Conard Fissure and Cumberland Bone Cave to be significantly different from the modern mean (Table 3; SI Table 6). N. vison from Conard Fissure, on average, have more posterior coronoid processes and more anterior angular processes relative to the modern sample. N. vison from Cumberland Bone Cave, on average, display a shorter and slightly narrower coronoid processes compared with the modern sample.
The full landmarking scheme shows a significant difference in mean shape between Conard Fissure and Cumberland Bone Cave (Table 3), but this difference is not found in the reduced landmarking scheme (SI Table 6). This discrepancy may arise from the reduced landmarking scheme not capturing the demonstrated differences in coronoid process shape between the two sites (Fig. 4.3). The reduced landmarking scheme also shows a significant difference in mean shape between Conard Fissure and the Tanana River Valley specimen (SI Table 6). Only one mandible from the Tanana River Valley site is included, and this result should be interpreted with caution. This mandible was figured by Anderson (Reference Anderson1977) and is described in that work as falling within the range of morphologies found among modern N. vison in Alaska. Judging from qualitative assessment, the mandible is buccolingually wider than most near the carnassial and possesses a more excavated masseteric fossa, where deep chewing muscles attached (Salcido and Polly, Reference Salcido and Polly2025), but this variation is not addressed by our landmarking scheme. Other phenotypic differences among samples not captured by our landmarking scheme, such as differences in tooth and cusp proportions, may exist. No other post hoc comparisons are significant. The mandible found at Aucilla River appears very similar to the N. vison specimens from Florida included in this study, with an anteroposteriorly narrow coronoid process and a large, posteriorly projected angular process.
Overall, N. vison mandibles found at Conard Fissure and Cumberland Bone Cave have distinct shapes relative to modern N. vison (Fig. 4). N. vison from Conard Fissure tend to display the most extreme shapes, with more posterior coronoid processes and more anterior angular processes than the mean modern shape (Fig. 3). N. vison from Cumberland Bone Cave have shorter coronoid processes on average than modern N. vison but are not as distinct as those found at Conard Fissure. It is worth noting that the modern group is location-averaged, whereas the fossil assemblages are time-averaged. Such a comparison may show differences that, if comparing fossils with a more restricted geographic sample, may not be statistically significant. Although this comparison would not be appropriate to demonstrate species-wide evolution through time, it can demonstrate the presence of morphologies in fossil assemblages not otherwise represented in the entire breadth of modern N. vison morphologies.
Within the sample of modern N. vison mandibles, we recover a strong signal of sexual size dimorphism and a weaker but significant signal of sexual shape dimorphism. Morphological studies of modern N. vison, and mustelids at large, frequently recover both size and shape dimorphism (Wiig, Reference Wiig1986; Dayan and Simberloff, Reference Dayan and Simberloff1994; Thom et al., Reference Thom, Harrington and Macdonald2004; Stevens and Kennedy, Reference Stevens and Kennedy2005; Gálvez-López et al., Reference Gálvez-López, Kilbourne and Cox2021). Within N. vison and some other mustelids, sexual dimorphism is thought to support niche separation, with larger males specializing on larger prey and females specializing on smaller prey (Dayan and Simberloff, Reference Dayan and Simberloff1994; Thom et al., Reference Thom, Harrington and Macdonald2004). Our results agree with these findings, with a significant centroid size difference between male and female N. vison. The shape difference between male and female N. vison, when separated from the size difference, does not align with the major shape differences seen between N. vison from fossil sites and modern N. vison.
Most of the variation we observe among all sampled mandibles is concentrated on chewing-muscle attachment sites: the coronoid process is the insertion of the temporalis, and the angular process is the insertion of the masseter buccally and the medial pterygoid lingually (Hartstone-Rose et al., Reference Hartstone-Rose, Hertzig and Dickinson2019; Gálvez-López and Cox, Reference Gálvez-López and Cox2022). The mean mandibular shape for N. vison from Conard Fissure has these muscular insertion points closer to their respective cranial origins relative to the modern or Cumberland Bone Cave mean shapes. This indicates relatively shorter muscle fibers and overall higher bite force, but lower bite velocity, for these individuals (Loeb and Ghez, Reference Loeb and Ghez2000; Hartstone-Rose et al., Reference Hartstone-Rose, Hertzig and Dickinson2019, Reference Hartstone-Rose, Dickinson, Deutsch, Worden and Hirschkorn2022).
The relative positions of these muscular attachments also affect bite force via the mechanical advantage produced by different in-lever and out-lever lengths. Shorter in-levers and longer out-levers decrease mechanical advantage but may also increase jaw closure speed and reach (Hartstone-Rose et al., Reference Hartstone-Rose, Dickinson, Deutsch, Worden and Hirschkorn2022; Salcido and Polly, Reference Salcido and Polly2025). Relative to the modern sample, the average fossil mandible’s coronoid process is more posterior, mandibular condyle is more ventral, and angular process is more anterior. Although not directly measured here, these changes should act to maintain the same in-lever lengths whereas having relatively shorter fiber lengths effectively increases bite force without sacrificing jaw closure speed but potentially decreasing jaw gape (Greaves, Reference Greaves1983; Hartstone-Rose et al., Reference Hartstone-Rose, Hertzig and Dickinson2019). Modern N. vison are known to exploit prey larger than themselves and may use their relatively longer fiber lengths to facilitate this behavior (Larivière, Reference Larivière1999; Hartstone-Rose et al., Reference Hartstone-Rose, Hertzig and Dickinson2019, Reference Hartstone-Rose, Dickinson, Deutsch, Worden and Hirschkorn2022). Although fossil N. vison may have had a smaller maximum prey size, there is no evidence that the range of biomechanically available prey sizes was heavily restricted.
Any combination of abiotic and biotic factors may have contributed to this shape change and an inferred correlated decrease in bite force over time. For example, a change in prey size or processing requirements may correlate with a change in tooth or mandibular shape (Kurtén, Reference Kurtén1988; Meloro et al., Reference Meloro, Raia, Carotenuto and Cobb2011; Salcido and Polly, Reference Salcido and Polly2025). The faunal lists for Conard Fissure and Cumberland Bone Cave indicate no obviously missing prey items or categories. Although the exact species present vary, and fish and invertebrate prey are not discussed, both sites possess representatives of Peromyscus, Ondatra, Marmota, Sorex, and Lepus, all common prey of modern N. vison (Brown, Reference Brown1908; Gidley and Gazin, Reference Gidley and Gazin1938; Larivière, Reference Larivière1999). Changes in morphology through time in some of these taxa have been noted (Eshelman et al., Reference Eshelman, Bell, Graham, Semken and Withnell2025), but differences in body size within each genus are smaller than the overall breadth of prey size for N. vison and are unlikely to account for differences in jaw shape and function.
Even if the available genera of prey at each site are similar, the realized niche for N. vison may vary due to different patterns of niche partitioning with other small carnivores. Small mustelids, such as martens (Martes) and weasels (Mustela), are present at Conard Fissure. However, large mustelids such as otters (Lontra), badgers (Taxidea), and wolverines (Gulo) are missing (Gidley and Gazin, Reference Gidley and Gazin1938). At Conard Fissure, 35 specimens have been attributed to N. vison, along with a dozen specimens of skunk, over 40 specimens of weasel, seven specimens of fisher, and a few other fossils attributed to mid-size carnivorans, such as Vulpes, Procyon, Lynx, and Felis (Brown, Reference Brown1908). Given these sample sizes and the apparent lack of a taphonomic filter for their body size, it is reasonable to infer that large mustelids were absent or rare at this site. Today, the North American river otter, Lontra canadensis (Schreber, Reference Schreber1777) is thought to compete most directly with N. vison for resources: they primarily occupy similar habitats, and both are semiaquatic predators, but L. canadensis is primarily piscivorous and more fully aquatic than N. vison (Powell and Zielinski, Reference Powell and Zielinski1983; Ben-David et al., Reference Ben-David, Bowyer and Faro1996; Holland et al., Reference Holland, Schauber, Nielsen and Hellgren2019). Taxidea and Gulo are less likely to compete with N. vison because they take advantage of different, terrestrial, prey: Taxidea species include more insects in their diets, whereas Gulo includes much larger prey than N. vison as well as carcasses (Kollias and Fernandez-Moran, Reference Kollias, Fernandez-Moran, Miller and Fowler2015). N. vison can take relatively large prey for their body size (Thom et al., Reference Thom, Harrington and Macdonald2004; Gálvez-López et al., Reference Gálvez-López, Kilbourne and Cox2021), whereas L. canadensis will take a variety of sizes of prey but may preferentially select larger fish (Cote et al., Reference Cote, Gregory and Stewart2008; Stearns and Serfass, Reference Stearns and Serfass2011). Both are known to consume members of Salmonidae (Ben-David et al., Reference Ben-David, Hanley, Klein and Schell1997; Day et al., Reference Day, Westover and McMillan2015). Relative to N. vison, L. canadensis locomote more efficiently in water (Williams, Reference Williams1983; Anderson, Reference Anderson2024), possess more specialized postcranial anatomy for aquatic locomotion (Schutz and Guralnick, Reference Schutz and Guralnick2007; Samuels et al., Reference Samuels, Meachen and Sakai2013; Kilbourne, Reference Kilbourne2017; Botton-Divet et al., Reference Botton-Divet, Houssaye, Herrel, Fabre and Cornette2018), utilize larger waterways in freshwater systems (Holland et al., Reference Holland, Schauber, Nielsen and Hellgren2019; Anderson, Reference Anderson2024), utilize areas with more intense tides and waves in oceanic systems (Ben-David et al., Reference Ben-David, Bowyer and Faro1996), and maintain larger home ranges (Stevens et al., Reference Stevens, Ashwood and Sleeman1997; Larivière and Walton, Reference Larivière and Walton1998; Gorman et al., Reference Gorman, Erb, McMillan and Martin2006; Haan and Halbrook, Reference Haan and Halbrook2015; Halbrook and Petach, Reference Halbrook and Petach2018). Taken together, these lines of evidence suggest that these two species typically partition the environment, with L. canadensis using more aquatic resources and N. vison using more terrestrial resources, but there is overlap in the potential prey resources available to both species (Ben-David et al., Reference Ben-David, Bowyer and Faro1996). However, studies have reported minimal or no direct competition in cases where resources are abundant (Powell and Zielinski, Reference Powell and Zielinski1983; Holland et al., Reference Holland, Schauber, Nielsen and Hellgren2019). Partitioning of resources based on body size has been reported between male and female mustelids of multiple species (Dayan and Simberloff, Reference Dayan and Simberloff1994; Thom et al., Reference Thom, Harrington and Macdonald2004). In summary, the absence of Lontra, and perhaps other large mustelids, at Conard Fissure may have contributed to a different pattern of niche partitioning, particularly with respect to prey items in the size range accessible to both N. vison and otters. Such a shift in prey availability could explain the shift in mandibular shape toward a stronger bite without a shift in size.
However, this shift in mandibular shape over time is also consistent with N. vison taking advantage of more small prey in the Holocene. The ancestral state of N. vison is not assessed here, and the early Pleistocene and earlier mustelid fossil record is scarce, making such a determination difficult. Given the decline in diversity of small mammals during the Pliocene and Pleistocene, it is possible that N. vison have evolved faster bites to take advantage of a recent increase in small mammal diversity (Samuels and Hopkins, Reference Samuels and Hopkins2017).
The faunal list for Cumberland Bone Cave includes Lontra (formerly Lutra)¸ Taxidea, and Gulo but is missing other mustelines, such as weasels or stoats belonging to Mustela. Also missing are other small to medium carnivorans, including Mephitis, Lynx, and Vulpes (Gidley and Gazin, Reference Gidley and Gazin1938). The N. vison fossils from Cumberland Bone Cave are not as morphologically distinct as those from Conard Fissure, but they diverge from modern N. vison in similar ways. It is possible but far from clear whether the morphologies seen at both fossil sites are driven by these same biotic factors.
The role of abiotic factors such as climate in differentiating N. vison among fossil sites is not clear. Both of these fossil sites are referred to the Pleistocene, with Conard Fissure presenting a somewhat younger fauna than Cumberland Bone Cave (Brown, Reference Brown1908; Gidley and Gazin, Reference Gidley and Gazin1938; Bell et al., Reference Bell, Lundelius, Barnosky, Graham, Lindsay, Ruez, Semken, Webb, Zakrzewski and Woodburne2004; Eshelman et al., Reference Eshelman, Bell, Graham, Semken and Withnell2025). Given climatic oscillations and changing glacial extents during this time, it is difficult even with a well-constrained site age to infer the climatic conditions at these sites. Cumberland Bone Cave’s faunal list contains taxa typical of both boreal (i.e., Synaptomys [formerly Mictomys], Ochotoma) and warmer (i.e., Tapirus, Eptesicus, Platygonus) environments (Gidley and Gazin, Reference Gidley and Gazin1938; Eshelman et al., Reference Eshelman, Bell, Graham, Semken and Withnell2025). Explanations for this co-occurrence of disparately adapted taxa include higher topographic relief than is currently present in the region, which has been considered unlikely, or that remains accumulated in the cave over both glacial and interglacial periods (Gidley and Gazin, Reference Gidley and Gazin1938). Conard Fissure lacks most taxa typical of warmer environments but contains fossils belonging to many boreal species (Brown, Reference Brown1908; Gidley and Gazin, Reference Gidley and Gazin1938). Conard Fissure has been estimated to lie south of the maximum glacial extent, suggesting that the site may have experienced shifts in community composition due to southward migration of some taxa (Brown, Reference Brown1908). Because of these high levels of climatic oscillation and potential for community restructuring, it is difficult to show support for or evidence against any role of climate. Due to temporal averaging of fossil assemblages, N. vison fossils from the same site may have experienced different climatic conditions, although perhaps not more different than the conditions experienced by N. vison in the modern sample. Further study of other Pleistocene taxa may shed light on the role of climate.
Our proposed proximate, biomechanical mechanisms explaining the divergent morphology seen at Conard Fissure may inform our understanding of the intersection of the ecology and evolution of N. vison. It is possible that the morphological shift was the result of genetic drift, although this is unlikely because of functional constraints on the mandible. N. vison also have larger ranges and lower population densities than species of lower trophic levels, which may promote greater gene flow and heterogeneity over larger distances (Kurtén, Reference Kurtén1957; Stevens et al., Reference Stevens, Kennedy and Kelley2005). Phylogeographic studies of N. vison and other similarly widespread mustelid species have often found support for broad-scale population structure (Moretti et al., Reference Moretti, Al-Sheikhly, Guerrini, Theng, Gupta, Haba, Khan, Khan and Barbanera2017; Hernández-Romero et al., Reference Hernández-Romero, Gutiérrez-Rodríguez, Valdespino and Prieto-Torres2018; Guerrini et al., Reference Guerrini, Forcina, Chua, Theng and Al-Sheikhly2020; Hapeman et al., Reference Hapeman, Smith, Kosciolek, Winchester and Gore2021). However, investigations of population structure in other mustelids that utilize whole-genome sequencing tend to find evidence for admixture and paraphyly within named subspecies (Du Plessis et al., Reference Du Plessis, Blaxter, Koepfli, Chadwick and Hailer2023; de Ferran et al., Reference de Ferran, Vieira Figueiró, Trinca, Hernández-Romero, Lorenzana, Gutiérrez-Rodríguez, Koepfli and Eizirik2024). Any population structuring present today may also be the result of recent habitat fragmentation (although Pleistocene glacial cycles may also have impacted habitat connectivity). Overall, it is unlikely that the distinct morphology seen at Conard Fissure is present solely due to selectively neutral local divergence.
However, the appearance and disappearance of this morphology is consistent with the ephemeral variation hypothesis. If Conard Fissure is indeed a younger site than Cumberland Bone Cave, this suggests that the most extreme morphology occurs chronologically between two more similar morphologies. Either this lineage failed to survive, or its unique variation was counteracted by gene flow with other N. vison populations. It is also possible that the whole species underwent a shift toward jaws with stronger bite forces during this time; further study of fossils would be needed to support this hypothesis. Furthermore, it is possible that, with the changes in climate and ecosystem structure seen in North America since the Middle Pleistocene, N. vison have since gained faster bites, and lost some bite force, in accordance with a greater reliance on small-bodied prey in the Holocene.
The N. vison fossils from Conard Fissure do not represent the only recorded instance of divergent morphology evolving within N. vison and closely related species. The sea mink (Neogale macrodon) is an extinct species sister to N. vison. It was localized to the coast of New England during the past several thousand years and is believed to have been hunted to extinction within the past 200 years (Mead et al., Reference Mead, Spiess and Sobolik2000; Sealfon, Reference Sealfon2007). It possessed multiple adaptations to the coastal environment, including more bunodont teeth and a larger body size (Mead et al., Reference Mead, Spiess and Sobolik2000; Sealfon, Reference Sealfon2007; Work et al., Reference Work, Lewis, Johnson and Bourque2025). The mandible of N. macrodon has been described as more robust than that of any extant subspecies: specifically, the tooth row is longer than that of any extant subspecies, and the height of the mandible is near the maximum of extant variation, most comparable to the Alaska mink, Neogale vison ingens (Osgood, Reference Osgood1900) (Mead et al., Reference Mead, Spiess and Sobolik2000). N. macrodon, unlike N. vison from Conard Fissure, may have been isolated enough to avoid the averaging effects of gene flow and undergo a speciation event (Futuyma, Reference Futuyma1987; Kurtén, Reference Kurtén1988; Mead et al., Reference Mead, Spiess and Sobolik2000; Coyne and Orr, Reference Coyne and Orr2004; Sealfon, Reference Sealfon2007). The presence of this lineage further demonstrates high trait lability in N. vison, as evidenced by its ability to be artificially selected for fur traits and invade new environments (Wiig, Reference Wiig1985; Kruska and Schreiber, Reference Kruska and Schreiber1999; Melero et al., Reference Melero, Palazón and Gosàlbez2008; Korablev et al., Reference Korablev, Korablev and Korablev2013; Gálvez-López and Cox, Reference Gálvez-López and Cox2022).
In summary, the evidence presented here suggests that N. vison have high lability in their mandibular shape. Several populations of N. vison (and the extinct N. macrodon) have been described as having uniquely robust jaws (Hollister, Reference Hollister1913; Mead et al., Reference Mead, Spiess and Sobolik2000). This shape may be ideal for capturing and processing stronger or larger prey (Christiansen, Reference Christiansen2008; Salcido and Polly, Reference Salcido and Polly2025). This repeated directional evolution may indicate the presence of an evolutionary line of least resistance but may also indicate adaptation to different prey in the Holocene. Developmental research in other taxa has suggested that the mandible contains multiple developmental modules (Mezey et al., Reference Mezey, Cheverud and Wagner2000; Klingenberg, Reference Klingenberg2008; Meloro et al., Reference Meloro, Raia, Carotenuto and Cobb2011). The body or corpus of the mandible has been identified as a separate morphological module relative to the ramus in carnivores (Meloro et al., Reference Meloro, Raia, Carotenuto and Cobb2011). This information agrees with developmental studies of mice that have shown these two regions to be separately controlled developmental modules (Mezey et al., Reference Mezey, Cheverud and Wagner2000; Klingenberg, Reference Klingenberg2008). Much previous research on the genetic architecture of N. vison has focused on captive populations and genes whose functionally contribute to coat quality and domestication (Cai et al., Reference Cai, Villumsen, Asp, Guldbrandtsen, Sahana and Lund2018; Morris et al., Reference Morris, Bowman, Schulte-Hostedde and Wilson2020; Karimi et al., Reference Karimi, Ngoc Do, Sargolzaei and Miar2021; Davoudi et al., Reference Davoudi, Do, Colombo, Rathgeber, Sargolzaei, Plastow, Wang and Miar2023; Hu et al., Reference Hu, Do, Manafiazar, Kelvin, Sargolzaei, Plastow, Wang and Miar2023). However, some recent research has suggested different selective regimes among N. vison subspecies, including selection on plasticity in varying environments and aquatic prey capture (Affini et al., Reference Affini, Baranowski, Forbes, Foust and Hatley2026). The repeated evolution of higher robusticity in jaws among species of Neogale may indicate high genetic variability and a line of least resistance. Future work is needed to understand the impact of high genomic and phenotypic variability on the American mink’s invasive capacity, ease of domestication, and generalist habit.
Acknowledgments
K. Hurdle and the NYIT Data Visualization Center provided access and help with their CT scanner. E. Hoeger, M. Surovy, and L. Caspers (AMNH); J. Meng, K. Clark, and A. Gishlick (AMNH); S. Davis, A. Henrici, and M. Lamanna (CMNH); J. Bloch, T. Lott, V. Mathis, and R. Narducci (FLMNH); J. Esselstyn and D. Dittmann (LSUMNS); J. Cook, J. Dunnum, and A. Raniszewski (MSB); J. Kirchman (NYSM); and A. Gunderson and L. Olson (UAM) provided access to specimens and scans. P. Hapeman, T. Smiley, and K. Veeramah gave helpful feedback during project design and commented on this manuscript. A. Bryan, A. Dong, C. Espiritu, and N. Morales assisted with scan reconstruction. J. Samuels and two anonymous reviewers gave constructive feedback on the manuscript. This project was funded by a 2023 Student Research Grant from the Paleontological Society to A.M.P., a 2023 G. Williams Award from the Department of Ecology and Evolution at Stony Brook University to A.M.P., and start-up funding from Stony Brook University to N.S.V.
Author contribution
A.M.P.: Conceptualization (lead); data curation (lead); formal analysis (lead); funding acquisition (equal); investigation (lead); methodology (lead); project administration (lead); resources (supporting); software (lead); validation (lead); visualization (lead); writing—original draft (lead); writing—review and editing (equal). NSV: Conceptualization (supporting); funding acquisition (equal); methodology (supporting); resources (lead); software (supporting); supervision (lead); writing—review and editing (equal).
Competing interests
The authors declare none.
Data availability statement
Data available from the Dryad Digital Repository: https://doi.org/10.5061/dryad.bnzs7h4t8.