1 Introduction
Several engineering systems, such as high-Reynolds-number wind tunnels, chemical transport and processing, refrigeration and energy conversion cycles, make use of compressible working fluids characterized by a complex thermodynamic behaviour. Significant interest has been paid in the literature to these so-called dense gases, which are single-phase fluids of medium to high molecular complexity that can exhibit non-classical phenomena when working at temperatures and pressures of the general order of magnitude of their liquid/vapour critical point. Such fluids are often employed as working fluid in organic Rankine cycles (ORCs) (see Colonna et al. Reference Colonna, Casati, Trapp, Mathijssen, Larjola, Turunen-Saaresti and Uusitalo2015) and heat pumps (Zamfirescu & Dincer Reference Zamfirescu and Dincer2009). Considerable progress has been made in the past thirty years about the study of dense-gas flows, which are characterized by values of the fundamental derivative of gas dynamics,  $\unicode[STIX]{x1D6E4}=1+(\unicode[STIX]{x1D70C}/a)(\unicode[STIX]{x2202}a/\unicode[STIX]{x2202}\unicode[STIX]{x1D70C})_{s}$, lower than unity (with
 $\unicode[STIX]{x1D70C}$ the fluid density,
 $a$ the sound speed and
 $s$ the entropy). Of particular interest are the so-called Bethe–Zel’dovich–Thompson (BZT) fluids, which exhibit a region of negative
 $\unicode[STIX]{x1D6E4}$ values in their vapour phase (inversion zone), leading to the appearance of non-classical phenomena like expansion shocks, sonic and double-sonic shocks, and shock splitting (Thompson & Lambrakis Reference Thompson and Lambrakis1973; Cramer & Kluwick Reference Cramer and Kluwick1984; Cramer Reference Cramer and Kluwick1991).
In most studies on dense gases, viscous effects are generally neglected. For large Reynolds numbers, these effects are noticeable inside the thin boundary layers adjacent to solid walls. Research in viscous dense-gas flows has concentrated primarily on laminar flows (Kluwick Reference Kluwick1994, Reference Kluwick2004, Reference Kluwick2017; Cramer, Whitlock & Tarkenton Reference Cramer, Whitlock and Tarkenton1996; Cinnella & Congedo Reference Cinnella and Congedo2007). Cramer et al. (Reference Cramer, Whitlock and Tarkenton1996) compared similarity solutions for nitrogen N2, representative of a perfect gas, sulfur hexafluoride SF6, used in heavy-gas wind tunnels, and toluene, widespread in ORC turbomachinery, for free-stream Mach numbers,  $M_{\infty }$, between 2 and 3. Kluwick (Reference Kluwick2004) considered laminar boundary layers of nitrogen and two BZT fluids, PP11 (perfluoro-perhydro-phenanthrene) and FC-71 (perfluoro-trihexylamine) at
 $M_{\infty }=2$, whereas Cinnella & Congedo (Reference Cinnella and Congedo2007) performed numerical simulations for a lighter fluorocarbon, PP10 (perfluoro-perhydro-fluorene), at
 $M_{\infty }=0.9$ and 2. In the case of N2, dissipative effects cause a substantial temperature variation and the velocity profile deviates significantly from the Blasius result in the incompressible limit. On the other hand, for all studied dense gases, the temperature remains almost constant due to the high heat capacity of the fluid. The isobaric heat capacity
 $c_{p}$ can indeed become quite large in the neighbourhood of the critical point (Cramer et al. Reference Cramer, Whitlock and Tarkenton1996). This effect is also related to the molecular complexity of heavy compounds. Kluwick (Reference Kluwick2004) used the ratio of the specific heat at constant volume over the gas constant,
 $c_{v}/R$, to characterize the molecular complexity. He noted that the Eckert number
 $Ec$, which is the ratio of the kinetic energy over the fluid enthalpy, is proportional to
 $M_{\infty }^{2}$ in the ideal-gas limit, whereas it scales with
 $M_{\infty }^{2}\times R/c_{v}$ for real gases. Typical values of the molecular complexity for vapours of BZT fluids are in the range 100 to 150, so that dissipation caused by internal friction and heat conduction can be neglected for dense gases, even at relatively large supersonic Mach numbers. The temperature and the density are nearly constant across the boundary layer, and consequently the velocity profiles for boundary layers of dense gases nearly collapse onto the incompressible profile.
The smallness of the Eckert number explains most of the deviations from the classical boundary-layer behaviour but there are also other unconventional gas dynamic properties of dense gases that can modify the flow. For instance, the viscosity  $\unicode[STIX]{x1D707}$ is no longer independent of pressure (or density), and it can decrease with the temperature as in liquids (the behaviour of
 $\unicode[STIX]{x1D707}$ is in general a transition between the liquid-like and gas-like regimes). The thermal conductivity
 $\unicode[STIX]{x1D705}$ follows the same trends, and large variations of
 $c_{p}$ induce strong variations of the Prandtl number (
 $Pr=\unicode[STIX]{x1D707}c_{p}/\unicode[STIX]{x1D705}$). Therefore, a dense gas behaves very differently than an ideal gas, where the constant-
 $Pr$ assumption is generally a reasonable approximation. With the aim of studying dense-gas effects on viscous turbulent flows, direct numerical simulations (DNS) have been carried out for isotropic turbulence (Sciacovelli et al. Reference Sciacovelli, Cinnella, Content and Grasso2016; Sciacovelli, Cinnella & Grasso Reference Sciacovelli, Cinnella and Grasso2017b) and turbulent channel flows (Sciacovelli, Cinnella & Gloerfelt Reference Sciacovelli, Cinnella and Gloerfelt2017a). Negligible friction heating has been observed for the wall-bounded case along with a liquid-like behaviour of the viscosity. Despite the negligible temperature variations across the channel, strong density fluctuations are present and maximal close to the wall, due to the non-standard thermodynamic behaviour. Near the wall, density fluctuations are correlated with pressure ones, unlike the perfect gas, where the near-wall streaks correspond directly to high- and low-density fluid.
In the present paper, we explore the linear stability of compressible boundary layers in the presence of dense-gas effects. This is a first step to get some insight into laminar–turbulent transition of dense-gas boundary layers, which is of particular interest owing to its impact on drag and heat transfer. The regime of interest for ORC turbines is transonic to supersonic, up to Mach numbers of 2.5 (Romei et al. Reference Romei, Vimercati, Persico and Guardone2020), but there is a theoretical interest in extending the study to higher-speed flows. More specifically, the paradoxical findings that, despite velocity profiles close to the incompressible ones, boundary layers of dense gases exhibit strong and unconventional compressibility effects, leaves some questions about the evolution of unstable modes when compressibility comes into play.
In the case of incompressible flows of a perfect gas, a local linear boundary-layer stability analysis shows the emergence of the Tollmien–Schlichting (TS) mode that is unstable above its critical Reynolds number (Schmid & Henningson Reference Schmid and Henningson2001; Schlichting & Gersten Reference Schlichting and Gersten2003). In the absence of a pressure gradient, the velocity profile does not exhibit an inflection point, and the role of viscosity is essential in the destabilization of the TS mode. At high speeds, density and temperature play a role that becomes more and more significant as the Mach number increases. The characteristics of the TS mode change (Reshotko Reference Reshotko1976; Mack Reference Mack1984a, Reference Mack and Dwoyer1987; Fedorov Reference Fedorov2011; Zhong & Wang Reference Zhong and Wang2012): first, its growth rate is reduced; then, for supersonic speeds, three-dimensional (3-D) oblique waves are the most unstable (whereas, at low speeds, the unstable modes are preferentially two-dimensional (2-D), as required by the Squire theorem). As the Mach number is further increased, the velocity profile weighted by the density exhibits a generalized inflection point at a distance from the wall that increases as the Mach number increases (Lees & Lin Reference Lees and Lin1946). For Mach numbers greater than approximately 3, the nature of the TS instability becomes progressively inviscid, even if its growth rate remains significantly lower than in the incompressible regime.
Additionally, Mack (Reference Mack1975, Reference Mack1984a, Reference Mack and Dwoyer1987) discovered that multiple unstable modes arise when a region of the mean flow becomes supersonic relative to the phase speed of the modes. These inviscid instabilities are associated with acoustic trapping of energy near the wall. They are sometimes referred to as ‘acoustic’ modes, even if their nature is not really acoustic. Indeed, being trapped, they do not radiate outside the boundary layer but they are linked to the reflections of Mach waves between the wall and the relative sonic line. The phenomenon being preferentially 2-D, acoustic modes are non-skewed modes (contrary to compressible TS modes). The acoustic resonance can contribute to the instability of the mode by extracting energy. For a flat-plate perfect-gas case, under adiabatic wall conditions, the first of the Mack modes, called the second mode, has a growth rate that exceeds the TS mode (also called the first mode) for Mach numbers greater than 4. In the context of hypersonic boundary layers, many studies have been dedicated to the characterization of the second mode, in both experiments and simulations (Stetson & Kimmel Reference Stetson and Kimmel1992; Chokani Reference Chokani1999; Franko & Lele Reference Franko and Lele2013; Sivasubramanian & Fasel Reference Sivasubramanian and Fasel2015; Craig et al. Reference Craig, Humble, Hofferth and Saric2019).
The rich variety of unstable modes that appears at large Mach numbers is strongly dependent on the thermodynamic and transport properties of the gas and on the coupling with acoustic phenomena (Tam & Hu Reference Tam and Hu1989; Mack Reference Mack1990; Fedorov & Khokhlov Reference Fedorov and Khokhlov2001; Fedorov & Tumin Reference Fedorov and Tumin2011). Owing to the multiplicity of modes that occur at large Mach numbers, great attention has been given to the receptivity of the boundary layers (Fedorov Reference Fedorov2003; Ma & Zhong Reference Ma and Zhong2003), and to investigating the influence of numerous factors such as wall cooling (Mack Reference Mack1975, Reference Mack and Dwoyer1987; Bitter & Shepherd Reference Bitter and Shepherd2015), pressure gradients (Malik Reference Malik1991), transverse curvature (Malik & Spall Reference Malik and Spall1991), chemical reactions (Malik & Anderson Reference Malik and Anderson1991; Stuckert & Reed Reference Stuckert and Reed1994; Hudson, Chokani & Candler Reference Hudson, Chokani and Candler1997), thermal non-equilibrium (Marxen et al. Reference Marxen, Magin, Iaccarino and Shaqfeh2011), surface ablation (Mortensen & Zhong Reference Mortensen and Zhong2018), porous walls (Brès et al. Reference Brès, Inkman, Colonius and Fedorov2013), etc.
The expected negligible temperature variation in dense-gas boundary layers has some similarities with perfect-gas boundary layers with strong wall cooling. Under these conditions, the suppression of the generalized inflection point has been demonstrated (Lees Reference Lees1947), yielding stabilization of the first mode. On the other hand, Mack (Reference Mack1984a) has shown that the second mode undergoes a reversal effect and it tends towards higher frequencies. Recent investigations (Bitter & Shepherd Reference Bitter and Shepherd2015; Chuvakhov & Fedorov Reference Chuvakhov and Fedorov2016; Mortensen Reference Mortensen2018; Knisely & Zhong Reference Knisely and Zhong2019a,Reference Knisely and Zhongb,Reference Knisely and Zhongc) have found that a supersonic mode can appear in the presence of an intense wall cooling that travels supersonically with respect to the free stream and can radiate acoustic waves outside of the boundary layer. The renewed interest in the supersonic mode is due to its presence in high-enthalpy wind tunnels and its relevance in hypersonic flight (see Knisely & Zhong (Reference Knisely and Zhong2019b) and references therein). Bitter & Shepherd (Reference Bitter and Shepherd2015) characterized the supersonic mode at high Mach numbers and high levels of wall cooling, coupled with the presence of thermal non-equilibrium effects. As the wall temperature is decreased, the mode is shifted towards higher frequencies and is amplified. A change of slope in the growth rate is observed when the phase speed becomes supersonic and the mode synchronizes with the acoustics as it stabilizes. Mortensen (Reference Mortensen2018) reported similar characteristics for hypersonic boundary layers at Mach 20 over blunt cones, and showed the influence of the nose radius and chemical recombination of atomic oxygen on the amplification of the supersonic mode. Its impact on the transition in Mach 5 flow over a blunt cold-wall cone with thermochemical non-equilibrium was also studied by Knisely & Zhong (Reference Knisely and Zhong2019b,Reference Knisely and Zhongc) both through linear stability theory (LST) and DNS. They showed that for moderate wall cooling the supersonic mode still arises; however, it is unlikely that this leads to transition.
As previously pointed out, dense gases are characterized by a peculiar behaviour of the transport properties and a strong variation of the Prandtl number. These effects have been analysed by Govindarajan & Sahu (Reference Govindarajan and Sahu2014) and Saika et al. (Reference Saika, Ramachandran, Sinha and Govindarajan2017), who showed that the stability is strongly affected by the stratification of the transport properties, which can be quantified by a single non-dimensional parameter, the Prandtl number. Other works of particular interest for the present study are the recent linear stability analyses including non-ideal fluid effects for plane Poiseuille flows (Ren, Fu & Pecnik Reference Ren, Fu and Pecnik2019a) and compressible boundary layers (Ren, Marxen & Pecnik Reference Ren, Marxen and Pecnik2019b). These authors were interested in the stability of supercritical fluid flows, and more specifically carbon dioxide (CO2) at pressure above the critical value. Non-ideal effects were taken into account through complex models for the equation of state and for the transport properties. For compressible boundary layers over adiabatic walls, Ren et al. (Reference Ren, Marxen and Pecnik2019b) explored unstable modes for several values of the free-stream temperature and of the Eckert number in the vicinity of the Widom line, which marks the cross-over between liquid-like and gas-like behaviour in supercritical fluids. When working on one side of this line, in the so-called subcritical and supercritical temperature regimes, the boundary layer is stabilized for high values of the Eckert number or for free-stream temperatures close to the pseudo-critical one. In the particular case where the temperature profile crosses the Widom line (transcritical regime), the flow is significantly destabilized and a new inviscid mode can dominate, which is not of acoustic nature, unlike Mack’s mode (Robinet & Gloerfelt Reference Robinet and Gloerfelt2019). Furthermore, Ren et al. (Reference Ren, Fu and Pecnik2019a,Reference Ren, Marxen and Pecnikb) have extended the LST framework to arbitrary equations of state and transport properties. They also showed that the generalized Rayleigh criterion is applicable to non-ideal gases.
The present paper addresses linear stability of zero-pressure-gradient boundary layers of dense gases in the compressible regime, which has, to the best of our knowledge, not been studied before. The paper is organized as follows. The governing equations are presented in § 2, with special attention paid to the properties and models for the selected dense gases. The numerical tools for the base flow and the stability equations have been generalized to arbitrary equations of state in § 3. The results obtained by increasing compressibility effects are discussed in § 4, where the unstable modes for a particular dense gas are compared with classical ones for an ideal gas. The effects of changing the thermodynamic conditions or the fluid nature are reported in § 5, to assess the peculiar behaviour observed in dense gases.
2 Governing equations and gas model
2.1 Flow conservation equations
We consider flows of gases in the single-phase regime, governed by the compressible Navier–Stokes equations, written in differential form as
 $$\begin{eqnarray}\displaystyle & \displaystyle \frac{\unicode[STIX]{x2202}\unicode[STIX]{x1D70C}}{\unicode[STIX]{x2202}t}+\frac{\unicode[STIX]{x2202}(\unicode[STIX]{x1D70C}u_{j})}{\unicode[STIX]{x2202}x_{j}}=0, & \displaystyle\end{eqnarray}$$
 $$\begin{eqnarray}\displaystyle & \displaystyle \frac{\unicode[STIX]{x2202}(\unicode[STIX]{x1D70C}u_{i})}{\unicode[STIX]{x2202}t}+\frac{\unicode[STIX]{x2202}(\unicode[STIX]{x1D70C}u_{i}u_{j})}{\unicode[STIX]{x2202}x_{j}}+\frac{\unicode[STIX]{x2202}p}{\unicode[STIX]{x2202}x_{i}}-\frac{\unicode[STIX]{x2202}\unicode[STIX]{x1D70F}_{ij}}{\unicode[STIX]{x2202}x_{j}}=0, & \displaystyle\end{eqnarray}$$
 $$\begin{eqnarray}\displaystyle & \displaystyle \frac{\unicode[STIX]{x2202}(\unicode[STIX]{x1D70C}E)}{\unicode[STIX]{x2202}t}+\frac{\unicode[STIX]{x2202}((\unicode[STIX]{x1D70C}E+p)u_{j})}{\unicode[STIX]{x2202}x_{j}}-\frac{\unicode[STIX]{x2202}(\unicode[STIX]{x1D70F}_{ij}u_{i})}{\unicode[STIX]{x2202}x_{j}}+\frac{\unicode[STIX]{x2202}q_{j}}{\unicode[STIX]{x2202}x_{j}}=0, & \displaystyle\end{eqnarray}$$
where  $x_{i}=(x,y,z)$ are the coordinates in the streamwise, wall-normal and spanwise directions,
 $u_{i}=(u,v,w)$ are the corresponding velocity components,
 $\unicode[STIX]{x1D70C}$ is the density and
 $p$ is the pressure. The specific total energy is
 $E\equiv e+u_{j}u_{j}/2$,
 $e$ being the specific internal energy, and the viscous stress tensor
 $\unicode[STIX]{x1D70F}_{ij}$ is defined as
 $$\begin{eqnarray}\unicode[STIX]{x1D70F}_{ij}\equiv \frac{\unicode[STIX]{x1D707}}{Re}\left(\frac{\unicode[STIX]{x2202}u_{i}}{\unicode[STIX]{x2202}x_{j}}+\frac{\unicode[STIX]{x2202}u_{j}}{\unicode[STIX]{x2202}x_{i}}\right)+\frac{\unicode[STIX]{x1D706}}{Re}\frac{\unicode[STIX]{x2202}u_{k}}{\unicode[STIX]{x2202}x_{k}}\unicode[STIX]{x1D6FF}_{ij},\end{eqnarray}$$
where  $\unicode[STIX]{x1D707}$ is the dynamic viscosity and
 $\unicode[STIX]{x1D6FF}_{ij}$ denotes the Kronecker symbol. The second viscosity is set according to Stokes’ hypothesis,
 $\unicode[STIX]{x1D706}=-2\unicode[STIX]{x1D707}/3$, assuming a zero bulk viscosity. This approximation is well verified for a dense gas (see appendix B of Sciacovelli et al. (Reference Sciacovelli, Cinnella and Gloerfelt2017a)). Finally, the heat flux
 $q_{j}$ is modelled by Fourier’s law:
 $$\begin{eqnarray}q_{j}=-\frac{\unicode[STIX]{x1D705}}{RePrEc}\frac{\unicode[STIX]{x2202}T}{\unicode[STIX]{x2202}x_{j}},\end{eqnarray}$$
where  $\unicode[STIX]{x1D705}$ is the thermal conductivity. The conservation equations have been made dimensionless using the following variables:
 $$\begin{eqnarray}\displaystyle \unicode[STIX]{x1D70C}=\frac{\unicode[STIX]{x1D70C}^{\ast }}{\unicode[STIX]{x1D70C}_{\infty }^{\ast }},\quad T=\frac{T^{\ast }}{T_{\infty }^{\ast }},\quad u_{i}=\frac{u_{i}^{\ast }}{u_{\infty }^{\ast }},\quad x_{i}=\frac{x_{i}^{\ast }}{L^{\ast }}, & & \displaystyle\end{eqnarray}$$
 $$\begin{eqnarray}\displaystyle t=\frac{t^{\ast }u_{\infty }^{\ast }}{L^{\ast }},\quad p=\frac{p^{\ast }}{\unicode[STIX]{x1D70C}_{\infty }^{\ast }{u_{\infty }^{\ast }}^{2}},\quad \unicode[STIX]{x1D707}=\frac{\unicode[STIX]{x1D707}^{\ast }}{\unicode[STIX]{x1D707}_{\infty }^{\ast }},\quad \unicode[STIX]{x1D705}=\frac{\unicode[STIX]{x1D705}^{\ast }}{\unicode[STIX]{x1D705}_{\infty }^{\ast }}, & & \displaystyle\end{eqnarray}$$
where the superscript  $^{\ast }$ indicates a dimensional quantity. The non-dimensional numbers that appear (Reynolds
 $Re$, Prandtl
 $Pr$ and Eckert
 $Ec$ numbers) are defined as
 $$\begin{eqnarray}Re=\frac{\unicode[STIX]{x1D70C}_{\infty }^{\ast }u_{\infty }^{\ast }L^{\ast }}{\unicode[STIX]{x1D707}_{\infty }^{\ast }},\quad Pr=\frac{\unicode[STIX]{x1D707}_{\infty }^{\ast }c_{p,\infty }^{\ast }}{\unicode[STIX]{x1D705}_{\infty }^{\ast }},\quad Ec=\frac{{u_{\infty }^{\ast }}^{2}}{c_{p,\infty }^{\ast }T_{\infty }^{\ast }},\end{eqnarray}$$
where the subscript  $_{\infty }$ refers to free-stream conditions,
 $L^{\ast }$ is a reference length and
 $c_{p}^{\ast }$ is the specific heat at constant pressure. We also introduce the free-stream Mach number:
 $$\begin{eqnarray}M_{\infty }=\frac{u_{\infty }^{\ast }}{c_{\infty }^{\ast }}.\end{eqnarray}$$
Note that, for an ideal gas, the Eckert number is  $Ec_{\infty }=(\unicode[STIX]{x1D6FE}-1)M_{\infty }^{2}$, with
 $\unicode[STIX]{x1D6FE}$ the ratio of specific heats.
2.2 Equation of state and transport properties
The system is supplemented by thermal and caloric equations of state (EOS), respectively:
 $$\begin{eqnarray}p=p(\unicode[STIX]{x1D70C},T)\quad \text{and}\quad e=e(\unicode[STIX]{x1D70C},T).\end{eqnarray}$$
For air, considered as a thermally and calorically perfect gas,
 $$\begin{eqnarray}p^{\ast }=\unicode[STIX]{x1D70C}^{\ast }R^{\ast }T^{\ast }\quad \text{and}\quad e^{\ast }=c_{v}^{\ast }T^{\ast },\end{eqnarray}$$
where  $c_{v}^{\ast }=R^{\ast }/(\unicode[STIX]{x1D6FE}-1)=\text{const.}$,
 $R^{\ast }={\mathcal{R}}^{\ast }/{\mathcal{M}}^{\ast }=287.06~\text{J}~\text{kg}^{-1}~\text{K}^{-1}$ (with
 ${\mathcal{R}}^{\ast }$ being the universal gas constant and
 ${\mathcal{M}}^{\ast }$ the gas molecular weight) and
 $\unicode[STIX]{x1D6FE}=1.4$. Sutherland’s law is used to model the viscosity
 $\unicode[STIX]{x1D707}$:
 $$\begin{eqnarray}\frac{\unicode[STIX]{x1D707}^{\ast }}{\unicode[STIX]{x1D707}_{ref}^{\ast }}=\left(\frac{T^{\ast }}{T_{ref}^{\ast }}\right)^{3/2}\,\frac{T_{ref}^{\ast }+S_{0}^{\ast }}{T^{\ast }+S_{0}^{\ast }},\end{eqnarray}$$
with  $\unicode[STIX]{x1D707}_{ref}^{\ast }=1.716\times 10^{-5}~\text{Pa}~\text{s}$,
 $T_{ref}^{\ast }=273.15~\text{K}$ and
 $S_{0}^{\ast }=110.4~\text{K}$. A constant-Prandtl-number assumption is used to determine the thermal conductivity
 $\unicode[STIX]{x1D705}^{\ast }=c_{p}^{\ast }\,\unicode[STIX]{x1D707}^{\ast }/Pr$ (with
 $Pr=0.72$).
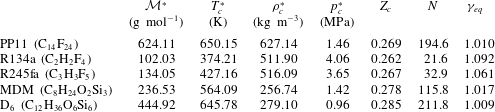
Thermodynamic properties of the selected dense gases: molecular weight ( ${\mathcal{M}}^{\ast }$), critical temperature (
 $T_{c}^{\ast }$), critical density (
 $\unicode[STIX]{x1D70C}_{c}^{\ast }$), critical pressure (
 $p_{c}^{\ast }$), critical compressibility factor (
 $Z_{c}=p_{c}^{\ast }/(\unicode[STIX]{x1D70C}_{c}^{\ast }R^{\ast }T_{c}^{\ast })$), molecular complexity (
 $N$) in terms of the number of active degrees of freedom, and equivalent ratio of ideal-gas specific heat at constant pressure and volume (
 $c_{p,\infty }^{\ast }(T_{c}^{\ast })/c_{v,\infty }^{\ast }(T_{c}^{\ast })$).

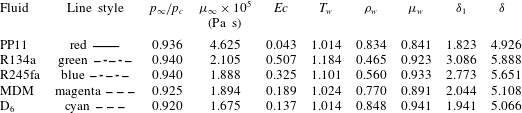
In the present study, five different dense gases are considered. Most of the results are obtained for PP11, which was used in our previous studies (Sciacovelli et al. Reference Sciacovelli, Cinnella, Content and Grasso2016, Reference Sciacovelli, Cinnella and Gloerfelt2017a,Reference Sciacovelli, Cinnella and Grassob), since it exhibits a relatively large inversion zone ( $\unicode[STIX]{x1D6E4}<0$). PP11 is the commercial name of the perfluoro-perhydro-phenanthrene, which belongs to the family of fluorocarbons (see Cramer Reference Cramer1989). We have also selected two refrigerants in the family of hydrofluorocarbons, which are widely used in ORC: R134a (1,1,1,2-tetrafluoroethane) and R245fa (1,1,1,3,3-pentafluoropropane). Finally, two siloxanes are considered: a relatively light linear siloxane called MDM (octamethyltrisiloxane), used in a recent experimental apparatus (Spinelli et al. Reference Spinelli, Cammi, Conti, Gallarini, Zocca, Cozzi, Gaetani, Dossena and Guardone2019), and a relatively heavy cyclic siloxane D6 (dodecamethylcyclohexasiloxane), which is expected to exhibit an inversion zone and is used in the FAST experimental facility at TU Delft (Mathijssen et al. Reference Mathijssen, Gallo, Casati, Nannan, Zamfirescu, Guardone and Colonna2015). Some thermodynamic properties of these gases are given in table 1. In the table we also report the number of active degrees of freedom (
 $N$) of the gas evaluated at its critical temperature, which is an indication of the molecular complexity of the gas and is defined as (Colonna & Guardone Reference Colonna and Guardone2006)
 $$\begin{eqnarray}N=2\frac{c_{v,\infty }^{\ast }(T_{c}^{\ast })}{R^{\ast }}\quad \text{with }c_{v,\infty }^{\ast }(T^{\ast })=\lim _{v^{\ast }\rightarrow \infty }c_{v}^{\ast }(v^{\ast },T^{\ast })\end{eqnarray}$$
and  $v^{\ast }=1/\unicode[STIX]{x1D70C}^{\ast }$ is the specific volume. The equivalent specific heat ratio is defined as
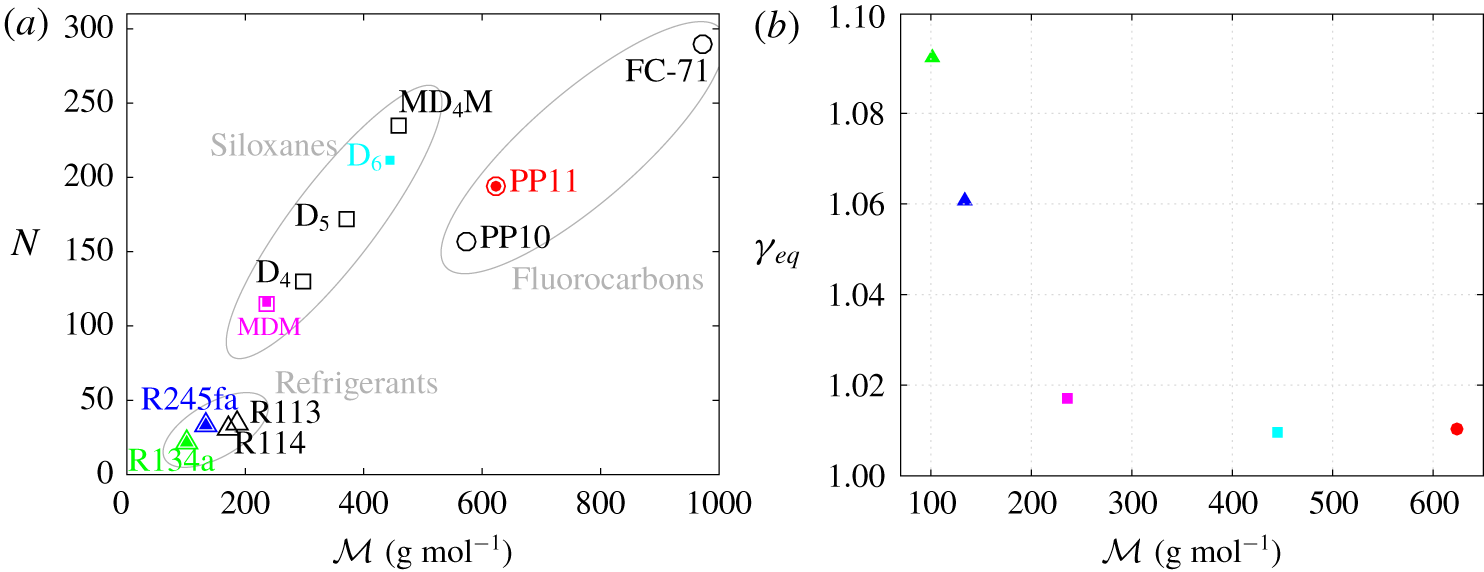
 $\unicode[STIX]{x1D6FE}_{eq}=1+2/N$. In figure 1, we report
 $N$ and
 $\unicode[STIX]{x1D6FE}_{eq}$ for the different families of dense gases. Figure 1 shows the dependence of the molecular complexity on the molecular weight. For the heaviest and more complex fluids,
 $N$ varies nearly linearly with
 ${\mathcal{M}}^{\ast }$. Note that the heaviest compounds considered in the study (D6 and PP11) have roughly similar values of
 $N$ and
 $\unicode[STIX]{x1D6FE}_{eq}$, even though D6 has a lower molecular weight than PP11.
Molecular complexity (a) and equivalent specific heat ratio (b) as functions of molecular weight for the selected dense gases. Coloured solid symbols correspond to values computed in the present study, and open symbols are from Cramer (Reference Cramer1989) for fluorocarbons and from Harinck, Guardone & Colonna (Reference Harinck, Guardone and Colonna2009) for refrigerants and siloxanes.

R134a, R245fa, MDM and D6 are modelled by means of the NIST REFPROP library (Lemmon, Huber & McLinden Reference Lemmon, Huber and McLinden2013), which contains the most accurate models available for EOS and transport properties. More specifically, the models consist of multi-parameter functional forms based on the Helmholtz free energy for the EOS, namely the models of Tillner-Roth & Baehr (Reference Tillner-Roth and Baehr1994) for R134a, Akasaka, Zhou & Lemmon (Reference Akasaka, Zhou and Lemmon2015) for R245fa, Thol et al. (Reference Thol, Dubberke, Baumhögger, Vrabec and Span2017) for MDM and Colonna, Nannan & Guardone (Reference Colonna, Nannan and Guardone2008) for D6. These correlations are accurate in the range of ( $p,v,T$) values used in the present study. The extended corresponding states models of Huber, Laesecke & Perkins (Reference Huber, Laesecke and Perkins2003) are used for transport properties of R134a, MDM and D6. For R245fa, recent measurements and correlations for viscosity and thermal conductivity are used (Perkins, Huber & Assael Reference Perkins, Huber and Assael2016). The more validated correlation is that for R134a with reported uncertainties of the order of 5 % for the viscosity. For the other fluids, the semi-empirical relations for transport properties may suffer from greater uncertainties in the supercritical regime of interest.
For PP11, the thermal equation of state is that of Martin & Hou (Reference Martin and Hou1955), which has been chosen in several previous works for fluorocarbons (Thompson & Lambrakis Reference Thompson and Lambrakis1973; Cramer Reference Cramer1989, Reference Cramer and Kluwick1991; Guardone, Vigevano & Argrow Reference Guardone, Vigevano and Argrow2004) in the absence of more validated EOS. This equation involves five virial terms and ensures high accuracy with a minimum amount of experimental information:
 $$\begin{eqnarray}p^{\ast }=\frac{R^{\ast }T^{\ast }}{(v^{\ast }-b^{\ast })}+\mathop{\sum }_{i=2}^{5}\frac{f_{i}(T^{\ast })}{(v^{\ast }-b^{\ast })^{i}},\end{eqnarray}$$
with  $b^{\ast }=v_{c}^{\ast }(1-\unicode[STIX]{x1D6FD}/Z_{c})$,
 $\unicode[STIX]{x1D6FD}=20.533Z_{c}-31.883Z_{c}^{2}$ and
 $$\begin{eqnarray}f_{i}(T^{\ast })=A_{i}+B_{i}T^{\ast }+C_{i}\exp (-kT^{\ast }/T_{c}^{\ast }),\end{eqnarray}$$
where  $v_{c}^{\ast }$,
 $T_{c}^{\ast }$ and
 $Z_{c}$ are the critical specific volume, temperature and compressibility factor, respectively, and
 $k=5.475$. Here
 $A_{i}$,
 $B_{i}$ and
 $C_{i}$ are gas-dependent coefficients that can be expressed in terms of the critical temperature and pressure, the critical compressibility factor, the Boyle temperature (which may be expressed as a function of the critical temperature) and one point on the vapour pressure curve. The temperature dependence of the low-density specific heat is approximated by a power law:
 $$\begin{eqnarray}c_{v,\infty }^{\ast }(T^{\ast })=c_{v,\infty }^{\ast }(T_{c}^{\ast })\left(\frac{T^{\ast }}{T_{c}^{\ast }}\right)^{n},\end{eqnarray}$$
where  $n=0.5776$ for PP11. The fluid viscosity and thermal conductivity are evaluated by means of the generalized laws derived by Chung et al. (Reference Chung, Ajlan, Lee and Starling1988), which contain a correction term that takes into account the strong density dependence of the transport properties in the dense-gas region. Details about the laws of Chung et al. (Reference Chung, Ajlan, Lee and Starling1988) are given in appendix A of Sciacovelli et al. (Reference Sciacovelli, Cinnella and Gloerfelt2017a).
3 Methodology
3.1 Base flow calculations
The similarity solution of a zero-pressure-gradient compressible laminar boundary layer has been generalized to fluids governed by an arbitrary EOS. A generalized coordinate transformation is applied to the boundary-layer equations by introducing the Lees–Dorodnitsyn similarity variables (Anderson Reference Anderson2002):
 $$\begin{eqnarray}\unicode[STIX]{x1D709}=\int _{0}^{x}\unicode[STIX]{x1D70C}_{\infty }\unicode[STIX]{x1D707}_{\infty }u_{\infty }\,\text{d}x=\unicode[STIX]{x1D709}(x),\quad \unicode[STIX]{x1D702}=\frac{u_{\infty }}{\sqrt{2\unicode[STIX]{x1D709}}}\int _{0}^{y}\unicode[STIX]{x1D70C}\,\text{d}y=\unicode[STIX]{x1D702}(x,y).\end{eqnarray}$$
The transformation leads to the following system of ordinary differential equations:
 $$\begin{eqnarray}\left.\begin{array}{@{}l@{}}(C\,f_{\unicode[STIX]{x1D702}\unicode[STIX]{x1D702}})_{\unicode[STIX]{x1D702}}+f\,f_{\unicode[STIX]{x1D702}\unicode[STIX]{x1D702}}=0,\\[5.0pt] \displaystyle f\,g_{\unicode[STIX]{x1D702}}+\left(\frac{C}{Pr}g_{\unicode[STIX]{x1D702}}\right)_{\unicode[STIX]{x1D702}}+C\,Ec_{\infty }\,f_{\unicode[STIX]{x1D702}\unicode[STIX]{x1D702}}^{2}=0,\end{array}\right\}\end{eqnarray}$$
with  $f_{\unicode[STIX]{x1D702}}=u^{\ast }/u_{\infty }^{\ast }$,
 $g=h^{\ast }/h_{\infty }^{\ast }$,
 $h$ the total enthalpy,
 $C=(\unicode[STIX]{x1D70C}^{\ast }\unicode[STIX]{x1D707}^{\ast })/(\unicode[STIX]{x1D70C}_{\infty }^{\ast }\unicode[STIX]{x1D707}_{\infty }^{\ast })$ the Chapman–Rubesin parameter,
 $Ec_{\infty }={u_{\infty }^{\ast }}^{2}/h_{\infty }^{\ast }$ the Eckert number, and where
 $(\cdot )_{\unicode[STIX]{x1D702}}$ denotes a derivative with respect to
 $\unicode[STIX]{x1D702}$. The functions
 $f$ and
 $g$ are subject to the boundary conditions:
 $$\begin{eqnarray}f(0)=0,\quad f_{\unicode[STIX]{x1D702}}(0)=0,\quad f_{\unicode[STIX]{x1D702}}(\infty )=1,\quad g_{\unicode[STIX]{x1D702}}(0)=0,\quad g(\infty )=1.\end{eqnarray}$$
The system is solved by means of a multi-dimensional Broyden shooting method (Broyden Reference Broyden1965).
3.2 Linear stability theory
The preceding base flow is used for a local stability analysis using the linearized compressible Navier–Stokes equations in Cartesian coordinates  $(x,y,z)$. The local assumption imposes that base flow quantities
 $\tilde{\boldsymbol{q}}=(\tilde{u} ,\tilde{v},\tilde{w},\tilde{p},\tilde{\unicode[STIX]{x1D70C}},\tilde{T})^{\text{T}}$ are a function of
 $y$ solely and the perturbation can be written in normal-mode form:
 $$\begin{eqnarray}\displaystyle \boldsymbol{q}^{\prime }(x,y,z,t)=\tilde{\boldsymbol{q}}(y)\exp [\text{i}(\unicode[STIX]{x1D6FC}x+\unicode[STIX]{x1D6FD}z-\unicode[STIX]{x1D714}t)]+\text{c.c.},\end{eqnarray}$$
where c.c. stands for the complex conjugate,  $\unicode[STIX]{x1D714}$ is the real circular frequency and
 $\boldsymbol{k}=\unicode[STIX]{x1D6FC}\boldsymbol{e}_{x}+\unicode[STIX]{x1D6FD}\boldsymbol{e}_{z}$ the a priori complex wavenumber vector. The streamwise component of the wavenumber is a complex number,
 $\unicode[STIX]{x1D6FC}=\unicode[STIX]{x1D6FC}_{r}+\text{i}\unicode[STIX]{x1D6FC}_{i}$, where
 $\unicode[STIX]{x1D6FC}_{i}$ thus represents the amplification factor. The spanwise component
 $\unicode[STIX]{x1D6FD}$ defines the wave angle
 $\unicode[STIX]{x1D6F9}=\arctan (\unicode[STIX]{x1D6FD}/\unicode[STIX]{x1D6FC}_{r})$.
The normal-mode form is then introduced in the linearized Navier–Stokes equations to obtain the stability equations:
 $$\begin{eqnarray}\unicode[STIX]{x1D63C}\frac{\text{d}^{2}\tilde{\boldsymbol{q}}}{\text{d}y^{2}}+\unicode[STIX]{x1D63D}\frac{\text{d}\tilde{\boldsymbol{q}}}{\text{d}y}+\unicode[STIX]{x1D63E}\tilde{\boldsymbol{q}}=0,\end{eqnarray}$$
where matrices  $\unicode[STIX]{x1D63C}$,
 $\unicode[STIX]{x1D63D}$ and
 $\unicode[STIX]{x1D63E}\in {\mathcal{M}}_{6}(\mathbb{C})$ are given in appendix A. The boundary conditions at the free stream and at the wall are
 $$\begin{eqnarray}\tilde{u} =\tilde{v}=\tilde{w}=0,\quad \frac{\text{d}\tilde{p}}{\text{d}y}=0,\quad \frac{\text{d}\tilde{\unicode[STIX]{x1D70C}}}{\text{d}y}=0\quad \text{and}\quad \frac{\text{d}\tilde{T}}{\text{d}y}=0\quad \text{as }y\rightarrow 0,\infty .\end{eqnarray}$$
As both the equations and the boundary conditions are homogeneous, the system constitutes an eigenvalue problem in  $\unicode[STIX]{x1D6FC}$ and depends on the parameters
 $\unicode[STIX]{x1D714}$,
 $\unicode[STIX]{x1D6FD}$,
 $M_{\infty }$ and
 $Re$. The differential eigenvalue problem is solved using the Chebyshev collocation method (see Gloerfelt & Robinet (Reference Gloerfelt and Robinet2017) for details and appendix A for the sensitivity to numerical parameters). The nonlinear discretized eigenproblem is transformed into a problem with linear eigenvalues, and solved with the shift-invert method and a QZ algorithm. A Newton–Raphson algorithm is implemented to follow the selected modes.
In the following, the results are made non-dimensional using the free-stream velocity  $u_{\infty }^{\ast }$ as velocity scale and the Blasius length
 $L^{\ast }$ as length scale, such that
 $$\begin{eqnarray}Re=\frac{\unicode[STIX]{x1D70C}_{\infty }^{\ast }u_{\infty }^{\ast }L^{\ast }}{\unicode[STIX]{x1D707}_{\infty }^{\ast }}=\sqrt{\frac{\unicode[STIX]{x1D70C}_{\infty }^{\ast }u_{\infty }^{\ast }x^{\ast }}{\unicode[STIX]{x1D707}_{\infty }^{\ast }}}=Re_{x}^{1/2}.\end{eqnarray}$$
The non-dimensional frequency is then given by
 $$\begin{eqnarray}\unicode[STIX]{x1D714}=\frac{2\unicode[STIX]{x03C0}f^{\ast }L^{\ast }}{u_{\infty }^{\ast }}\quad \text{or}\quad F=\frac{2\unicode[STIX]{x03C0}f^{\ast }\unicode[STIX]{x1D707}_{\infty }^{\ast }}{\unicode[STIX]{x1D70C}_{\infty }^{\ast }{u_{\infty }^{\ast }}^{2}}.\end{eqnarray}$$
We have the simple relationship  $\unicode[STIX]{x1D714}=ReF$. Additionally, the growth rate is non-dimensionalized by
 $L^{\ast }$ and the complex phase speed (
 $c_{\unicode[STIX]{x1D711}}=c_{r}+\text{i}c_{i}$) is defined as
 $$\begin{eqnarray}c_{\unicode[STIX]{x1D711}}=\frac{\unicode[STIX]{x1D714}}{\sqrt{\unicode[STIX]{x1D6FD}^{2}+\unicode[STIX]{x1D6FC}^{2}}},\end{eqnarray}$$
which yields simply  $\unicode[STIX]{x1D714}/\unicode[STIX]{x1D6FC}$ for 2-D waves.
3.3 Direct numerical simulation
An in-house finite-difference code is used to solve the governing equations (2.1)–(2.3). The inviscid fluxes are discretized by means of 10th-order standard centred differences. The scheme is supplemented with a nonlinear artificial viscosity term containing a Ducros-type sensor, making it ninth-order-accurate far from discontinuities. Viscous fluxes are discretized with standard fourth-order centred derivatives, and a classical four-stage Runge–Kutta algorithm is used for time integration. For more details, the reader is referred to Sciacovelli et al. (Reference Sciacovelli, Cinnella, Content and Grasso2016), where the same numerical schemes are used. At the inflow, the compressible laminar solution generated by the similarity code is imposed. Adiabatic no-slip conditions are applied at the wall. Characteristics-based boundary conditions are imposed at the top, and outflow boundaries and periodicity is enforced in the spanwise direction.
4 Effect of Mach and Reynolds numbers on unstable modes
In order to highlight the main modifications with respect to the standard behaviour, the results obtained with PP11 for one operating point are analysed and compared to the perfect-gas solutions for air.
4.1 Base flow solutions
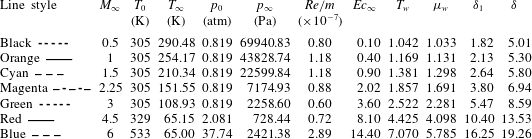
First, the influence of the Mach number on an adiabatic boundary layer is investigated for both air and PP11. The reference thermodynamic quantities for air are typical of wind tunnel conditions. For Mach numbers  $M_{\infty }=0.5$ to 3, the stagnation temperature and pressure values are
 $T_{0}=305~\text{K}$ and
 $p_{0}=0.819~\text{atm}$, respectively; at
 $M_{\infty }=6$, we take
 $T_{0}=533~\text{K}$ and
 $p_{0}=37.74~\text{atm}$. These conditions have been used in previous stability studies (Wazzan, Taghavi & Keltner Reference Wazzan, Taghavi and Keltner1984; Mack Reference Mack1984b; Reed & Balakumar Reference Reed and Balakumar1990). At
 $M_{\infty }=4.5$, which serves as a reference point in the present study, the conditions in the paper of Ma & Zhong (Reference Ma and Zhong2003) are used, namely
 $\unicode[STIX]{x1D70C}_{\infty }=0.03895~\text{kg}~\text{m}^{-3}$ and
 $T_{\infty }=65.15~\text{K}$. For air, the Prandtl number is set equal to 0.72, as in Ma & Zhong (Reference Ma and Zhong2003). The values for stagnation and static quantities are summarized in table 2.
Influence of Mach number for a perfect gas at  $Re=2000$: boundary-layer properties from similarity solution.

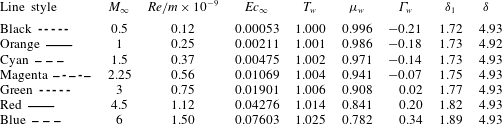
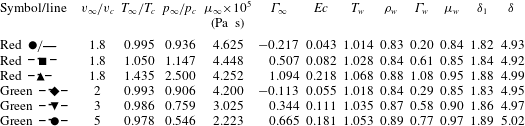
Influence of Mach number for a dense gas at  $Re=2000$: boundary-layer properties from similarity solution.

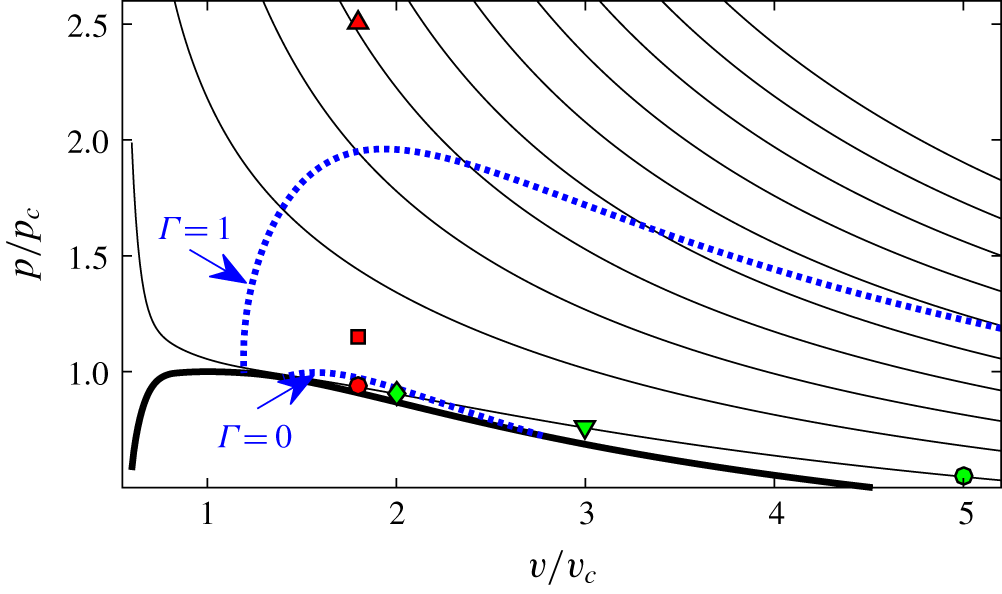
The operating point for PP11 is taken inside its inversion zone (further details are given in § 5, where the influence of the operating point is discussed). The free-stream conditions are fixed by using a specific volume  $v_{\infty }=1.8v_{c}$ and a temperature
 $T_{\infty }=0.995T_{c}$, yielding
 $\unicode[STIX]{x1D70C}_{\infty }=348.4~\text{kg}~\text{m}^{-3}$ and
 $T_{\infty }=646.8~\text{K}$, which correspond to a slightly supercritical wall temperature condition that avoids the occurrence of a two-phase flow. The fundamental derivative of gas dynamics is negative in the free stream (
 $\unicode[STIX]{x1D6E4}_{\infty }=-0.217$) and can become positive near the wall depending on the Mach number (see table 3). Such thermodynamic conditions are selected for consistency with previous DNS studies and with the aim of achieving the largest possible deviations from air, although these conditions are difficult to reproduce in an experimental facility, in particular, due to the risks of thermal decomposition of the fluid. The sensitivity of stability results to the operating conditions is discussed in § 5.1.
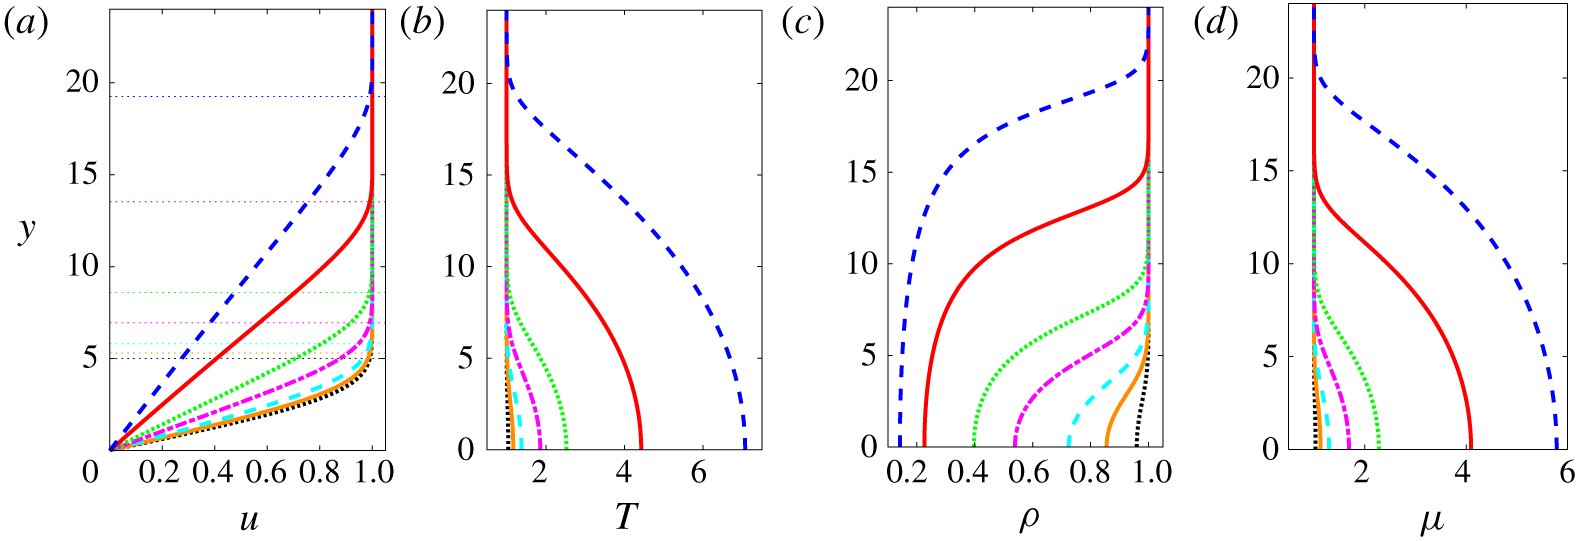
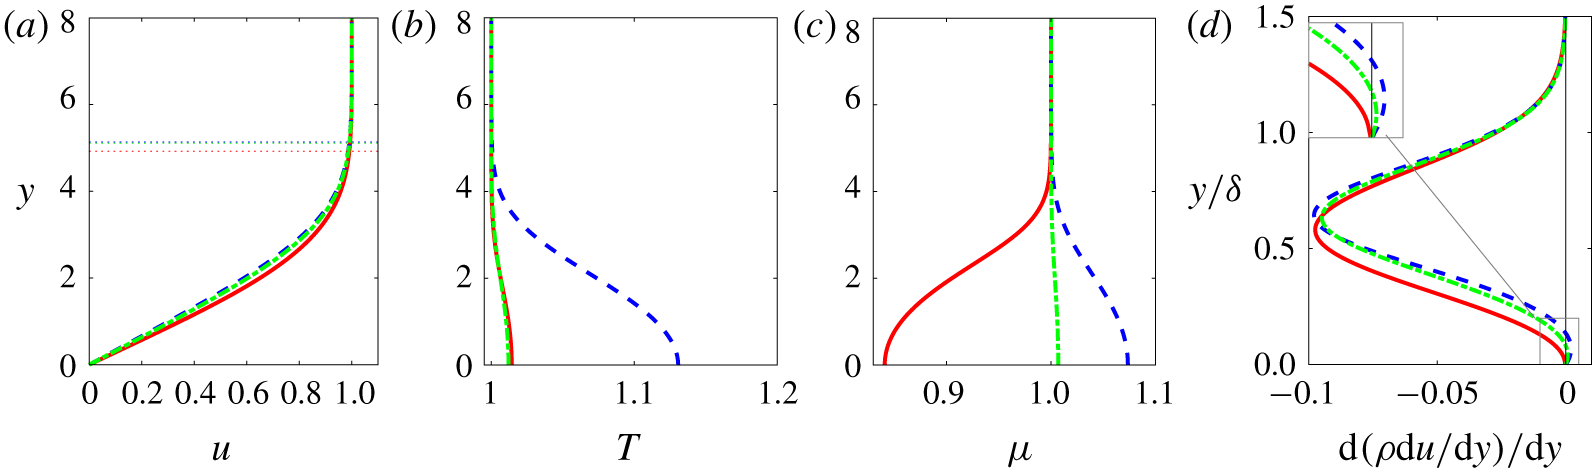
Similarity solution for air (perfect gas). Line legend as in table 2. The horizontal dotted lines in (a) mark the boundary-layer thickness  $\unicode[STIX]{x1D6FF}$.

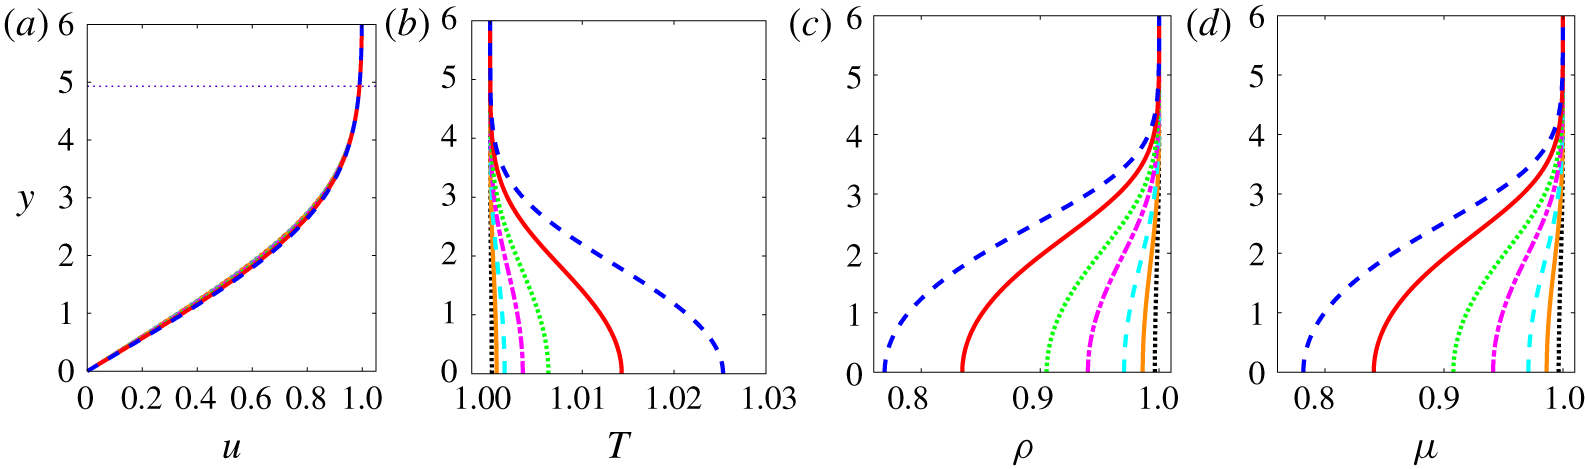
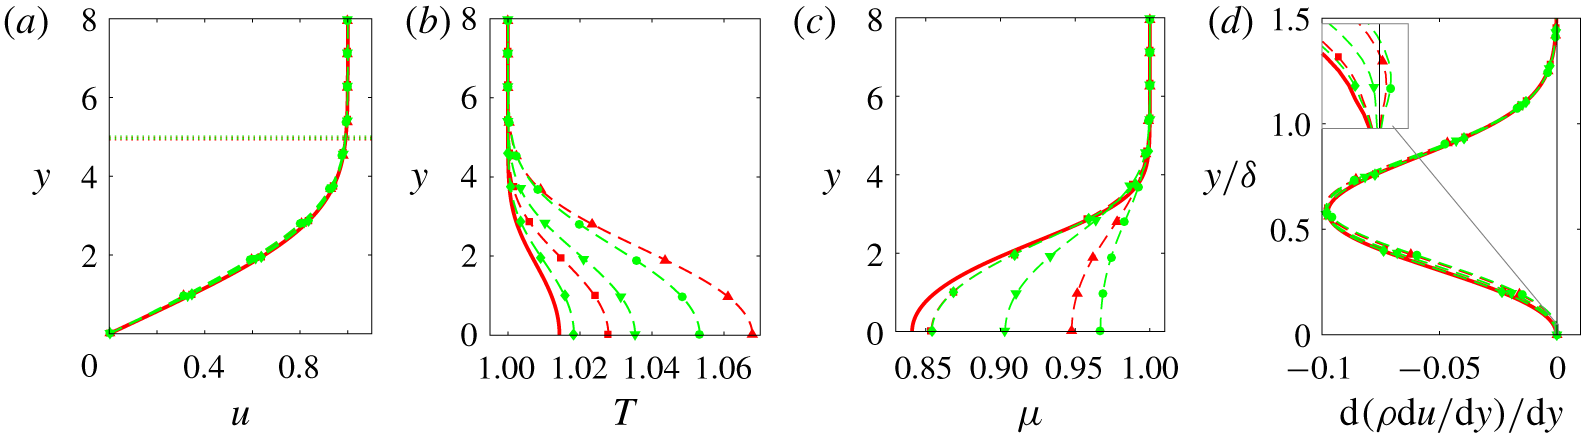
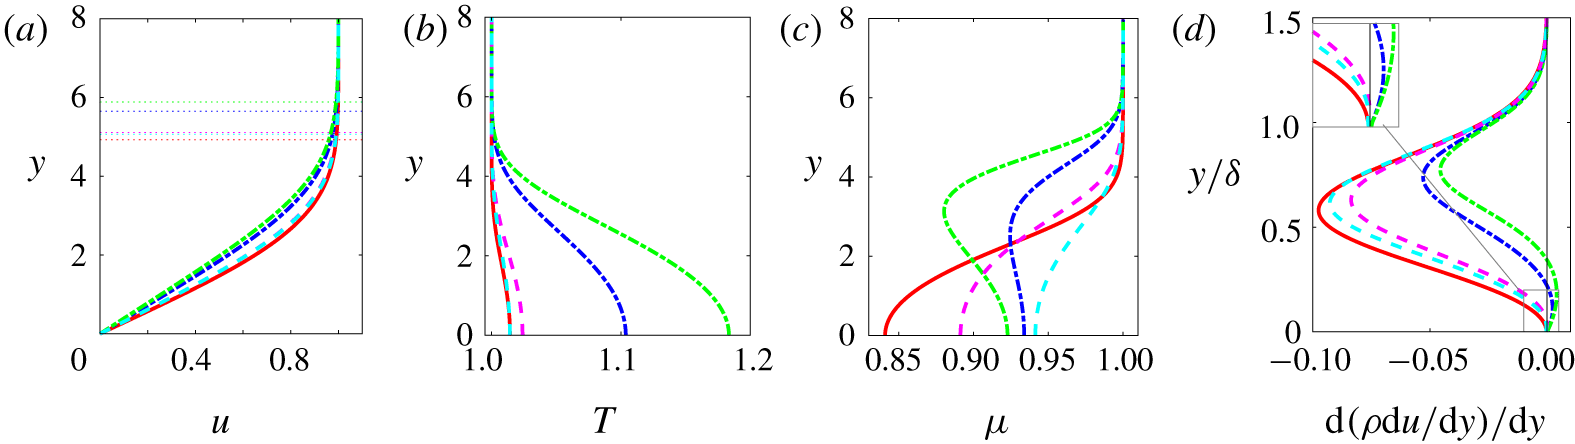
Figures 2 and 3 show the similarity solutions respectively for air and PP11 at various Mach numbers, as a function of the similarity variable  $\unicode[STIX]{x1D702}_{inc}=y^{\ast }/\sqrt{(\unicode[STIX]{x1D707}_{\infty }^{\ast }x^{\ast })/(\unicode[STIX]{x1D70C}_{\infty }^{\ast }u_{\infty }^{\ast })}\equiv y$. The most striking results are the differences in the thickening of the boundary layer (figures 2a and 3a). For air, due to the increase in viscosity (figure 2d), which in turn is a direct consequence of friction heating (figure 2b), the boundary layer thickens considerably as the Mach number grows.
On the contrary, for PP11, the velocity profiles remain almost indistinguishable from the incompressible counterpart, as already observed in the case of dense-gas laminar boundary layers (Cramer et al. Reference Cramer, Whitlock and Tarkenton1996; Kluwick Reference Kluwick2004; Cinnella & Congedo Reference Cinnella and Congedo2007), and this is the result of the weaker dependence of wall thermodynamic quantities ( $T$,
 $\unicode[STIX]{x1D70C}$ and
 $\unicode[STIX]{x1D707}$) on the Mach number. For example, the largest increase in wall temperature is only 2.5 % for
 $M_{\infty }=6$ for the dense gas, whereas a factor greater than 7 is obtained for the perfect gas. Wall values from the similarity solutions are given in tables 2 and 3, together with the non-dimensional boundary-layer thickness,
 $\unicode[STIX]{x1D6FF}$ (evaluated at
 $u=0.99$), and the displacement thickness,
 $\unicode[STIX]{x1D6FF}_{1}$. Furthermore, the values of the Eckert number for PP11 are two orders of magnitude less than those for air (see tables 2 and 3), in accordance with the asymptotic analysis of Kluwick (Reference Kluwick2004). It is also interesting to recall that in dense gas the viscosity has an opposite evolution compared to the perfect one and is closely correlated with the density (figures 3c and 3d).
Similarity solution for PP11 (dense gas). Line legend as in table 3. The horizontal dotted lines in (a) mark the boundary-layer thickness  $\unicode[STIX]{x1D6FF}$.

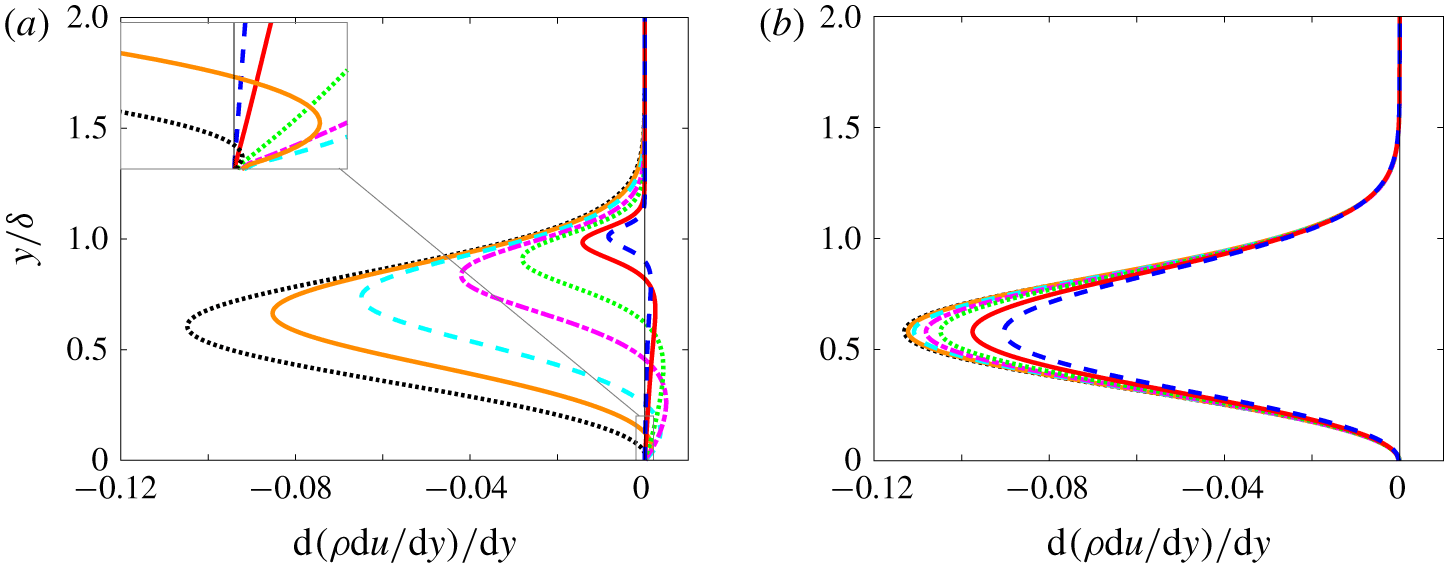
An important property of the base flow is the presence of a generalized inflection point,  $\text{d}(\unicode[STIX]{x1D70C}\,\text{d}u/\text{d}y)/\text{d}y=0$. Lees & Lin (Reference Lees and Lin1946) demonstrated that it gives a necessary condition for a compressible boundary-layer flow to be inviscidly unstable. Ren et al. (Reference Ren, Marxen and Pecnik2019b) showed that a similar criterion is applicable for non-ideal gases. The distributions of
 $\text{d}(\unicode[STIX]{x1D70C}\,\text{d}u/\text{d}y)/\text{d}y$ with
 $y/\unicode[STIX]{x1D6FF}$ are plotted in figure 4. The outward movement of the generalized inflection point with increasing
 $M_{\infty }$ is apparent in figure 4(a) for the perfect gas. On the contrary, no inflection point is observed for PP11 at this operating point, which indicates that an inviscid mechanism would not exist for the dense gas and the first mode should remain viscous in nature.


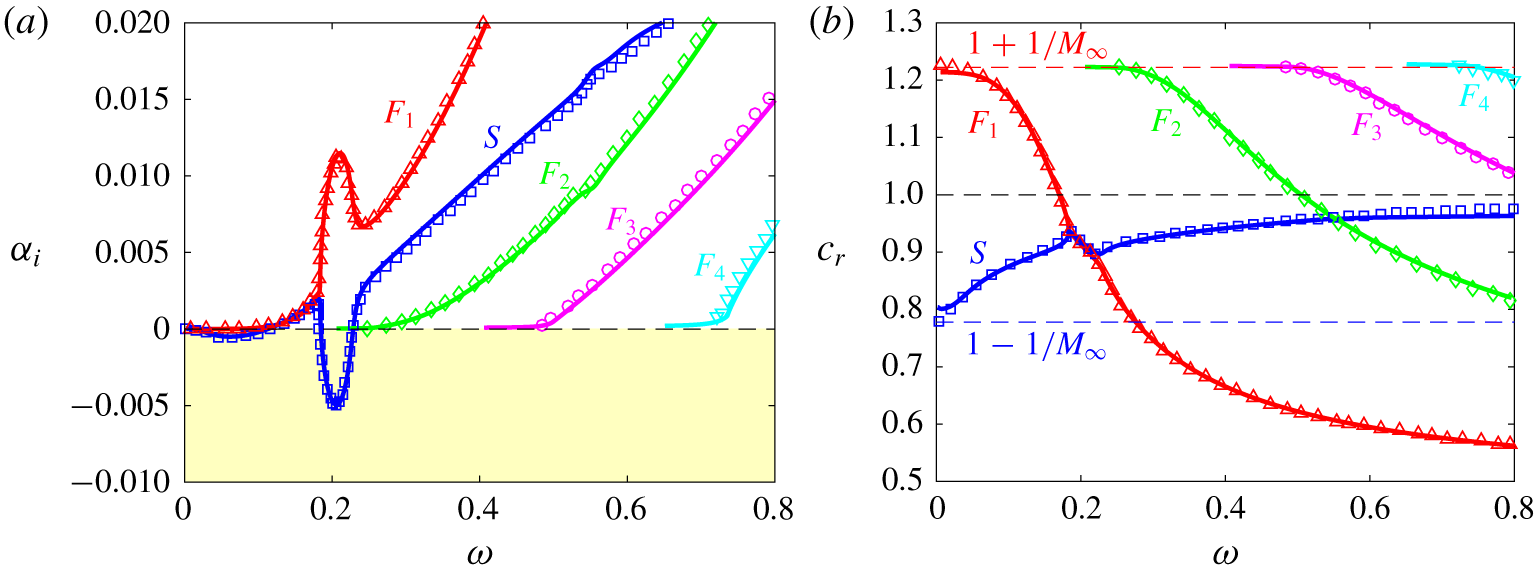
The LST for a perfect gas at  $M=4.5$ and
 $Re=2000$: growth rate (a) and phase speed (b). Present results (solid lines) are compared with results of Ma & Zhong (Reference Ma and Zhong2003) (symbols) for the slow mode
 $S$ (blue ——, blue ▫) and the fast modes
 $F_{1}$ (red ——, red ▵),
 $F_{2}$ (green ——, green ♢),
 $F_{3}$ (magenta ——, magenta ○) and
 $F_{4}$ (cyan ——, cyan ▿).

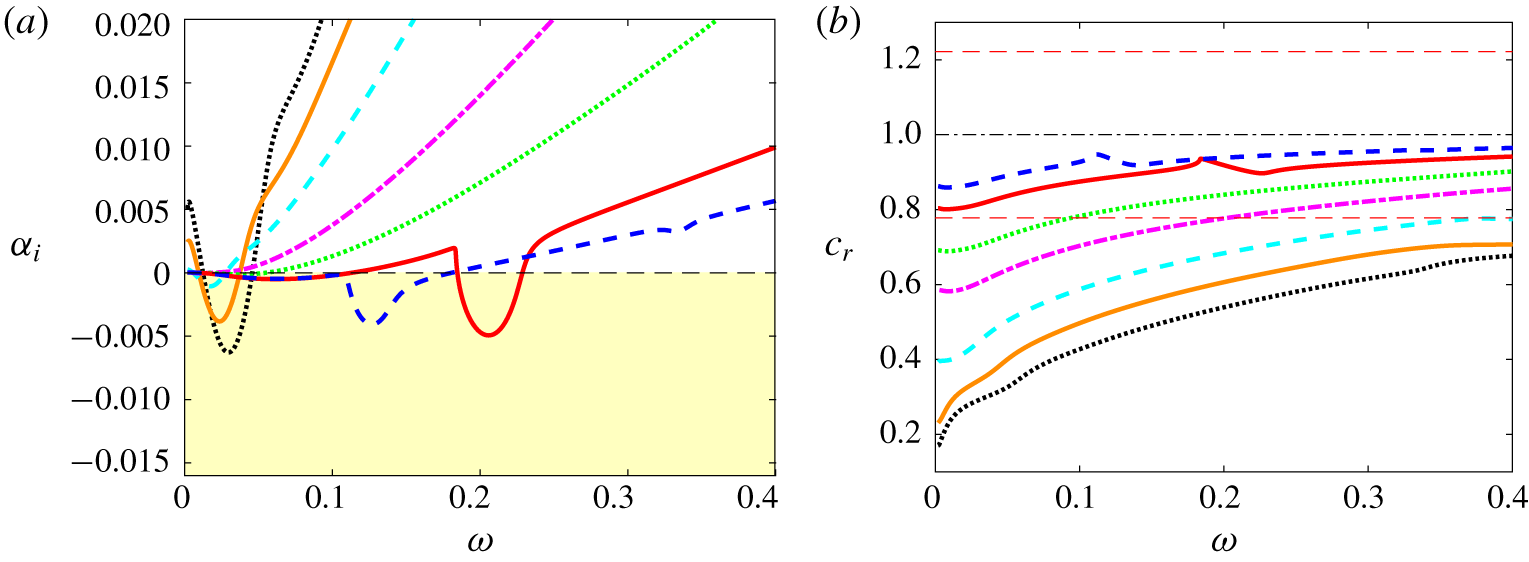
Influence of Mach number for perfect gas at  $Re=2000$: growth rate (a) and phase speed (b). Line legend as in table 2. In (b), the horizontal dash-dotted line marks the location of the vorticity/entropy branch and the dashed lines above and below indicate the fast and slow acoustic branches at
 $M_{\infty }=4.5$, respectively.

4.2 Validation and terminology
For the purpose of validation and to introduce the terminology used in the later sections, we briefly present the LST results of the  $M_{\infty }=4.5$ and
 $Re=2000$ case that has been thoroughly studied by Ma & Zhong (Reference Ma and Zhong2003). The computed growth rate and phase speed (continuous lines in figure 5) are in very good agreement with the results reported by Ma & Zhong (Reference Ma and Zhong2003) (symbols). For the terminology, we follow Fedorov & Tumin (Reference Fedorov and Tumin2011) and Ma & Zhong (Reference Ma and Zhong2003). A slow mode
 $S$ (respectively, a fast mode
 $F$) is a mode having a phase speed equal to the one of the slow (respectively, fast) acoustic mode at zero frequency, namely
 $c_{\unicode[STIX]{x1D711}}=1-1/M_{\infty }$ (respectively,
 $c_{\unicode[STIX]{x1D711}}=1+1/M_{\infty }$). In figure 5, a first region of instability, with a maximum growth rate of approximately -5 × 10⁻⁴ for
 $\unicode[STIX]{x1D714}\approx 0.06$, corresponds to the first mode (extension of the TS mode). A second region, with a negative peak at
 $\unicode[STIX]{x1D714}\approx 0.2$ and a growth rate 10 times greater, is associated with the second mode (or Mack mode I). Both are associated with the slow mode
 $S$, meaning that they arise from the same eigenvalue. This mode remains subsonic and its phase velocity increases with
 $\unicode[STIX]{x1D714}$ (figure 5b). The fast mode
 $F_{1}$ has a decreasing phase speed; it first crosses the vorticity/entropy branch, characterized by a unitary phase speed, then crosses the slow mode, leading to the synchronization of the modes (
 $\unicode[STIX]{x1D6FC}_{r,S}=\unicode[STIX]{x1D6FC}_{r,F}$) as described by Fedorov & Khokhlov (Reference Fedorov and Khokhlov2001) and Fedorov & Tumin (Reference Fedorov and Tumin2011). During this phase, the slow mode is strongly destabilized and the fast mode is conversely stabilized. This leads to the emergence of the Mack mode, which is qualified as an acoustic mode since trapped acoustic waves are reflected between the wall and the sonic line
 $\widetilde{M}=-1$, where
 $\widetilde{M}=(u-c_{\unicode[STIX]{x1D711}})/a$ is the relative Mach number (
 $a$ being the sound speed). Higher-order Mack (acoustic) modes are stable and would correspond to the synchronization with the fast modes labelled
 $F_{2}$,
 $F_{3}$ and
 $F_{4}$ in figure 5.
4.3 Influence of the Mach number on LST
LST calculations at  $Re=2000$ for 2-D waves (
 $\unicode[STIX]{x1D6FD}=0$) are shown in figures 6 and 7 for the various conditions given in tables 2 and 3, respectively. First, for air, only unstable modes pertaining to the mode
 $S$ are found and are the only ones reported in figure 6. For
 $M_{\infty }$ up to 3, a single unstable region is found in the low-frequency band relevant to the first-mode instability. At
 $M_{\infty }=0.5$, the viscous TS mode is close to what is expected in the incompressible limit. As
 $M_{\infty }$ is increased up to 2.25, the viscous mode is substantially stabilized and the frequency of maximum amplification diminishes. At
 $M_{\infty }=3$, an inversion in the behaviour occurs due to the influence of the generalized inflection point, namely the frequency of the most unstable mode rises slightly and its amplification rate starts increasing. The growth rate remains nonetheless more than one order of magnitude smaller than in the incompressible regime. The
 $M_{\infty }=4.5$ and
 $M_{\infty }=6$ cases both exhibit low-frequency instability of the first mode and instability of the second mode in a higher frequency band. At
 $M_{\infty }=6$, both the frequency and growth rate are reduced for the second mode with respect to
 $M_{\infty }=4.5$, and a higher stable mode (third mode or Mack’s mode II) starts emerging at
 $\unicode[STIX]{x1D714}\approx 0.34$. The phase speed (reported in figure 6b) increases with both
 $M_{\infty }$ and
 $\unicode[STIX]{x1D714}$ and it exhibits the slow-mode features within the limits of the acoustic (
 $c_{r}=1-1/M_{\infty }$) and vorticity/entropy (
 $c_{r}=1$) branches. The changes of slope in the frequency band [0.18–0.23] and [0.11–0.14] correspond to the synchronization with the fast mode (not reported in figure 6b) at
 $M_{\infty }=4.5$ and
 $M_{\infty }=6$, respectively.
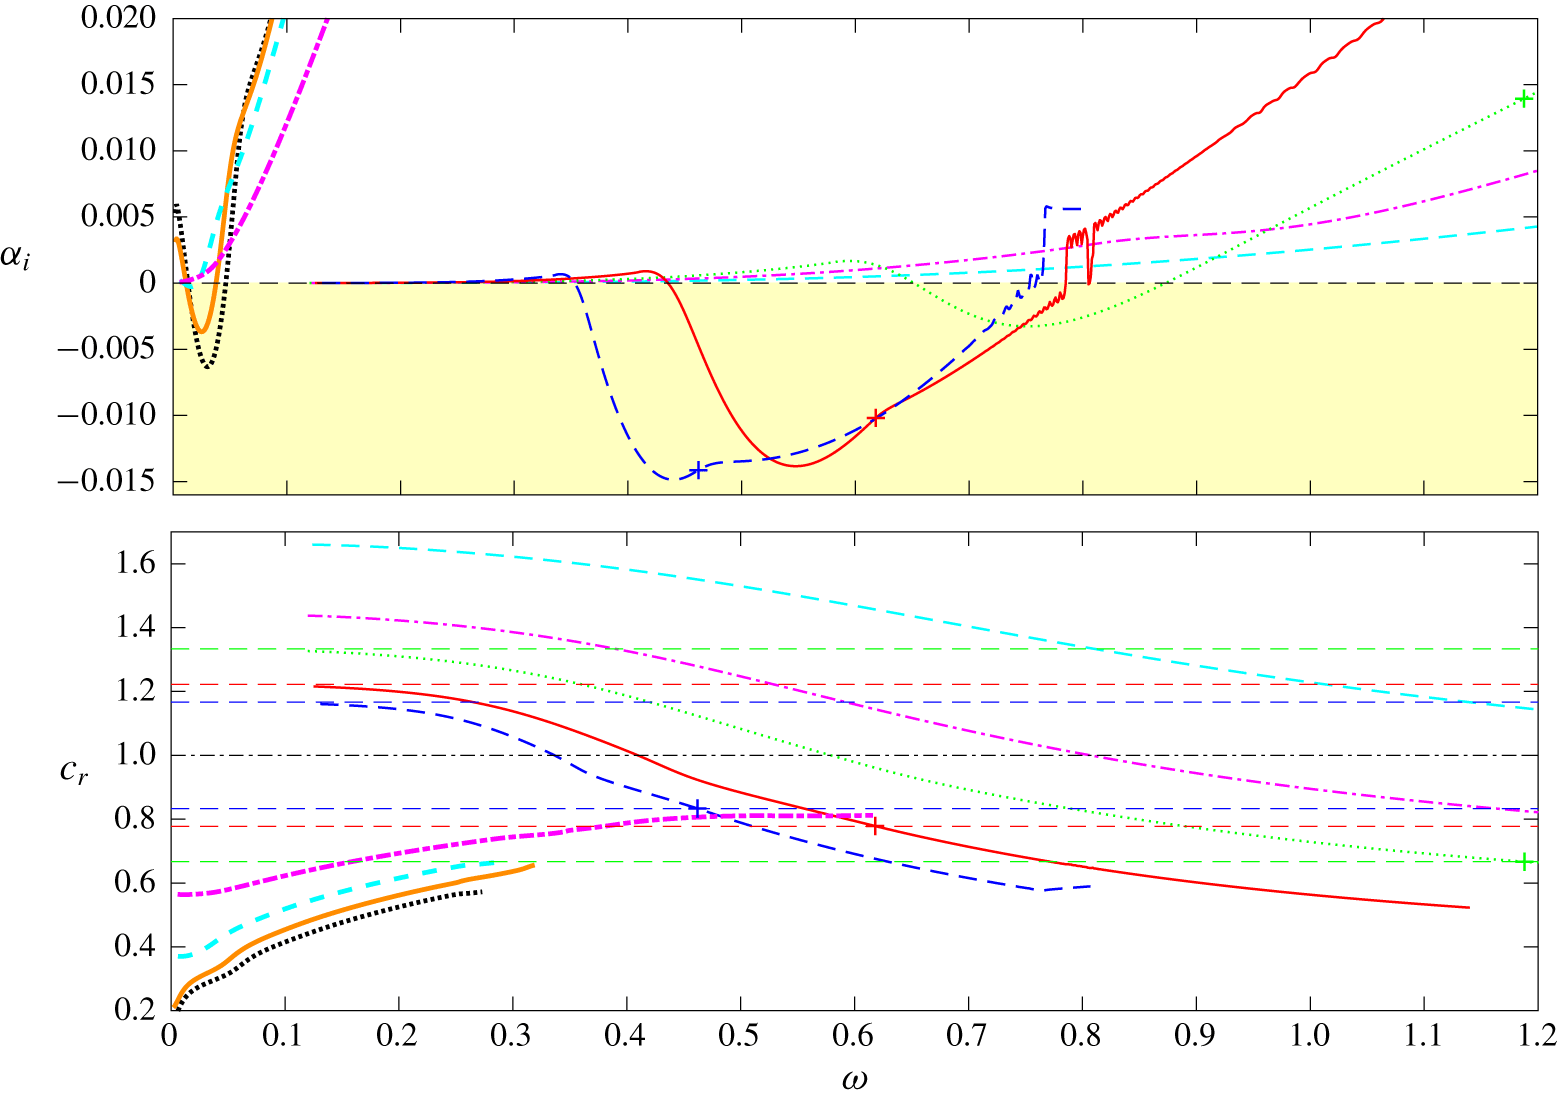
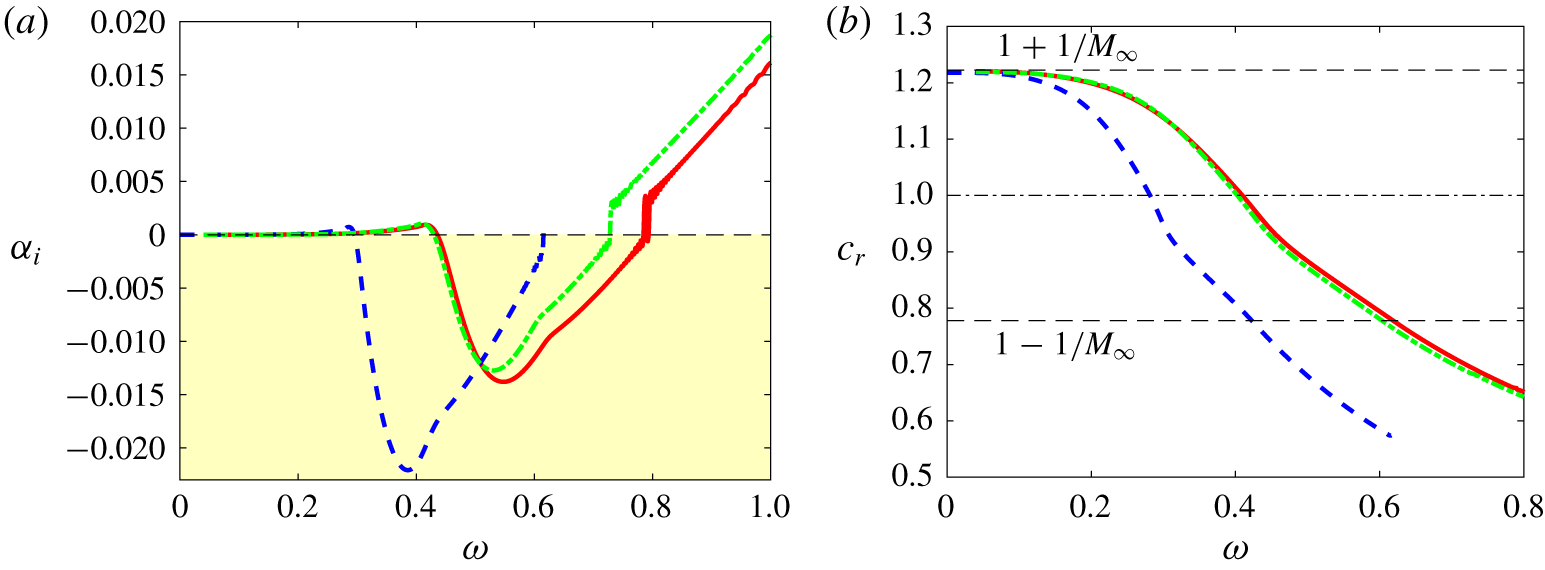
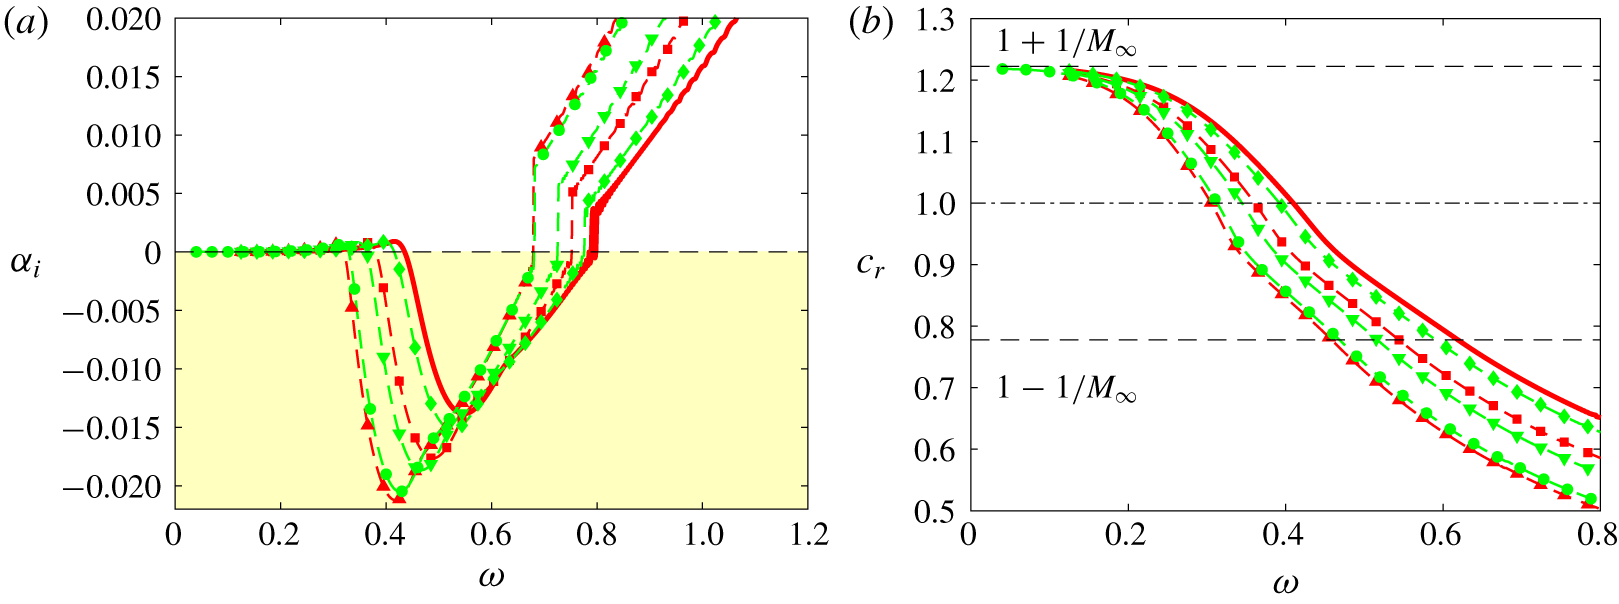
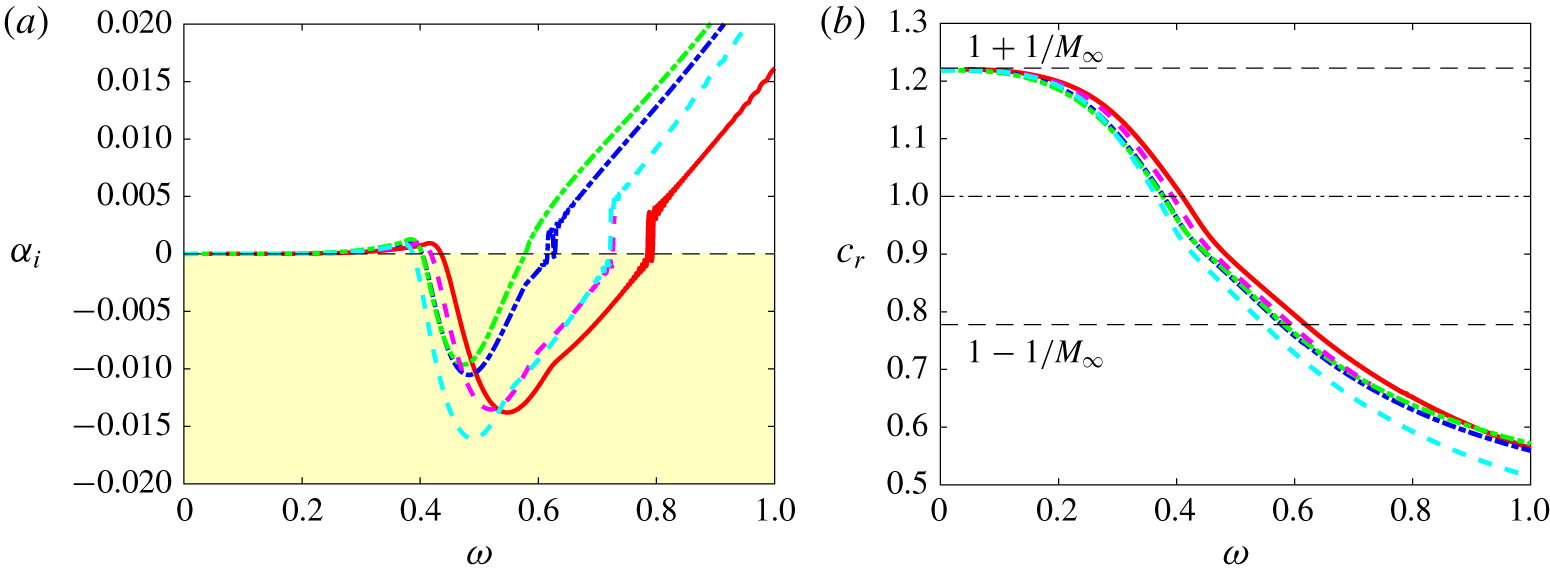
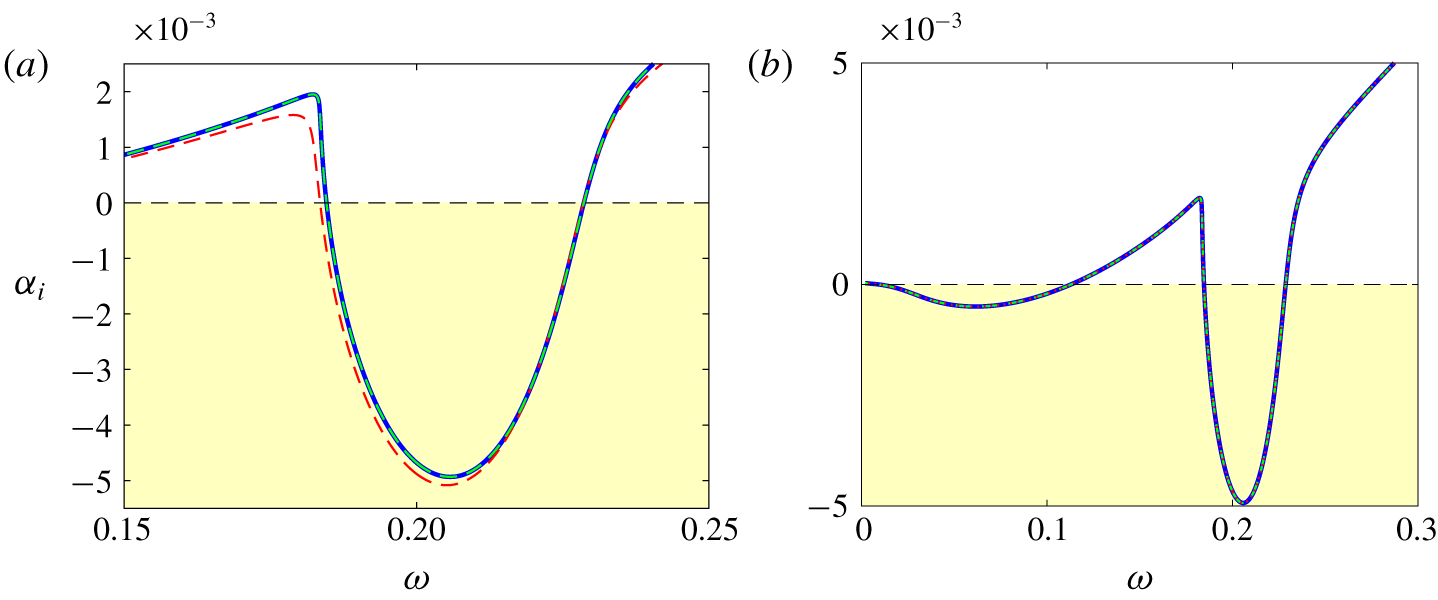
The results for the dense gas are reported in figure 7. It is interesting to observe that the unstable slow mode emerging for  $0.5<M_{\infty }<1.5$ has a very similar behaviour to the perfect-gas case (see also figures 8a and 9a, where a close-up view of the growth rate is provided). This mode then undergoes strong stabilization due to the compressibility effects and the suppression of the generalized inflection point (see figure 4b). The first mode is stable for 2-D waves at
 $M_{\infty }=2.25$, and the mode
 $S$ is therefore not plotted for higher Mach numbers. A new unstable region arises for
 $M_{\infty }>2.25$ in a significantly higher frequency band and comes from destabilization of the fast mode
 $F$ (plotted with thin lines for
 $1.5<M_{\infty }<6$). Its maximum amplification increases with
 $M_{\infty }$ and the peak frequency shifts towards lower values (
 $\unicode[STIX]{x1D714}_{peak}=0.75$, 0.55, 0.44 for
 $M_{\infty }=3$, 4.5, 6). At
 $M_{\infty }=4.5$ and 6, the amplification curves exhibit a kink (indicated by a + symbol in figure 7), at which the decreasing phase speed reaches the value
 $c_{r}=1-1/M_{\infty }$, meaning that the wave travels supersonically relative to the free stream. These features are typical of the so-called supersonic mode (Bitter & Shepherd Reference Bitter and Shepherd2015; Mortensen Reference Mortensen2018; Knisely & Zhong Reference Knisely and Zhong2019a). It is worth pointing out that this mode emerges in a frequency range well above the slow-mode one (which is not the case for the first and second perfect-gas modes). Discontinuities and oscillations are visible as the mode becomes stable; their origin is discussed later in relation to figure 10.
Influence of Mach number for dense gas PP11 at  $Re=2000$: growth rate (a) and phase speed (b). Line legend as in table 3. In (b), the horizontal dash-dotted line marks the location of the vorticity/entropy branch and the dashed lines above and below indicate the fast and slow acoustic branches, respectively, at
 $M_{\infty }=3$, 4.5 and 6. For high Mach numbers, a + sign indicates the location where
 $c_{r}=1-1/M_{\infty }$.

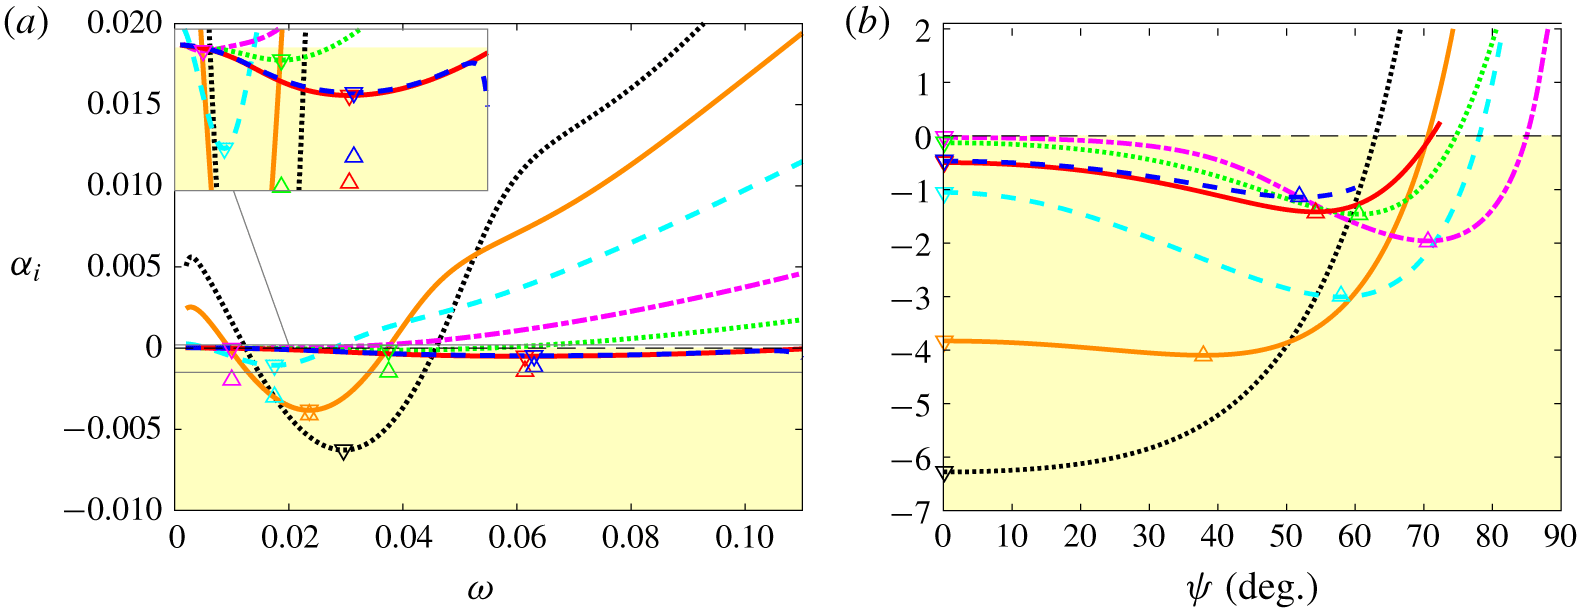
Influence of Mach number for a perfect gas at  $Re=2000$: growth rate of first mode as a function of non-dimensional frequency
 $\unicode[STIX]{x1D714}$ for
 $\unicode[STIX]{x1D6F9}=0$ (a) and as a function of wave angle
 $\unicode[STIX]{x1D6F9}$ at the frequency of maximal 2-D growth rate (b). Here
 $\unicode[STIX]{x1D714}=0.0296$ for
 $M_{\infty }=0.5$;
 $\unicode[STIX]{x1D714}=0.0236$ for
 $M_{\infty }=1$;
 $\unicode[STIX]{x1D714}=0.0175$ for
 $M_{\infty }=1.5$;
 $\unicode[STIX]{x1D714}=0.01$ for
 $M_{\infty }=2.25$;
 $\unicode[STIX]{x1D714}=0.0375$ for
 $M_{\infty }=3$;
 $\unicode[STIX]{x1D714}=0.0614$ for
 $M_{\infty }=4.5$; and
 $\unicode[STIX]{x1D714}=0.0630$ for
 $M_{\infty }=6$. Line legend as in table 2. Symbols ▿ mark the most unstable 2-D modes, if one exists, and ▵ the most unstable 3-D waves, if one exists.

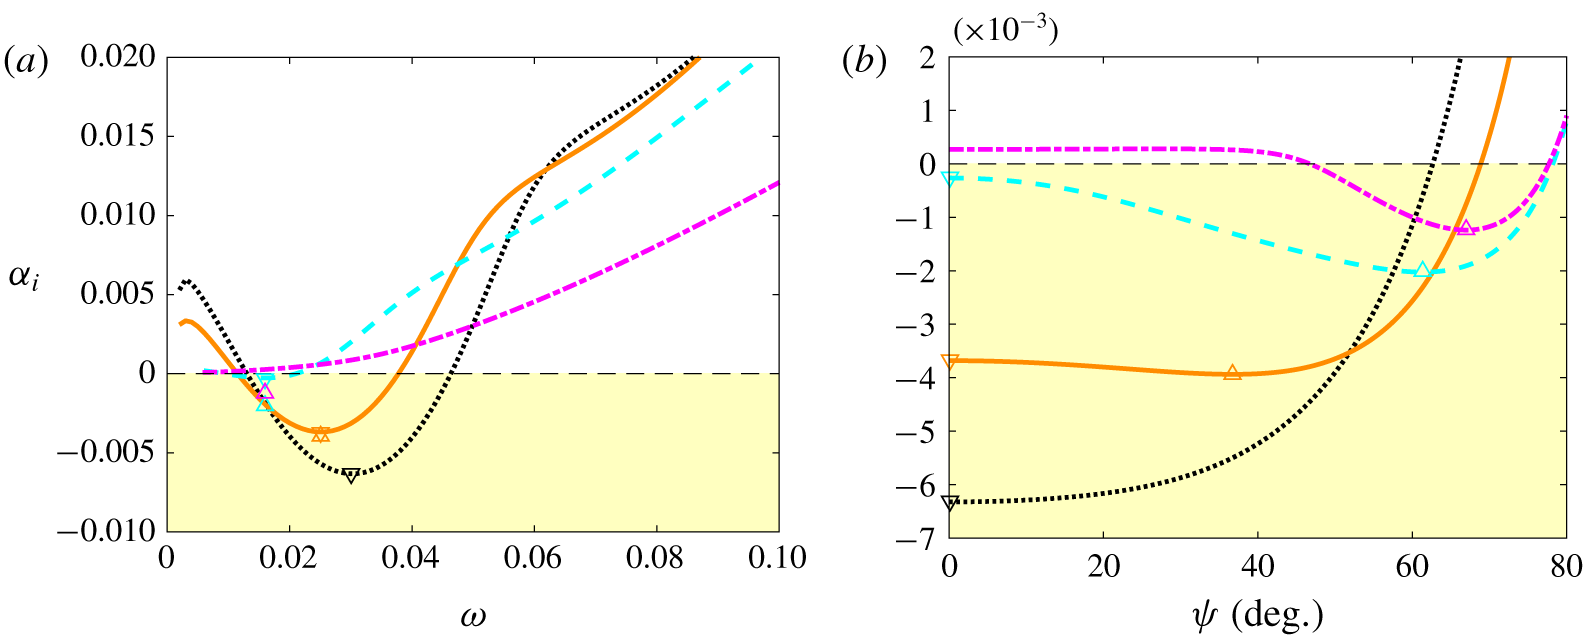
Influence of Mach number for a dense gas at  $Re=2000$: growth rate of first mode as a function of non-dimensional frequency
 $\unicode[STIX]{x1D714}$ for
 $\unicode[STIX]{x1D6F9}=0$ (a) and as a function of wave angle
 $\unicode[STIX]{x1D6F9}$ at the frequency of maximal 2-D growth rate (b). Here
 $\unicode[STIX]{x1D714}=0.03$ for
 $M_{\infty }=0.5$;
 $\unicode[STIX]{x1D714}=0.025$ for
 $M_{\infty }=1$;
 $\unicode[STIX]{x1D714}$=0.016 for
 $M_{\infty }=1.5$; and
 $\unicode[STIX]{x1D714}=0.016$ for
 $M_{\infty }=2.25$. Line legend as in table 3. Symbols ▿ mark the most unstable 2-D modes, if one exists, and ▵ the most unstable 3-D waves, if one exists.

We now discuss in more detail the characteristics of the first mode. In the compressible regime, it is well known that there is a preference for ‘more subsonic’ skewed waves (Dunn & Lin Reference Dunn and Lin1955), i.e. 3-D waves with non-zero spanwise wavenumber  $\unicode[STIX]{x1D6FD}=\unicode[STIX]{x1D6FC}_{r}\tan \unicode[STIX]{x1D6F9}$ (
 $\unicode[STIX]{x1D6F9}$ being the wave angle). Figures 8 and 9 show close-up views of the growth rate in the low-frequency range and its evolution with
 $\unicode[STIX]{x1D6F9}$ at the peak frequency for both perfect gas and dense gas at various Mach numbers. At
 $M_{\infty }=0.5$ and 1, the mode exhibits a similar behaviour in terms of amplification rate and frequency range for air and PP11. The 2-D wave is still the most unstable at the lowest Mach number, whereas the maximum amplifications arise at
 $\unicode[STIX]{x1D6F9}=37.8^{\circ }$ for air and at
 $\unicode[STIX]{x1D6F9}=36.8^{\circ }$ for PP11 at
 $M_{\infty }=1$ (with values close to that of the 2-D waves). At
 $M_{\infty }=1.5$, the 2-D wave is significantly stabilized by compressibility and a highly skewed wave is promoted at
 $\unicode[STIX]{x1D6F9}=58^{\circ }$ for air and at
 $\unicode[STIX]{x1D6F9}=61.4^{\circ }$ for PP11. The behaviour of the dense gas departs from that of a perfect gas at
 $M_{\infty }=2.25$. For air, the mode is weakly unstable in two dimensions and is substantially amplified for highly skewed waves (
 $\unicode[STIX]{x1D6F9}_{max}\approx 70.6^{\circ }$). As the Mach number is further increased, the inviscid mechanism becomes relevant and the rise in the peak frequency is accompanied by a slight decrease of the wave angle (
 $\unicode[STIX]{x1D6F9}_{max}=60.6^{\circ }$, 54. 2° and 51. 8° for
 $M_{\infty }=3$, 4.5 and 6, respectively). For PP11 at
 $M_{\infty }=2.25$, the 2-D wave is stable and an unstable 3-D wave is found to occur for
 $\unicode[STIX]{x1D714}=0.016$ and
 $\unicode[STIX]{x1D6F9}=67^{\circ }$. No unstable 3-D waves have been found at
 $M_{\infty }=3$ and higher.
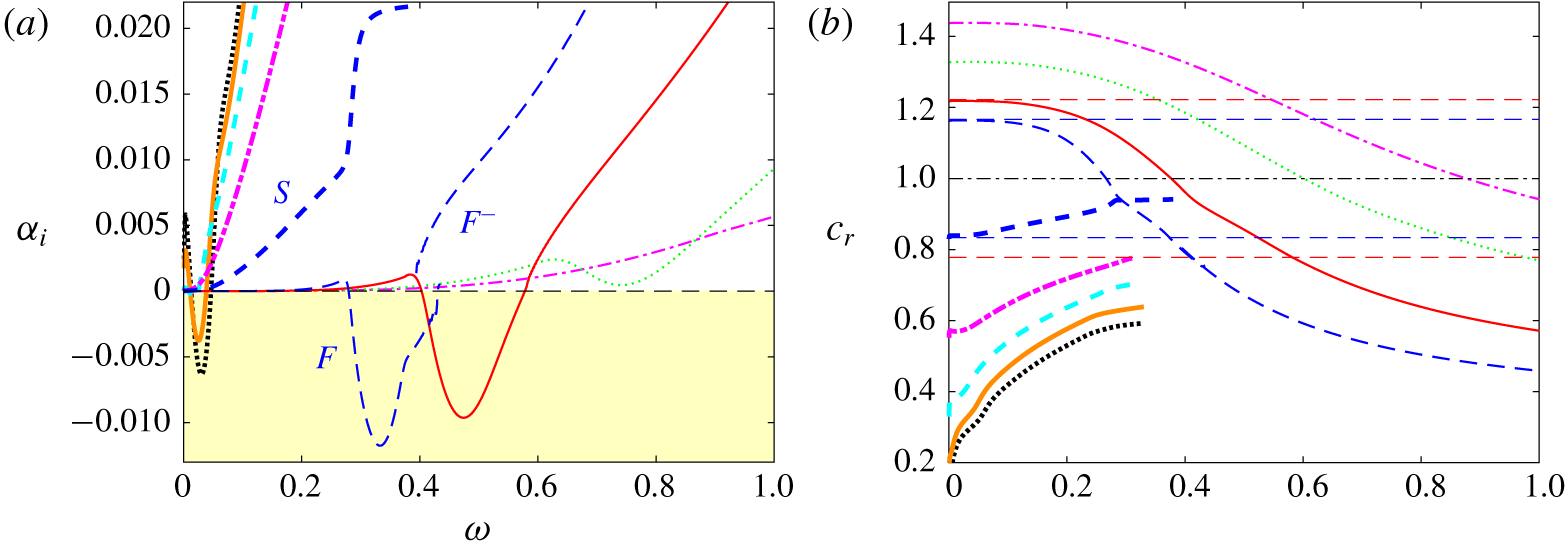
The supersonic mode that emerges in the dense-gas case is most unstable for 2-D non-skewed waves, similar to the Mack modes. We therefore focus on the 2-D case at  $M_{\infty }=4.5$ and
 $Re=2000$. Figure 10 shows the slow mode
 $S$ and the two first fast modes
 $F_{1}$ and
 $F_{2}$. The mode
 $S$ is stable and rapidly damped as the frequency increases. The change of slope of its phase speed for frequencies at which the supersonic mode becomes unstable (figure 10b) is an indication of the synchronization phenomenon with the fast mode
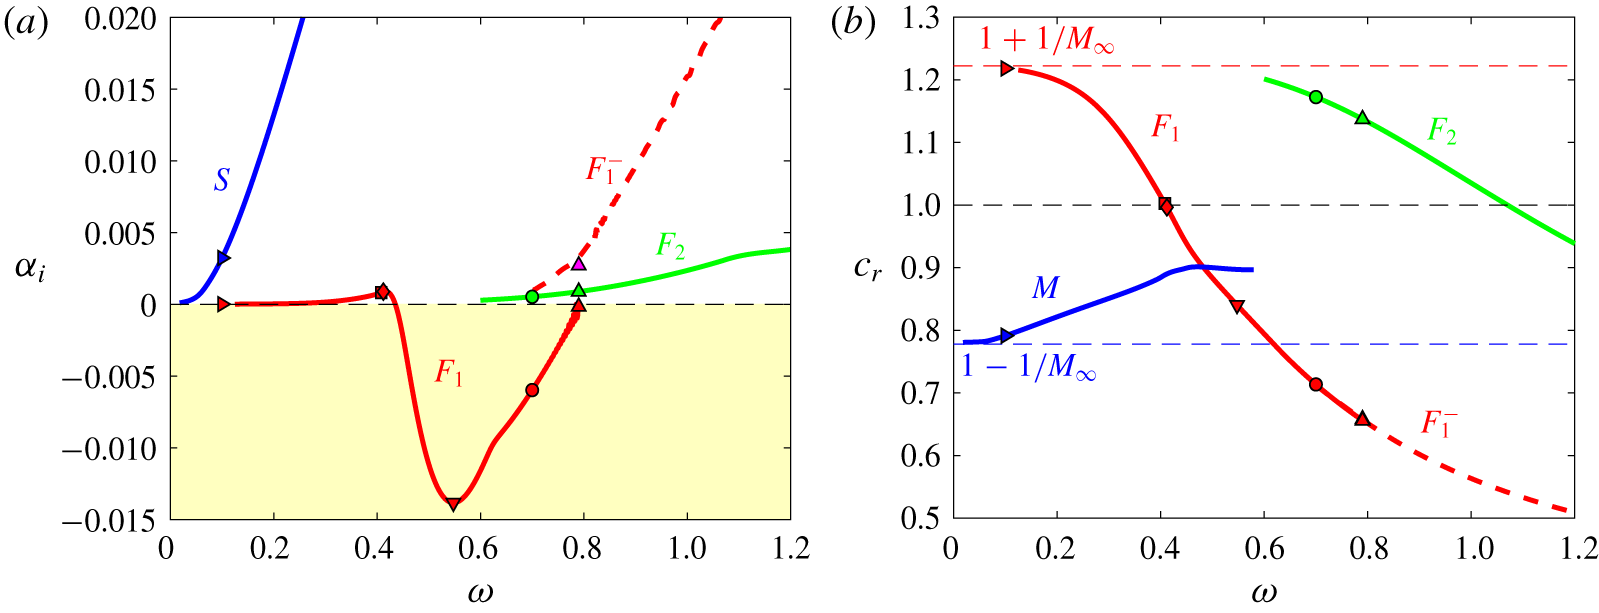
 $F_{1}$ (Fedorov & Tumin Reference Fedorov and Tumin2011). The latter becomes most unstable at
 $\unicode[STIX]{x1D714}\approx 0.55$, which is significantly higher than the Mack mode (
 $\unicode[STIX]{x1D714}\approx 0.2$ in figure 5). As the mode stabilizes, peculiar results are observed, associated with the crossing of the acoustic branch. This kind of behaviour has already been found in the literature for supersonic modes in air and interpreted as the emergence of a new mode (generally referred to as
 $F_{1}^{-}$, for example in Bitter & Shepherd (Reference Bitter and Shepherd2015) or Knisely & Zhong (Reference Knisely and Zhong2019b)). Figure 10 also shows that mode
 $F_{2}$ appears at a much higher frequency than in the ideal-gas case.
LST for a dense gas at  $M=4.5$ and
 $Re=2000$: growth rate (a) and phase speed (b) of the slow mode
 $S$ (blue ——) and the fast modes
 $F_{1}$ (red ——),
 $F_{1}^{-}$ (red – – –) and
 $F_{2}$ (green ——). Frequencies, for which eigenvalue spectra are given in figure 11, are marked by symbols.

The LST for a dense gas at  $M=4.5$ and
 $Re=2000$: map of real and imaginary parts of phase speeds in the complex plane (top right) and selected eigenvalue spectra for frequencies
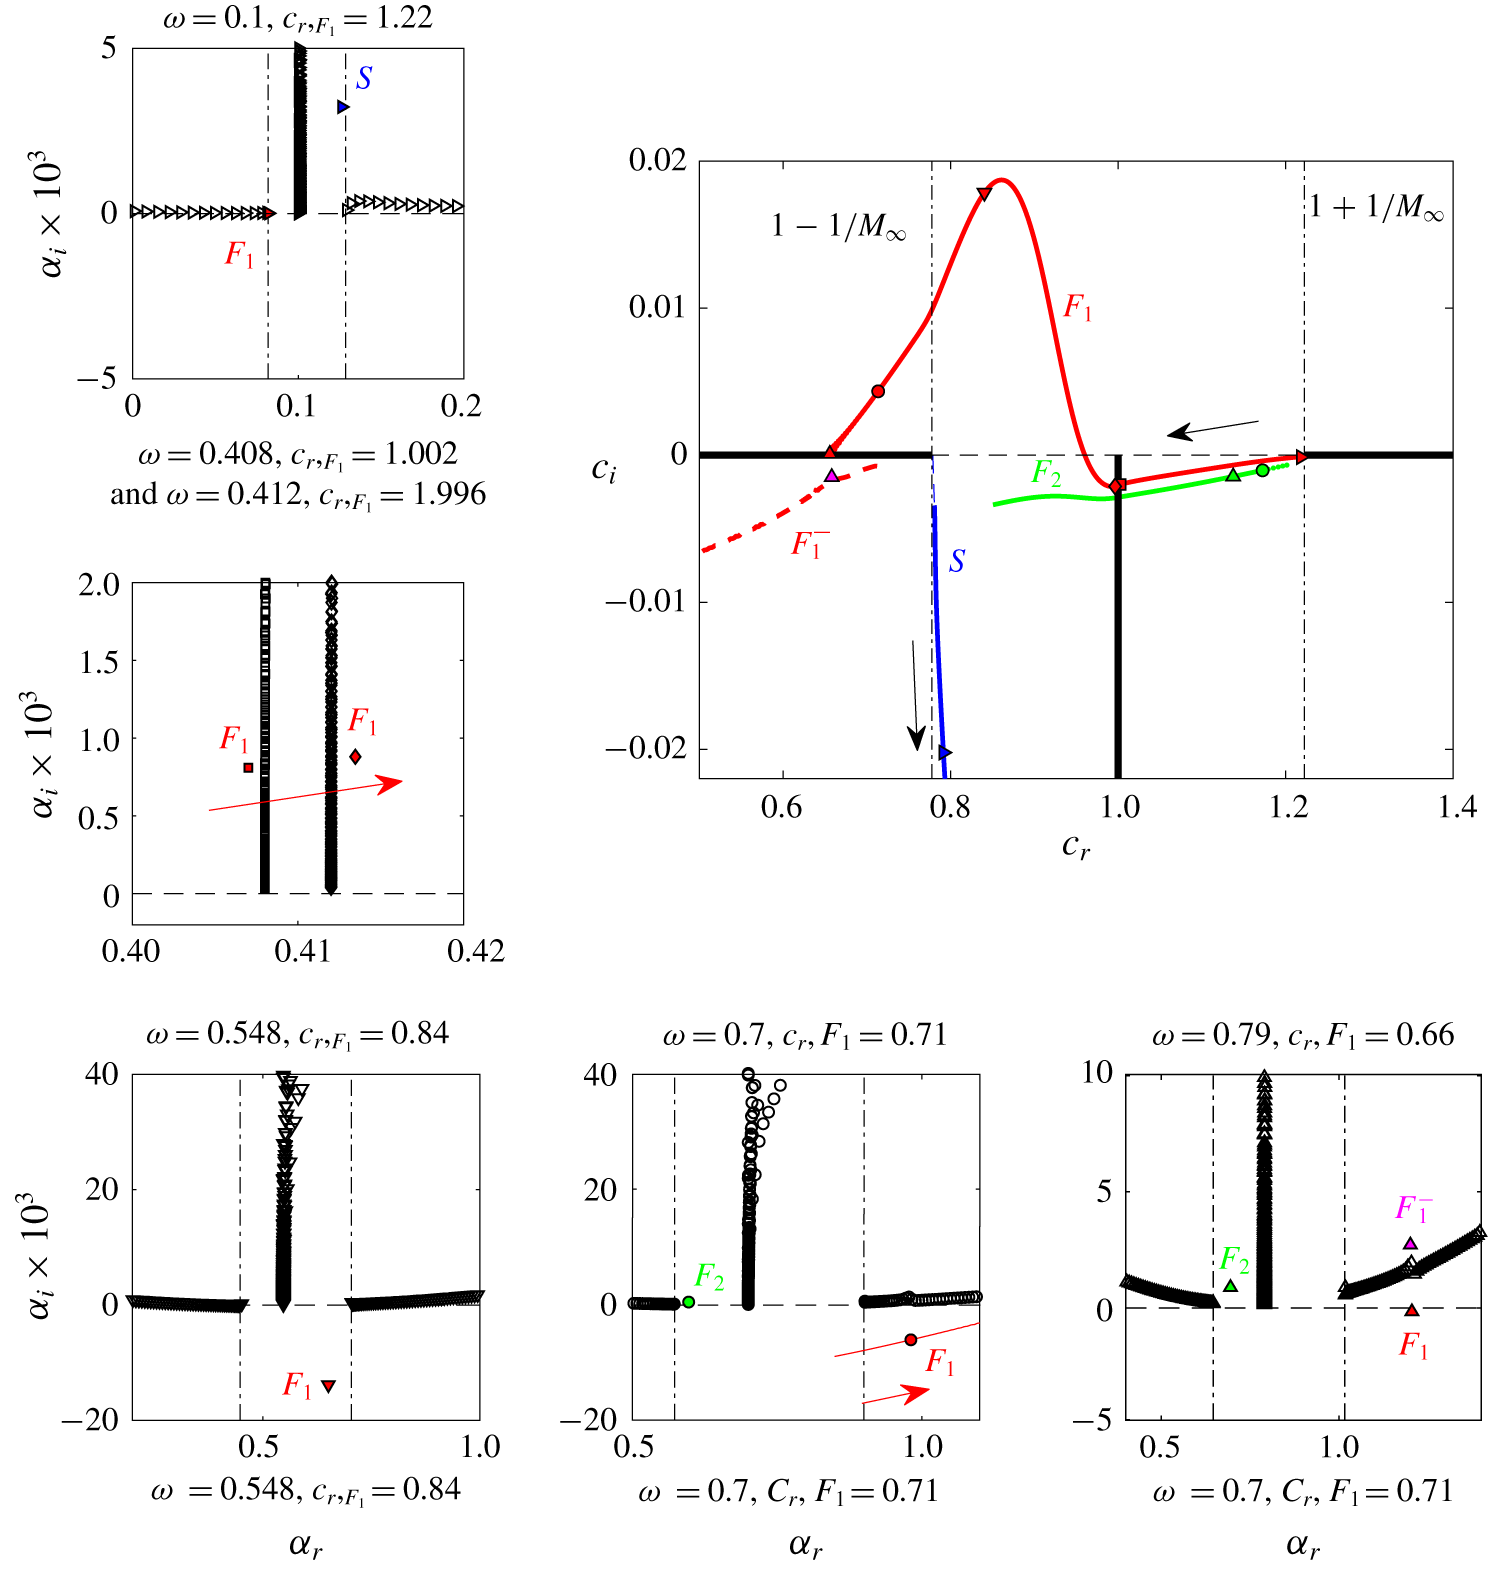
 $\unicode[STIX]{x1D714}=0.1$ (▹), 0.408 (▫) / 0.412 (♢), 0.5475 (▿), 0.7 (○) and 0.79 (▵). Coloured filled symbols denote labelled modes, which are also plotted in the phase speed map. Arrows indicate the direction of increasing frequencies
 $\unicode[STIX]{x1D714}$.

To further highlight the behaviour of modes  $S$,
 $F_{1}$ and
 $F_{2}$, we examine the eigenvalue spectra, reported in figure 11 for selected frequencies (corresponding to the values marked with symbols in figure 10). In figure 11, a map of the real and imaginary parts of the phase speed is also provided to help the interpretation. In the eigenvalue spectra, the two nearly horizontal lines of symbols represent the fast (on the left) and the slow (on the right) acoustic wave modes. These continuous branches originate from the phase velocities
 $c_{\unicode[STIX]{x1D711}}=1\pm 1/M_{\infty }$, marked by vertical dash-dotted lines (Balakumar & Malik Reference Balakumar and Malik1992). The vertical lines of symbols indicate the continuous vorticity and entropy spectra (
 $c_{\unicode[STIX]{x1D711}}=1$). At the lowest frequency (
 $\unicode[STIX]{x1D714}=0.1$), the two discrete modes
 $S$ and
 $F_{1}$ emerge from the slow and fast acoustic branches, respectively. The slow mode is already strongly damped and is seen to rapidly exit the wave-speed complex map as the frequency increases. It is therefore no longer visible in the panels corresponding to the higher-frequency spectra. A first synchronization arises as the stable fast mode crosses the vorticity/entropy waves of the continuous spectrum. It is illustrated in the second spectrum for frequencies just before (0.408) and after (0.412) the cross-over. This is accompanied by a small jump in the imaginary part
 $c_{i}$ (not visible at the scale of the plot), which corresponds to a substantial change of the eigenfunctions (Fedorov & Tumin Reference Fedorov and Tumin2011) and is not further discussed for the purpose of the present paper. For
 $\unicode[STIX]{x1D714}\approx 0.55$, the first fast mode is unstable and close to its maximum amplification rate.
As the frequency increases, the relative phase speed becomes supersonic, as it crosses the line  $1-1/M_{\infty }$, at
 $\unicode[STIX]{x1D714}\approx 0.63$. At
 $\unicode[STIX]{x1D714}=0.7$, the second fast mode
 $F_{2}$ emerges from the fast acoustic branch and the mode
 $F_{1}$, located under the slow acoustic branch, has to cross this branch to stabilize. The results indicate that
 $F_{1}$ merges with the slow acoustic spectrum. The new discrete mode
 $F_{1}^{-}$ that emerges in the stable half-plane is visible in the spectrum at
 $\unicode[STIX]{x1D714}=0.79$ and was already observed in previous studies about the supersonic mode in air (Bitter & Shepherd Reference Bitter and Shepherd2015; Knisely & Zhong Reference Knisely and Zhong2019b). The eigenfunctions of
 $F_{1}$ and
 $F_{1}^{-}$ in the vicinity of the acoustic branch are similar within the boundary layer and are strongly oscillatory outside. Their very slow damping in the free stream makes their calculation very sensitive to numerical parameters, since an eigenvalue problem with Dirichlet free-stream boundary conditions is solved. Some authors (Bitter Reference Bitter2015; Chen, Boldini & Song Reference Chen, Boldini and Song2019) suggest to improve the calculation by using less restrictive boundary conditions in which the disturbances only remain bounded at infinity. The treatment of the acoustic branch cut in an eigenvalue problem remains tricky to interpret and an initial-value problem based on parabolized stability equations (Han, Liu & Luo Reference Han, Liu, Luo and Floryan2016) or DNS (see next section) can help to clarify this peculiar behaviour. Such calculations can be used to choose the proper solution. Although interesting from receptivity studies, the behaviour in the stable region is beyond the scope of the present investigation and will not be discussed any further.
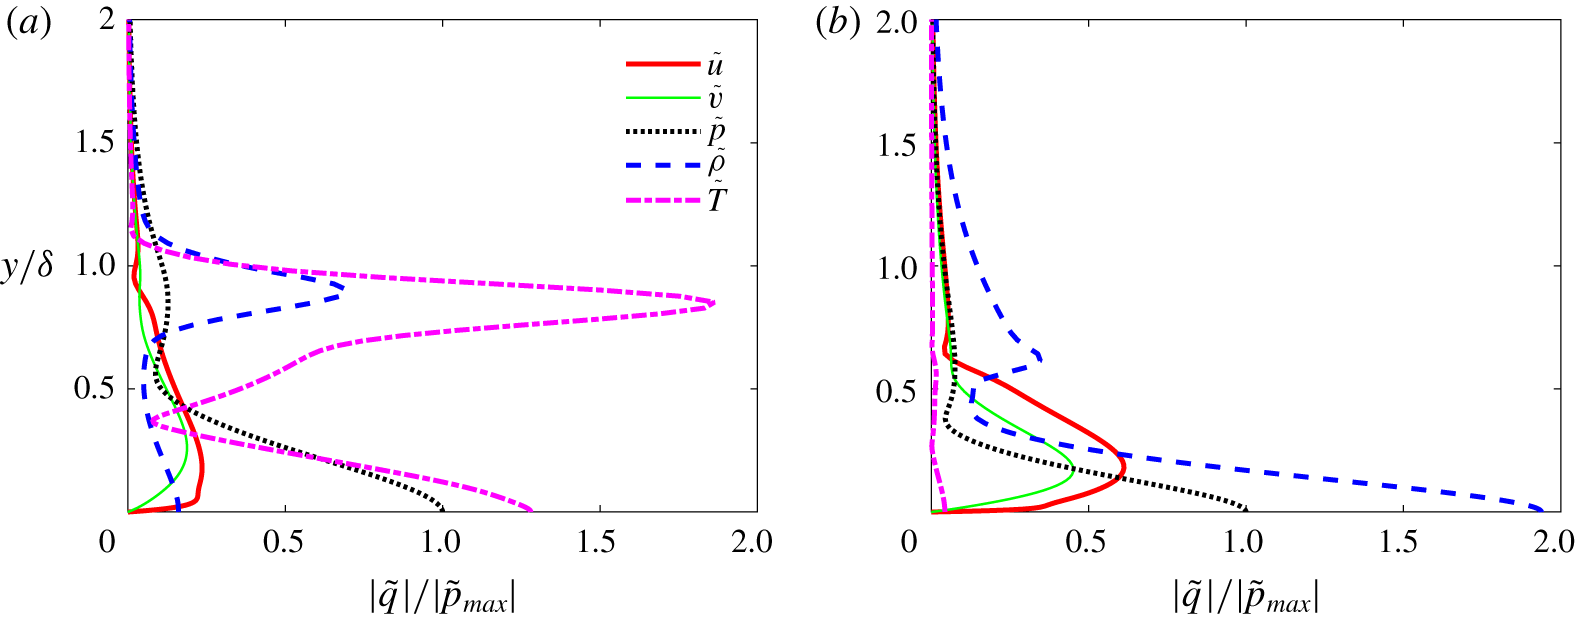
In figure 12, eigenfunctions corresponding to the most amplified supersonic mode at  $M=4.5$ and
 $Re=2000$ (figure 12a) are compared to those obtained for the most amplified Mack mode of the perfect-gas case (figure 12b). In both cases, the eigenfunctions, normalized by the pressure amplitude at the wall, are dominated by fluctuations in thermodynamic variables, namely the temperature disturbances for the perfect-gas flow and the density disturbances for the dense-gas flow. It is worth noting that density is correlated with pressure in the dense-gas case, whereas temperature and pressure are correlated in the perfect-gas case, which is dictated by the underlying equation of state (as demonstrated in Sciacovelli et al. (Reference Sciacovelli, Cinnella and Gloerfelt2017a)). The high specific capacity of the dense gas also yields weak temperature fluctuations.
Eigenfunctions normalized by the amplitude of the pressure perturbation of the most amplified waves at  $M=4.5$ and
 $Re=2000$: perfect-gas second mode at
 $\unicode[STIX]{x1D714}=0.2058$ (a) and dense-gas supersonic mode at
 $\unicode[STIX]{x1D714}=0.5475$ (b).

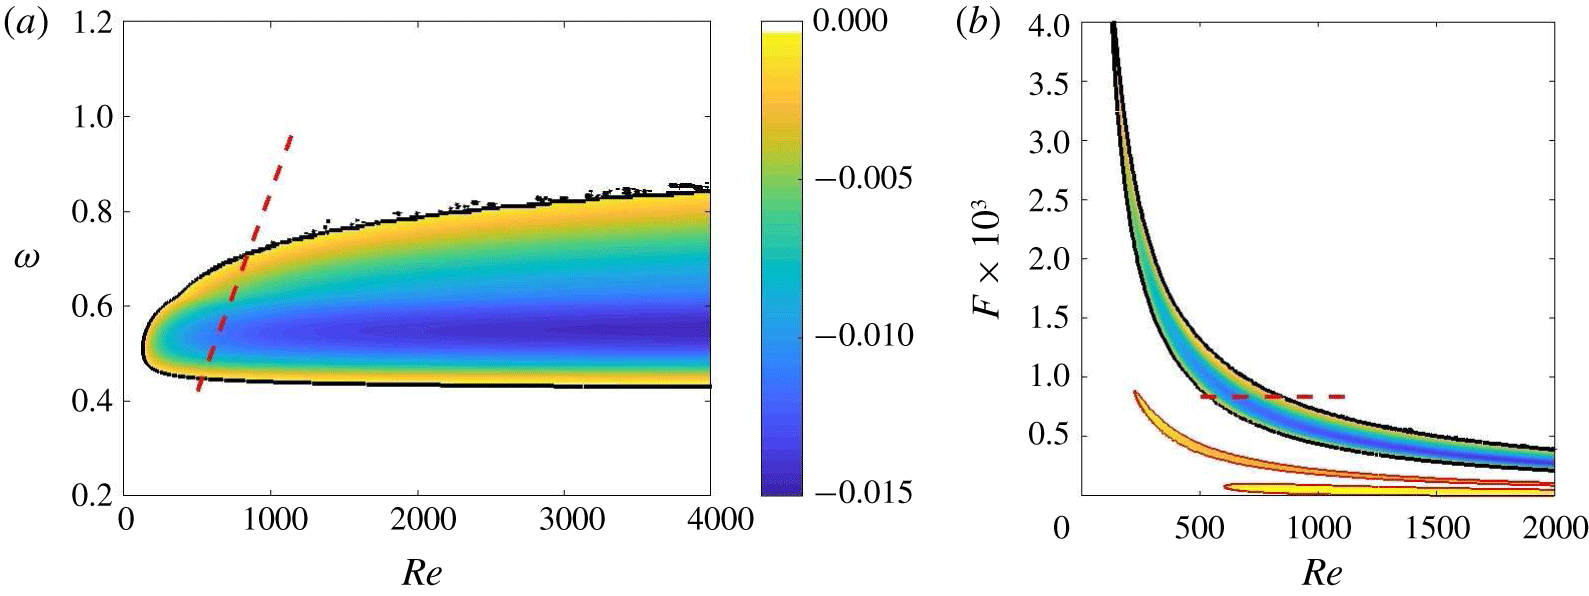
Finally, the Reynolds-number dependence of the amplified 2-D waves is shown for  $M_{\infty }=4.5$ in figure 13(a). The map is bounded by the neutral curve. The oscillations visible on the upper branch are due to the crossing of the slow acoustic branch. Figure 13(a) shows a critical Reynolds number
 $Re\approx 200$ and, for large values of
 $Re$, the neutral stability points become nearly independent of
 $\unicode[STIX]{x1D714}$, underlining the essentially inviscid character of the supersonic mode. The qualitative characteristics of the mode do not change for
 $Re$ between 500 and 10 000. The comparison with neutral curves obtained for air in the
 $F{-}Re$ map of figure 13(b) gives an overview of the differences in frequency and amplitude of the unstable modes.
Maps of 2-D amplification rate  $\unicode[STIX]{x1D6FC}_{i}$ for dense gas at
 $M_{\infty }=4.5$ generated using the LST code:
 $\unicode[STIX]{x1D714}{-}Re$ (a) and
 $F{-}Re$ representation (b), where neutral curves of the first and second modes for a perfect gas in the same conditions are superimposed with thin red lines and the same colour scale for
 $\unicode[STIX]{x1D6FC}_{i}$. The black contour represents the neutral curve and the dashed red line indicates the path followed in the DNS computational domain, described in § 4.4.

4.4 Numerical simulation of the supersonic mode
In this section, we discuss some results of DNS of the supersonic mode for the dense gas PP11 at  $M_{\infty }=4.5$. The aim is multi-fold: (i) to address the parallel base flow assumption of LST; (ii) to shed some light on the peculiar behaviour of the mode when crossing the acoustic branch; and (iii) to analyse the spontaneous radiation of instability waves.
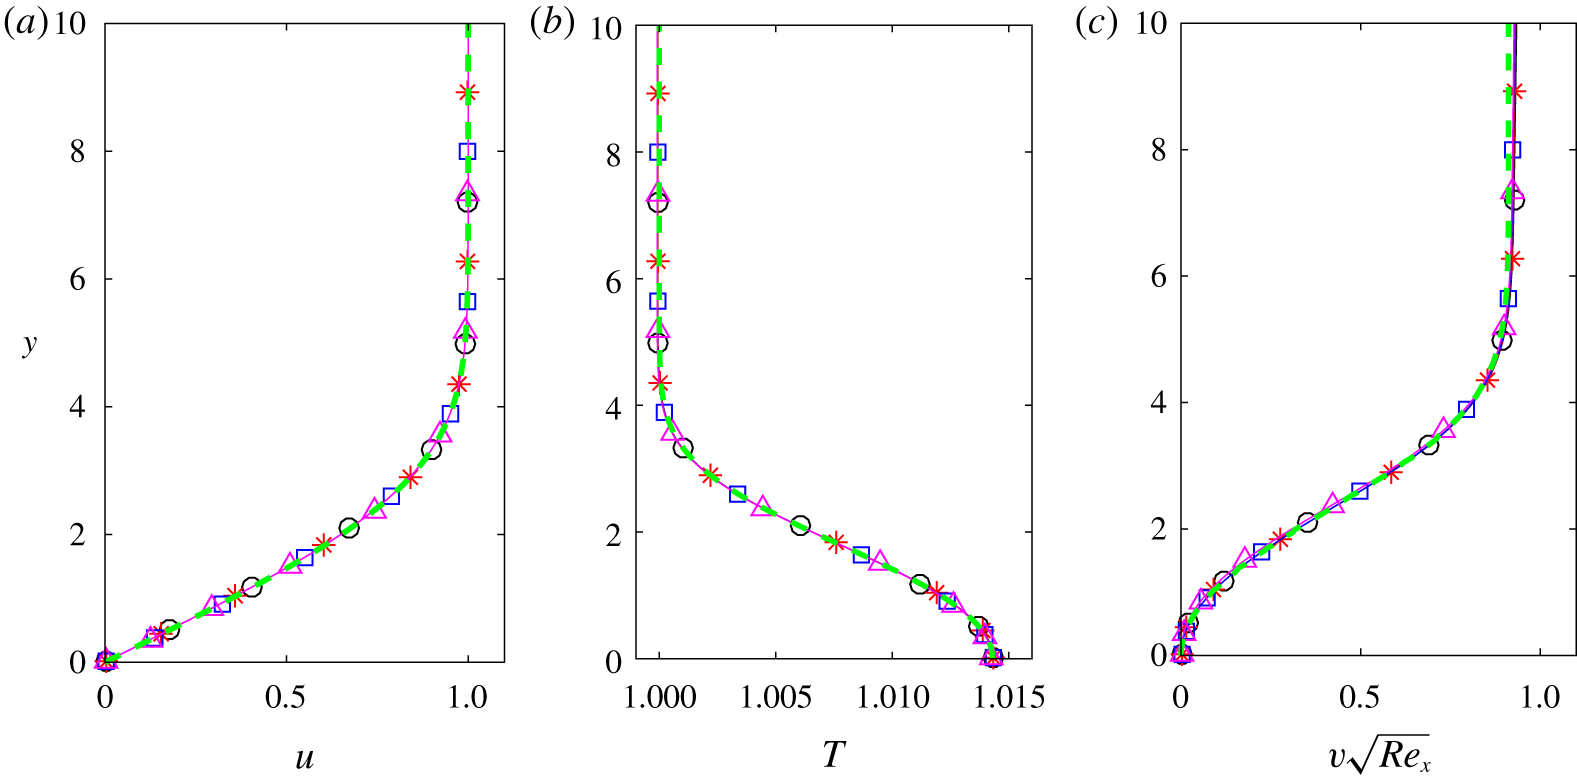
Comparison of streamwise velocity (a), temperature (b) and wall-normal velocity (c) profiles computed by the similarity solution (green – – –) and the DNS code at streamwise locations corresponding to  $Re=825$ (black ○——), 947 (red ∗—— ), 1055 (blue ▫——) and 1152 (magenta ▵——) for a dense gas at
 $M_{\infty }=4.5$.

In most studies in which DNS is used to corroborate the results of LST, e.g. in Ma & Zhong (Reference Ma and Zhong2003), Egorov, Fedorov & Soudakov (Reference Egorov, Fedorov and Soudakov2006), Mayer, Von Terzi & Fasel (Reference Mayer, Von Terzi and Fasel2011), Sivasubramanian & Fasel (Reference Sivasubramanian and Fasel2015) and Knisely & Zhong (Reference Knisely and Zhong2019b), the instability wave is excited using a time-harmonic wall-normal blowing and suction boundary condition. Strong oscillations of the growth rate have been generally observed and attributed either to the coupling with continuous modes from the entropy/vorticity branch or acoustic branches, or to the synchronization between the slow and fast modes. In a first attempt, we have performed a DNS using blowing and suction (not reported for brevity), and we also found strong oscillations in the growth rate. The initial condition corresponded to  $Re=500$, which is past the synchronization with the entropy/vorticity modes, and therefore the coupling with these continuous branches cannot explain the oscillations. Furthermore, the acoustic branches are sufficiently far to exclude their interaction with the excited mode, and the synchronization with the slow mode is also negligible, being highly damped. In fact, the weak shock wave, which appears as the numerical blowing and suction is introduced, is seen to act as a new waveguide trapping acoustic waves. This phenomenon was predicted by Gushchin & Fedorov (Reference Gushchin and Fedorov1989) for the leading-edge shock using Wentzel–Kramers–Brillouin (WKB) solutions of the inviscid stability equations. Following this reasoning, we argue that the shock from the blowing and suction device induces an acoustic standing wave locked at the excitation frequency and having a wavenumber different from that of the excited instability due to the different thickness of the waveguide. This wave interferes with the instability mode, which is also of acoustic nature, due to the waveguide associated with the relative sonic line. The oscillations of the growth rate may thus result from this coupling and cannot be avoided. To cope with this artefact, we then impose the instability wave directly at the inlet boundary condition using the eigenfunctions for
 $u$,
 $v$,
 $p$,
 $\unicode[STIX]{x1D70C}$ and
 $T$, obtained from LST. A similar strategy was also adopted by Ma & Zhong (Reference Ma and Zhong2003) to compare LST and DNS.
In the present simulation, a rectangular 2-D computational domain of 2016 × 200 points was used imposing  $Re_{in}=500$. Using the Blasius length at inlet (
 $L_{in}^{\ast }$) as length scale, the grid has uniform streamwise resolution with
 $\unicode[STIX]{x0394}x\approx 1.079$, and a geometric stretching is applied in the wall-normal direction with a rate of 1.5 % and
 $\unicode[STIX]{x0394}y_{min}\approx 0.036$. At the inlet, the mode
 $F_{1}$ is imposed assuming a frequency
 $\unicode[STIX]{x1D714}_{forcing}=0.42$ and a non-dimensional amplitude
 $\unicode[STIX]{x1D700}=10^{-4}$, which ensures that the disturbance stays in the linear regime. This mode is obtained from LST with
 $\unicode[STIX]{x1D6FC}_{r}=0.4274$ and
 $\unicode[STIX]{x1D6FC}_{i}=2.93\times 10^{-3}$. The wavelength of the perturbation
 $\unicode[STIX]{x1D706}_{x}=2\unicode[STIX]{x03C0}/\unicode[STIX]{x1D6FC}_{r}=14.7$ is discretized by
 $13.6\unicode[STIX]{x0394}x$. Since the DNS results are Fourier-transformed in time to get the harmonic contribution at the forcing frequency, the time step is fixed as
 $\unicode[STIX]{x0394}t=(2\unicode[STIX]{x03C0}/\unicode[STIX]{x1D714}_{forcing})/600$, yielding a Courant–Friedrichs–Lewy (CFL) number of approximately 0.8.
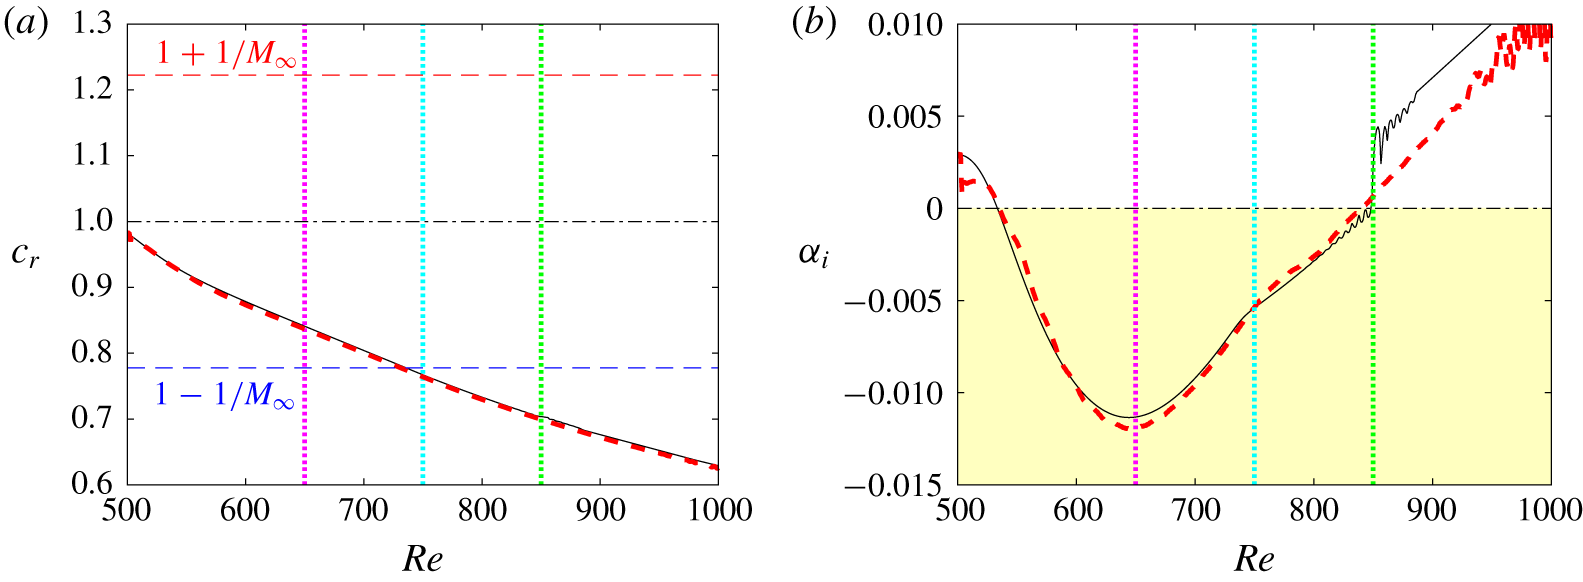
Phase speed (a) and growth rate (b) for a dense gas at  $M_{\infty }=4.5$ obtained by LST (black ——) and DNS (red – – –). Vertical dotted lines indicate locations where eigenfunctions are compared.

First, a precursor calculation of 400 000 iterations without the excitation is run to generate the base flow. In figure 14, the precursor solution is compared with the similarity profiles at four streamwise locations. An excellent agreement is obtained, particularly for the wall-normal velocity component, which is the most sensitive quantity. The precursor DNS thus provides an accurate self-similar initial condition to investigate the instability development. The simulation is then run for 200 000 iterations with the excitation and the results are stored for the last 600 iterations, which corresponds to one period. The amplitude  $A_{1}(x)$ and phase
 $\unicode[STIX]{x1D703}_{1}(x)$ of the complex Fourier transform at the fundamental frequency are used to compute the spatial growth rate and the streamwise wavenumber as
 $$\begin{eqnarray}\unicode[STIX]{x1D6FC}_{i}=-\frac{\text{d}}{\text{d}x}[\ln (A_{1}(x))]\quad \unicode[STIX]{x1D6FC}_{r}=\frac{\text{d}}{\text{d}x}[\unicode[STIX]{x1D703}_{1}(x)].\end{eqnarray}$$
Different variables have been used to evaluate these quantities, such as the velocity components at the vertical distance of maximal amplitude or the wall pressure. Almost no differences were obtained and the results presented hereafter are based on the time Fourier transform of the wall pressure.
In figure 15, the results from DNS are compared with those from LST (following the path represented by the red dashed line in figure 13). The phase velocity of the supersonic mode is very well reproduced (figure 13a). It decreases from a value slightly below 1, i.e. after the synchronization with the entropy/vorticity branch, and reaches relative supersonic values for  $Re\gtrsim 750$ (cyan vertical dotted line). The growth rate (figure 13b) compares well with LST, even though small perturbations of the DNS arise close to the inlet. The maximum growth rate computed from DNS is slightly higher, which can be attributed to non-parallel effects ignored in the LST. The trend of the LST to underpredict the amplification rate has also been observed for the second mode in a perfect gas (Ma & Zhong Reference Ma and Zhong2003). The kink in the growth rate, occurring when the disturbance becomes supersonic, is confirmed by the DNS. The peculiar behaviour observed in the LST when the supersonic mode stabilizes (at
 $Re\gtrsim 850$) is not found in the DNS. Note that, as the mode evolves further stabilizing (at
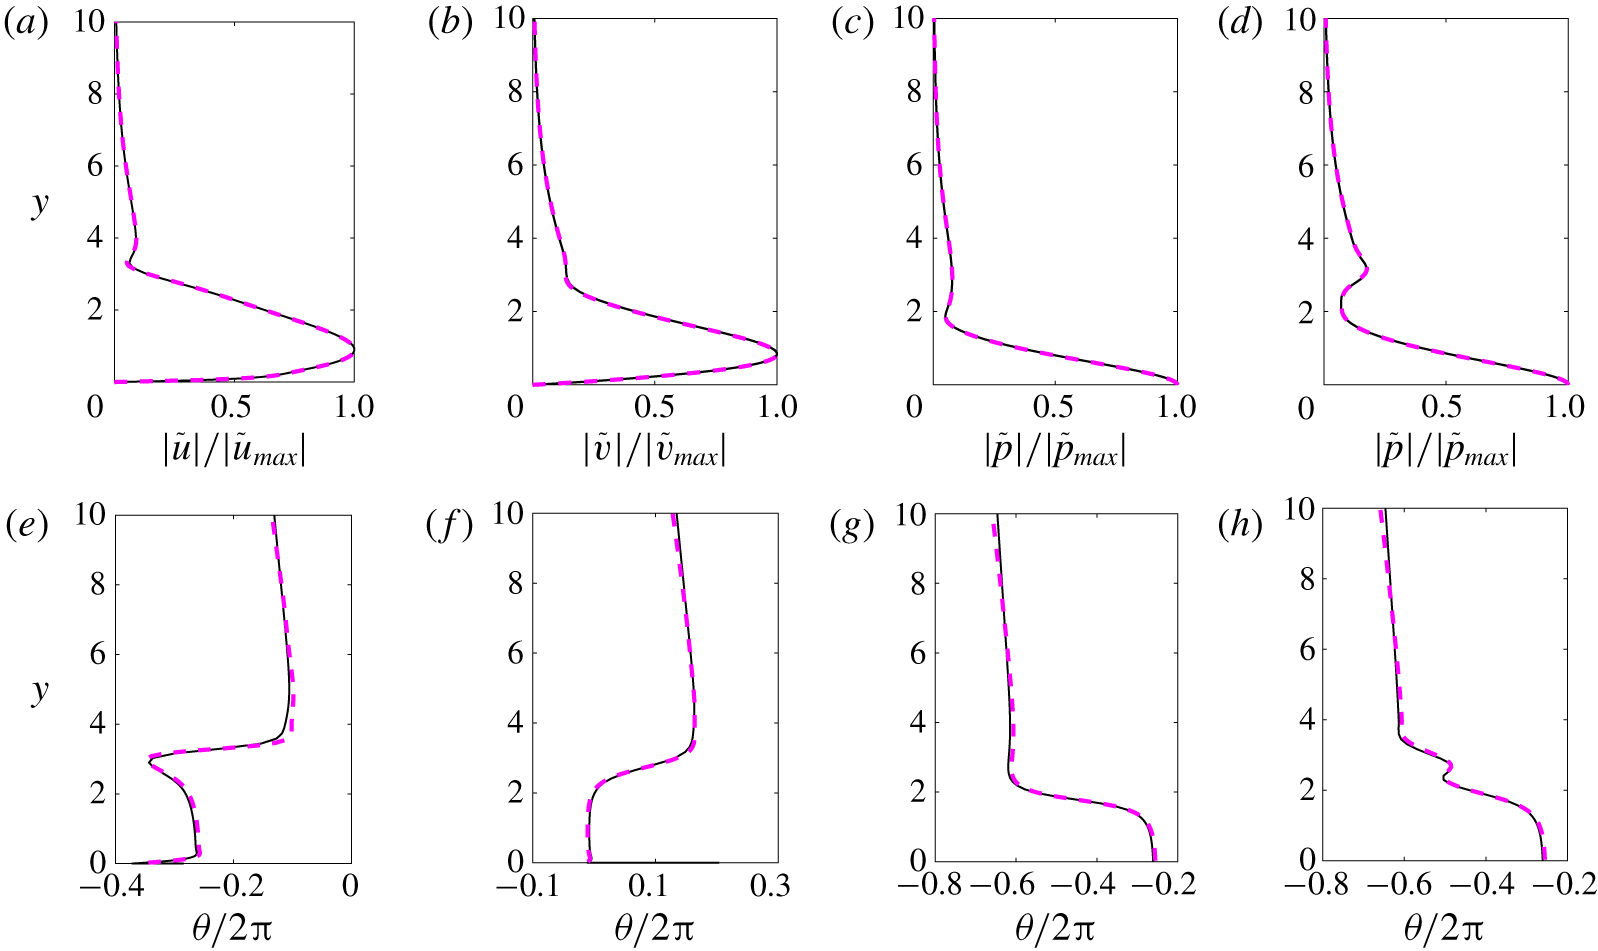
 $Re\gtrsim 960$), some oscillations begin to appear since new perturbations develop from the background noise. In figure 16, the wall-normal amplitude and phase distributions for the streamwise velocity, wall-normal velocity, pressure and density from the DNS are compared at
 $Re=650$ to theoretical predictions from LST at
 $\unicode[STIX]{x1D714}=0.546$. The excellent agreement shows that both DNS and LST reproduce the relevant instability waves. Similar distributions and similar agreement between DNS and LST are found at higher
 $Re$ (not reported for brevity).
Comparison of wall-normal amplitude (a–d) and phase (e–h) of the streamwise velocity, wall-normal velocity, pressure and density disturbance from DNS (magenta – – –) to theoretical predictions from LST (black ——) for frequency  $\unicode[STIX]{x1D714}=0.546$ at
 $Re=650$ for a dense gas at
 $M_{\infty }=4.5$.

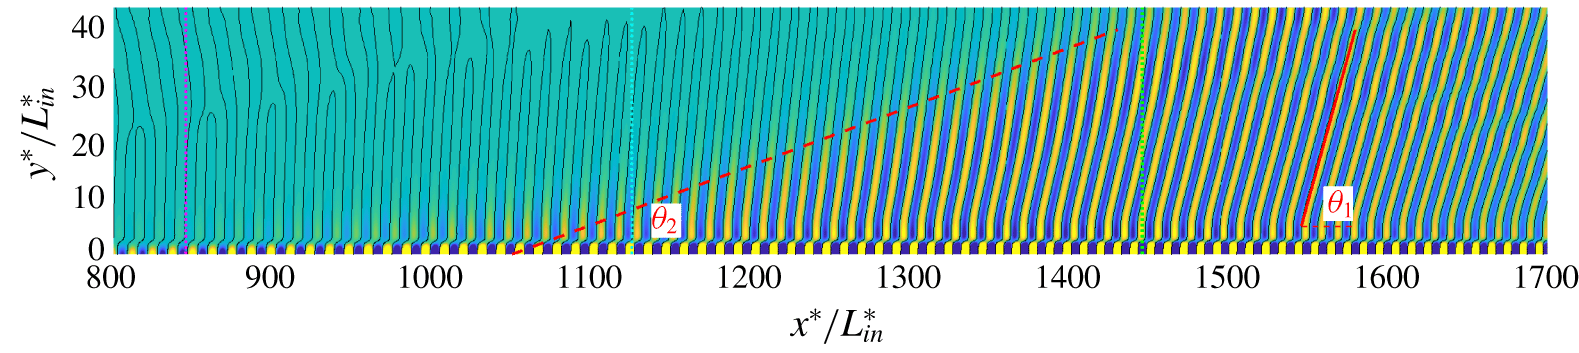
Spontaneous radiation from the supersonic mode for a dense gas at  $M_{\infty }=4.5$: snapshot of the fluctuating pressure between ±2 × 10⁻⁴ and isocontour
 $p^{\prime }=0$. Note that the figure is not drawn to scale.

Influence of EOS model for PP11 at  $M_{\infty }=4.5$ with
 $v_{\infty }/v_{c}=1.8$ and
 $T_{\infty }/T_{c}=0.995$: thermodynamic conditions and boundary-layer properties from similarity solution for PFG EOS, VDW EOS and MAH EOS.

Influence of EOS model on similarity solutions for PP11 at  $M_{\infty }=4.5$. Line legend as in table 4.

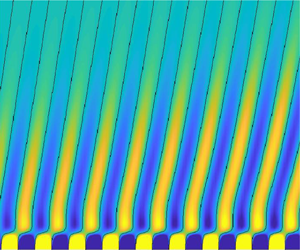
A snapshot of the fluctuating pressure field is depicted in figure 17, where the spontaneous radiation from the supersonic mode is visible. A similar behaviour has been observed by other authors (Bitter & Shepherd Reference Bitter and Shepherd2015; Chuvakhov & Fedorov Reference Chuvakhov and Fedorov2016; Salemi & Fasel Reference Salemi and Fasel2018; Knisely & Zhong Reference Knisely and Zhong2019a) for the supersonic mode in air. Above the second sonic line,  $c_{\unicode[STIX]{x1D711}}=u-a$, wave fronts are radiated to the outer flow with an angle
 $\unicode[STIX]{x1D703}_{1}\approx 45^{\circ }$. These waves form a beam with an exterior boundary inclined at the angle
 $\unicode[STIX]{x1D703}_{2}\approx 6^{\circ }$ with respect to the wall, smaller than the Mach wave angle
 $\sin ^{-1}(1/M_{\infty })\approx 12.8^{\circ }$. The same characteristics have been observed for supersonic mode in air in Chuvakhov & Fedorov (Reference Chuvakhov and Fedorov2016) and Salemi & Fasel (Reference Salemi and Fasel2018) at Mach numbers 5 and 6, respectively.
4.5 Analysis of the supersonic mode
The features of the supersonic mode found in PP11 are similar to those of the supersonic mode observed for air at high-enthalpy conditions and a cold wall. In order to shed some light on the appropriate scaling to identify the effects associated with the dense gas, we have thus considered three different thermodynamic models, namely: the polytropic perfect-gas equation (PFG) with an equivalent specific heat ratio (as defined in § 2.2); the van der Waals equation (VDW); and the Martin and Hou equation (MAH). For the two former gas models, a temperature power law is used for the viscosity (with exponent 0.58) and a constant Prandtl number is assumed ( $Pr=1.67$). The free-stream specific volume and temperature are those used in § 4.1. The thermodynamic conditions and mean flow properties are given in table 4 and figure 18. It is worth pointing out that the velocity profiles for the three models (figure 18a) show a weak thickening of the boundary layer, as indicated by the last two columns of table 4 corresponding to the displacement and 99 % thicknesses. The density variations are also similar (only wall values are reported in table 4). However, both the PFG and VDW gases exhibit a generalized inflection point close to the wall (figure 18d). The temperature increase at the wall is approximately 13 % for PFG and only 1 % for VDW and MAH (figure 18b). Another marked difference is to be noticed for the dynamic viscosity, which has a gas-like behaviour for the simplified models (due to the use of a power law). The variations across the boundary layer for VDW are nonetheless very small. The free-stream value of the fundamental derivative of gas dynamics of PFG is constant and greater than 1 (
 $\unicode[STIX]{x1D6E4}_{\infty }=(1+\unicode[STIX]{x1D6FE}_{eq})/2$), whereas VDW predicts a larger inversion zone than MAH (Sciacovelli et al. Reference Sciacovelli, Cinnella and Grasso2017b) and thus provides higher
 $\unicode[STIX]{x1D6E4}_{\infty }$ values.
LST results for 2-D waves at  $M_{\infty }=4.5$ and
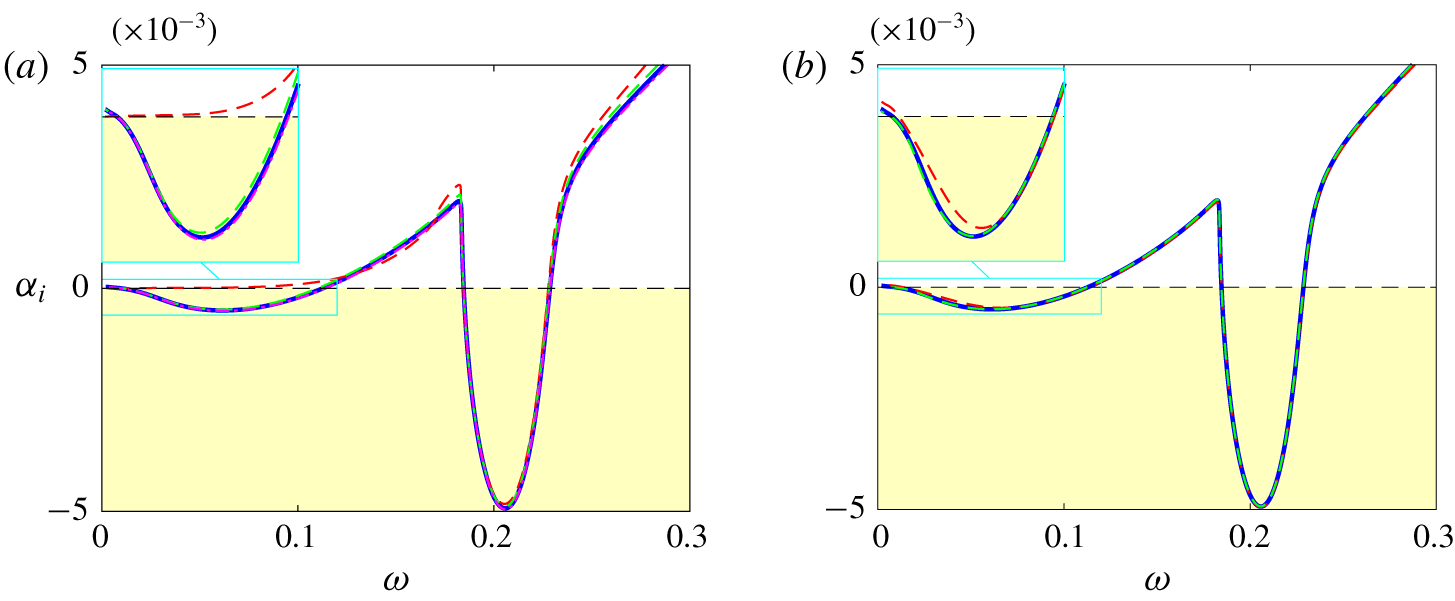
 $Re=2000$ are shown in figure 19. The three different gas models all exhibit a supersonic mode. The growth rate and phase velocity are fairly close for VDW and MAH. The maximum amplification is greater and the frequency lower with PFG, which also yields a more rapid decay of the phase speed. The appearance of the supersonic mode by only changing the specific heat ratio from 1.4 to
 $\unicode[STIX]{x1D6FE}_{eq}=1.01$ is an indication that the main effect is due to the decoupling of the thermal and dynamic effects associated with the high heat capacity of the gas. As also pointed out by Ren et al. (Reference Ren, Marxen and Pecnik2019b), the differences in the results are ascribed to the differences in the values of the Eckert number, which is approximately 10 times higher for PFG. Since, the variations of the dynamic viscosity is opposite between PFG and MAH, we can also conclude that the peculiar behaviour of the viscosity is only a second-order effect for the stability of the boundary-layer flow. The main effect is the dramatic reduction of friction heating in a dense gas.
Influence of EOS model for a dense gas at  $M_{\infty }=4.5$ and
 $Re=2000$: growth rate (a) and phase speed (b). Line legend as in table 4.

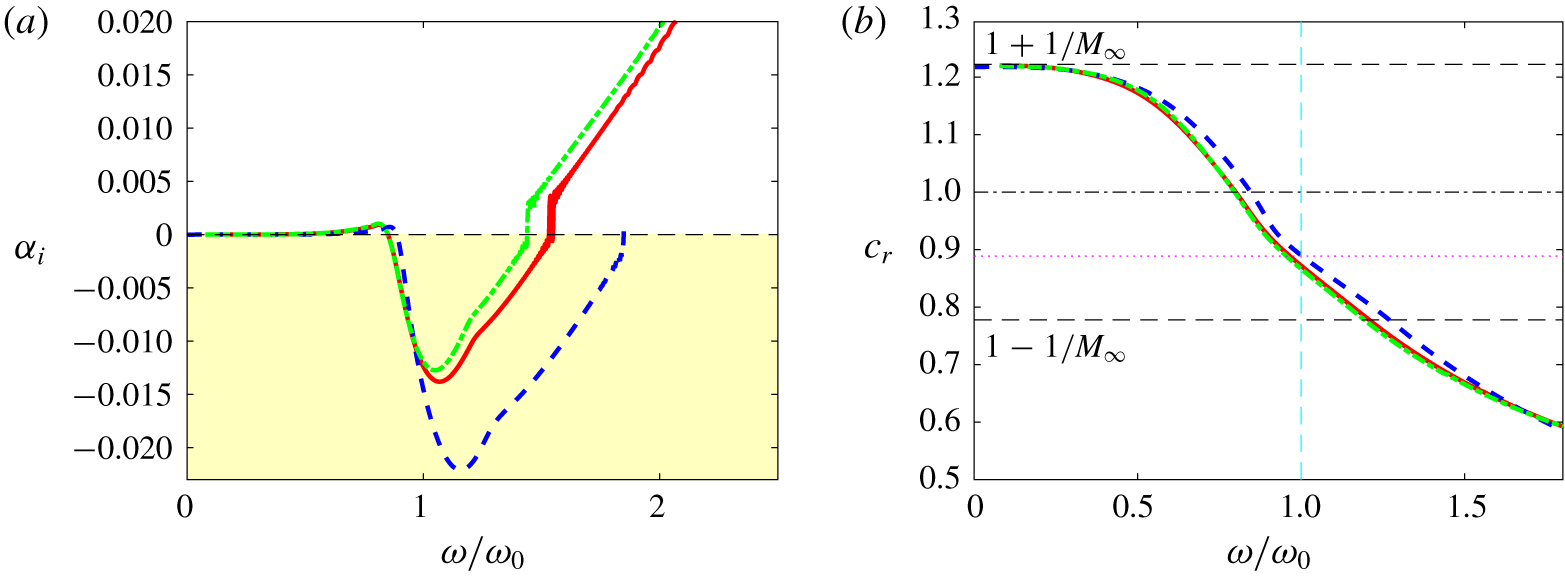
It is of interest to understand why the peak frequency of the supersonic mode is modified when using a simplified EOS. The previous analysis shows that the mode is essentially inviscid, has similar eigenfunctions and is of acoustic nature like Mack’s mode. The main difference with a subsonic second mode is that it arises from the fast mode with a weak synchronization with the slow mode. As a consequence, its phase speed decreases and attains relative supersonic values, thus generating spontaneous acoustic radiation. We recall that, for an acoustic mode, the frequency is dictated by the standing waves trapped in the waveguide between the wall and the relative sonic line. As a consequence, a thinning of the boundary layer would result in a reduction of the waveguide height and hence of the wavelength of the resonant wave.
Influence of EOS model for dense gas at  $M_{\infty }=4.5$ and
 $Re=2000$: growth rate (a) and phase speed (b) versus the non-dimensional frequency. Line legend as in table 4.

In order to estimate this wavelength for scaling purposes, we consider the compressible counterpart of the Rayleigh equation, derived from the inviscid stability equations (Mack Reference Mack1984a). Assuming 2-D disturbances and neglecting the first-order derivative term (i.e. assuming large values of the streamwise wavenumber  $\unicode[STIX]{x1D6FC}$, which is strictly not fully justified but successfully used by Mack (Reference Mack1984a) and Morkovin (Reference Morkovin1987)), the equation reduces to
 $$\begin{eqnarray}\frac{\text{d}^{2}\tilde{p}}{\text{d}y^{2}}-\unicode[STIX]{x1D6FC}^{2}(1-\widetilde{M}^{2})\tilde{p}=0,\end{eqnarray}$$
where  $\widetilde{M}(y)=(u(y)-c_{\unicode[STIX]{x1D711}})/a(y)$ is the relative Mach number varying in the wall-normal direction. Note that (4.1), originally derived using the perfect-gas assumption, has been shown to hold even in the case of an arbitrary equation of state (Ren et al. Reference Ren, Marxen and Pecnik2019b). The nature of the equation changes from elliptic to hyperbolic as
 $\widetilde{M}^{2}$ becomes greater than unity. At the sonic line (
 $y=y_{a}$),
 $\widetilde{M}(y_{a})=-1$ and, in the frame moving at the instability speed, the flow is supersonic in the upstream direction inside this layer. An approximate solution of (4.1), based on the WKB method (Mack Reference Mack1984a; Gushchin & Fedorov Reference Gushchin and Fedorov1990), imposing the nullity of the pressure gradient at the wall and the decrease of the pressure mode at infinity, yields the dispersion relation (Mack Reference Mack1984a)
 $$\begin{eqnarray}\cos \left[\unicode[STIX]{x1D6FC}_{n}\int _{0}^{y_{a}}(\widetilde{M}^{2}-1)^{1/2}\,\text{d}y\right]=0,\end{eqnarray}$$
which shows that there is an infinite sequence of discrete wavenumbers that satisfy
 $$\begin{eqnarray}\unicode[STIX]{x1D6FC}_{n}\int _{0}^{y_{a}}(\widetilde{M}^{2}-1)^{1/2}\,\text{d}y=\unicode[STIX]{x03C0}\left(n-\frac{1}{2}\right),\quad n=1,2,3,\ldots .\end{eqnarray}$$
The results are then scaled in terms of the frequency of the first standing acoustic mode ( $n=1$),
 $$\begin{eqnarray}\unicode[STIX]{x1D714}_{a}=\frac{c_{r}}{2}\left(\int _{0}^{y_{a}}(\widetilde{M}^{2}-1)^{1/2}\,\text{d}y\right)^{-1},\end{eqnarray}$$
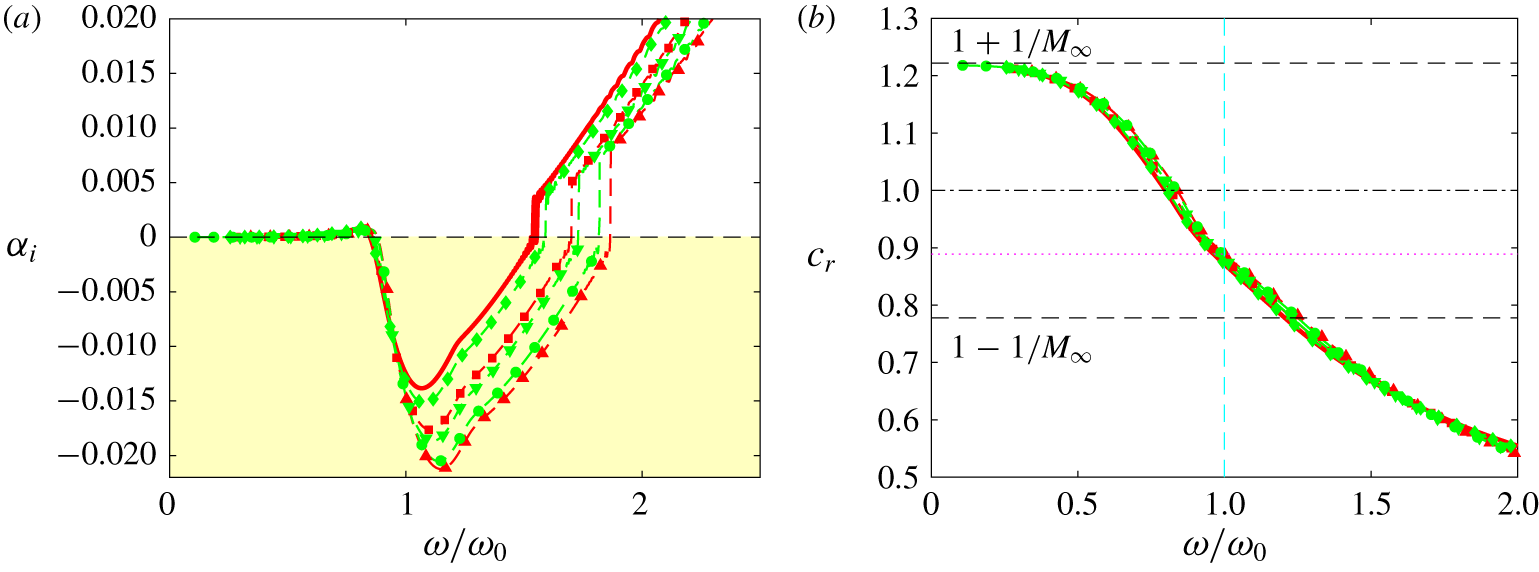
and are reported in figure 20 using the phase speed  $c_{r}$ corresponding to the maximum amplification rate. A very good collapse of the phase speed is obtained, with values corresponding to the median between 1 and
 $1-1/M_{\infty }$ for
 $\unicode[STIX]{x1D714}/\unicode[STIX]{x1D714}_{a}=1$ (magenta dotted line). The growth rate has a negative peak at the acoustic frequency with a good collapse at the onset. We have also tested other scalings (not reported for the sake of brevity). In particular, we have considered scalings based on the free-stream velocity and either
 $\unicode[STIX]{x1D6FF}$ (the 99 % boundary-layer thickness), as suggested by Bitter & Shepherd (Reference Bitter and Shepherd2015), or
 $y_{a}$ (the sonic line height). The thickness of the boundary layer being weakly dependent on the gas model, the results do not collapse when using
 $\unicode[STIX]{x1D6FF}$ as length scale. When using
 $y_{a}$ the peak frequencies are fairly normalized around unity but the phase speeds do not collapse. In conclusion, a satisfactory scaling is found to be proportional to the height of the layer near the wall that acts as a waveguide where acoustic waves may become trapped.
5 Effect of thermodynamic conditions and working fluids on unstable modes
This section is intended to assess the generality of the previous results, obtained for PP11 at a particular operating point inside the inversion zone, for operating conditions farther from the inversion zone and also for other dense gases, which can be lighter and have no inversion zone.
5.1 Effect of operating conditions for PP11
A parametric study of the effect of the thermodynamic operating conditions for PP11 has been conducted. The results are presented for six points, represented in a Clapeyron’s diagram in figure 21 and whose conditions are summarized in table 5. In addition to the nominal conditions (marked by the red circle), we have considered two other operating points (in red) with the same specific volume and higher reduced pressures, so that the last point (red triangle) is outside the dense-gas region. Three additional points (in green) are characterized by the same entropy as the nominal one, but higher specific volumes. The first one (green diamond) is still inside the inversion zone and the last point (green circle) corresponds to a significantly dilute gas.
Clapeyron’s diagram showing the different operating points. Symbols as in table 5. The thick black line represents the saturation curve and the thick dotted blue lines denote two isocontours of the fundamental derivative of gas dynamics  $\unicode[STIX]{x1D6E4}$ (value 0 marks the boundary of the inversion zone and value 1 the boundary of the dense-gas region). The thin black lines are isentropic curves.

The base flow profiles are shown in figure 22. The streamwise velocity distributions are almost not affected by changing the operating conditions and remain close to the incompressible regime. In particular, in all cases, the boundary-layer thickness is approximately the same. The temperature increase at the wall varies from 1.4 % for the nominal case to 6.8 % for the case outside the dense-gas region. This is proportional to the value of the Eckert number for the different cases. The behaviour of the dynamic viscosity is seen to follow a liquid-like evolution in figure 22(c), with a reduced amplitude when we move away from the inversion zone. Finally, figure 22(d) presents the distributions of the generalized derivative, which are almost superimposed for all cases. A close-up view (shown in the inset) indicates, however, that a zero crossing occurs very close to the wall for the two extreme conditions (higher pressure or higher volume). The presence of these generalized inflection points would hardly affect the stability results.
Influence of operating point for dense gas PP11 at  $M_{\infty }=4.5$: thermodynamic conditions and boundary-layer properties from similarity solutions.

Similarity solutions for PP11 (dense gas) at  $M_{\infty }=4.5$ for different operating points. Line legend as in table 5.

The LST results are given in figure 23 for 2-D waves at  $M_{\infty }=4.5$ and
 $Re=2000$. For all cases, the supersonic mode has the same qualitative characteristics. However, the frequency of maximal amplification is decreased and its amplitude is enhanced as the operating point moves away from the nominal case. The frequency change can hardly be explained by modifications of the base flow velocity profiles. Furthermore, the variations of sound speed, inversely proportional to density variations, are similar for the different cases, so that the distributions of the relative Mach number
 $\widetilde{M}$ are weakly impacted, and the height of the acoustic waveguide
 $y_{a}$ is not modified substantially. The acoustic frequency
 $\unicode[STIX]{x1D714}_{a}$ is used to non-dimensionalize the results in figure 24. The scaling succeeds in collapsing the phase speed evolutions and the frequencies of appearance of the instability, showing that the observed differences are due to changes in the absolute value of
 $a$ for the various cases.
Influence of operating point for PP11 at  $M_{\infty }=4.5$ and
 $Re=2000$: growth rate (a) and phase speed (b). Line legend as in table 5.

Influence of operating point for PP11 at  $M_{\infty }=4.5$ and
 $Re=2000$: growth rate (a) and phase speed (b) versus the non-dimensional frequency. Line legend as in table 5.

5.2 Results for other dense gases
In this last section, we assess the generality of our findings for other dense gases. The working conditions for the four new gases are given in table 6. For comparison, the conditions of the nominal case for PP11 are chosen, namely  $M_{\infty }=4.5$,
 $v_{\infty }/v_{c}=1.8$ and
 $T_{\infty }/T_{c}=0.995$. The thermodynamic and transport-properties models for the various gases are given in § 2.2. The main parameters of the similarity solutions are presented in table 6. Selected profiles are displayed in figure 25. The two refrigerants, R134a and R245fa (the lightest of the selected dense gases), exhibit the highest thickening and temperature variations. An interesting feature is their viscosity distributions, characterized by a mixed gas-like (close to the wall) and liquid-like behaviour. Density variations, as indicated by wall density values in table 6, are also stronger. The similarity velocity profiles for the two siloxanes, with a smaller Eckert number, are very close to each other and to that of PP11. Accordingly, temperature variations are very small. The heaviest one (D6), which has a molecular complexity close to that of PP11, also displays a similar non-dimensional wall temperature. The plot of the generalized derivative in figure 25(d) shows up the presence of a generalized inflection point for the refrigerants, which moves away from the wall as the gas is lighter.
Influence of the fluid at  $M_{\infty }=4.5$ with
 $v_{\infty }/v_{c}=1.8$ and
 $T_{\infty }/T_{c}=0.995$: thermodynamic conditions and boundary-layer properties from similarity solutions.

Similarity solutions for different dense gases at  $M_{\infty }=4.5$. Line legend as in table 6.

Influence of the fluid at  $M_{\infty }=4.5$ and
 $Re=2000$: growth rate (a) and phase speed (b). Line legend as in table 6.

The LST results in figure 26 indicate the presence of an unstable supersonic mode in a similar frequency band (approximately  $\unicode[STIX]{x1D714}\approx 0.5$ for all dense gases). The phase speeds in figure 26(b) are typical of fast modes, decreasing until the speed becomes supersonic above
 $\unicode[STIX]{x1D714}\approx 0.6$. Some differences for the frequency or the amplitude of maximum amplification are, however, visible. For instance, the lightest gas, R134a, has the smallest frequency and amplitude and no discontinuity is visible as the mode stabilizes, indicating that the eigenvalue reaches a positive imaginary part without crossing the acoustic branch cut. The phase velocity indeed becomes supersonic when the mode is already stable. In general, the width of the unstable frequency band is narrower for gases with smaller molecular complexity. A reasonably good scaling of the results is achieved by normalizing the frequency with the pulsation of the first acoustic standing wave in the waveguide (not reported for the sake of brevity).
Influence of Mach number for dense gas R134a at  $Re=2000$: growth rate (a) and phase speed (b). Line legend as in table 3 (thick lines for slow modes and thin lines for fast modes).

Finally, in figure 27, we report the growth rates and phase speeds for the lightest gas R134a at various Mach numbers (values used previously for PP11, see table 3 for line legend). The overall behaviour is similar for the two dense gases. The main difference is that the supersonic mode is still stable at  $M_{\infty }=3$, whereas a small unstable frequency range was observed for PP11. At
 $M_{\infty }=6$, the frequency of maximum amplification is lower than at
 $M_{\infty }=4.5$, and the rise of the unstable fast mode is accompanied by a strong stabilization of the slow mode.
6 Conclusions
The linear stability of zero-pressure-gradient boundary layers of dense gases has been investigated to quantify how the peculiar thermodynamic and transport-properties behaviour affect the evolution of unstable modes. Five fluids have been considered: one fluorocarbon (PP11), two refrigerants (R134a and R245fa) and two siloxanes (MDM and D6). The linear stability theory (LST) for parallel flows has been extended to arbitrary equations of state (EOS). In particular, we use the Martin and Hou EOS for the fluorocarbon and multi-parameter EOS based on the Helmholtz free energy for the other fluids. The disturbance equations are written for the velocity components ( $\tilde{u} ,\tilde{v},\tilde{w}$) and for three thermodynamic variables (
 $\tilde{p},\tilde{\unicode[STIX]{x1D70C}},\tilde{T}$), by using the EOS as a supplementary equation. The variables
 $\tilde{p}$ and
 $\tilde{T}$ are generally used for perfect gases, whereas
 $\tilde{\unicode[STIX]{x1D70C}}$ and
 $\tilde{T}$ are used for more general EOS. The present formulation, based on all three variables, provides an LST solver valid for all cases.
First, the LST results for PP11 at thermodynamic conditions corresponding to a point inside the inversion zone have been compared to the results for air flows at wind tunnel conditions for Mach numbers in the range [0.5, 6]. At the lowest value of the Mach number, a single unstable 2-D viscous mode is found in a low-frequency band (approximately  $\unicode[STIX]{x1D714}\approx 0.03$), which is the TS mode at work in the incompressible regime. As the Mach number becomes supersonic, the most unstable wave is oblique and its growth rate is rapidly reduced by compressibility. For a perfect gas like air, the stabilizing effect is progressively counterbalanced, at Mach numbers greater than 3, by the appearance of a generalized inflection point, so that the nature of the mode becomes more and more inviscid. For a dense gas, the Eckert number is much smaller than that in air, due to its high molecular complexity. This implies a decoupling of dynamical and thermal effects, and consequently temperature variations are weak even at high Mach numbers. In the absence of friction heating, the boundary-layer thickness remains almost the same as in the incompressible regime. Furthermore, density variations across the boundary layer are also limited. As a consequence, the generalized inflection point is either not present or located very close to the wall. The inviscid mechanisms do not take over for Mach numbers between 2 and 3, so that the TS mode is continuously damped. For PP11, this mode is stable in two dimensions at
 $M_{\infty }=2.25$, and even oblique waves are stable at
 $M_{\infty }=3$.
For higher speeds ( $M_{\infty }>4$), the second mode becomes more and more dominant for air boundary-layer flows. Its characteristic frequency is higher (
 $\unicode[STIX]{x1D714}\approx 0.2$) than that of the first mode, which is the compressible version of the TS mode, but both modes arise from the same eigenvalue (corresponding to the slow mode for the chosen conditions with insulated walls). The second mode is sometimes qualified as an ‘acoustic’ mode, due to the presence of acoustic waves trapped between the wall and the relative sonic line. For the dense gas, the slow mode is rapidly damped by compressibility effects in the absence of a generalized inflection point that would give this mode an inviscid character. An acoustic mode appears in the high-frequency range since a relative supersonic layer is present, but this mode comes from the fast mode and its characteristic frequency is
 $\unicode[STIX]{x1D714}\approx 0.5$. As a consequence, the wave speed can reach relative supersonic values, producing a kink in the growth-rate curve. By analysing this mode, we found that it has the same features as the so-called supersonic mode observed for highly cooled high-enthalpy boundary layers. By changing the equation of state for PP11 to more crude models, such as the van der Waals gas or the polytropic perfect gas with a specific heat ratio representative of a heavy fluorocarbon, we observe that the supersonic mode arising from the fast mode keeps its main characteristics, meaning that the determinant property that explains its appearance is the strong decoupling of thermal and dynamical effects. This is correlated to the value of the Eckert number. The nature of the supersonic mode is weakly affected by changing the operating point, i.e. using thermodynamic conditions for PP11 outside the inversion zone and even outside the dense-gas region.
The high specific heat of the gas is, once again, the driving parameter that inhibits the thickening of the boundary layer by friction heating. Non-classical gas dynamic effects do not play any role in such a smooth flow. Other dense gases used in practical applications, namely two refrigerants and two siloxanes, have been tested at  $M_{\infty }=4.5$ and
 $Re=2000$. The LST results also show the supersonic mode within a similar frequency range. Indeed, the base flow profiles still exhibit weak temperature variations and weak thickening of the laminar boundary layer. It can be noted that the viscosity distributions have a liquid-like behaviour for fluorocarbons and siloxanes, whereas a mixed liquid-like and gas-like behaviour is observed for the refrigerants. Since these peculiar distributions hardly alter the supersonic mode, it can be concluded that the complex viscosity law of dense gases only acts as a secondary parameter for the stability and essentially determines the value of the local Reynolds number. For the lightest gas (R134a), the evolution of the unstable modes has been studied for various Mach numbers. The overall picture is similar to that obtained for PP11. The first mode stemming from the slow mode is rapidly stabilized and the supersonic mode stemming from the fast mode takes over at hypersonic speeds.
The study also shows that a good frequency scaling for the growth rate and wave speed of the supersonic mode is obtained by using the approximate frequency of the first standing wave mode trapped between the wall and the relative sonic line. The scaling applies to flows with different EOS, Mach numbers, operating points and working fluids. This is an indication of the inviscid acoustic nature of this mode, like Mack modes. A first consequence of the inviscid character is a weak dependence on the Reynolds number, resulting in a relatively flat evolution of neutral stability points for high Reynolds numbers. Another outcome is the presence of Mach waves in the regions of relative supersonic speeds. These Mach waves are confined inside the boundary layer in the acoustic waveguide formed between the wall and the sonic line  $\widetilde{M}=-1$. They correspond to radiating waves outside the boundary layer above the line
 $\widetilde{M}=1$, i.e. as the wave travels supersonically relative to the free-stream velocity. The noise radiation may transfer energy away from the boundary layer. A DNS has been performed for PP11 at
 $M_{\infty }=4.5$, showing the spontaneous sound radiation by the instability wave. The amplification rate and phase speed of the supersonic mode given by the DNS are in very good agreement with LST results, which may be an indication that the parallel assumption of LST is reasonable. Another interesting piece of information given by the DNS is the behaviour of the mode as it stabilizes. Since its phase speed is supersonic, the eigenvalue lies below the horizontal continuous branch corresponding to slow acoustic modes in the complex plane. As it stabilizes, the eigenvalue crosses the real axis and thus the branch cut, yielding a singularity causing discontinuities and oscillations. In fact, a new eigenvalue appears after the branch cut crossing. On the contrary, no discontinuity is visible in the DNS since non-parallel effects alleviate the mathematical singularity of a normal-mode decomposition.
At high speeds, several mode synchronizations can occur: first, when the slow or fast modes cross the entropy/vorticity continuous branches; second, when the slow and fast modes have the same wave speed; and third, when the fast mode crosses the slow acoustic branch for a supersonic mode. Since the dynamics of laminar boundary layers is that of selective noise amplifiers, the different synchronizations may correspond to significant receptivity mechanisms. In the perspective of exploring the laminar-to-turbulent transition of dense gases, receptivity would certainly play a decisive role. In fact, transition is a multi-fold process, depending on numerous parameters of the mean flow and disturbances. The modal path is associated with the development of the first or second modes. In hypersonic air flows, the second mode may be dominant, even if the first mode oblique breakdown can be more efficient than triggering the 2-D second mode (Franko & Lele Reference Franko and Lele2013). This is partially related to the higher frequency range of the second mode, for which the boundary layer is less receptive. Since the supersonic mode occurs in dense gases at even higher frequencies, it can be anticipated that a modal breakdown scenario from the supersonic mode may be hardly observable. The linear and nonlinear development and eventual breakdown to turbulence in a dense-gas boundary layer at Mach 6 using DNS will be the subject of a forthcoming paper. Another appealing perspective is the study of transient growth in compressible boundary layers of dense gases. Transient growth due to the non-normality of the eigenmodes is indeed a candidate mechanism for many examples of bypass transition. It may play an important role for the transition over turbine blades used in ORC systems due to the noisy environment.
Data availability
Some results are made available for download on the following website: https://www.researchgate.net/publication/338607577_Database_Stability_results_for_compressible_boundary_layers_of_dense_gases.
Acknowledgements
This work was granted access to the HPC resources of IDRIS and TGCC under the allocation 2018-1736 made by GENCI (Grand Equipement National de Calcul Intensif). We also acknowledge TGCC for awarding us access to the Joliot-Curie supercomputer under the allocation ‘Grands Challenges’ gch032.
Declaration of interests
The authors report no conflict of interest.
Appendix A. Coefficient matrix of compressible stability equations for an arbitrary EOS
Three modifications of the stability code presented in Gloerfelt & Robinet (Reference Gloerfelt and Robinet2017) were necessary to study dense gases. First, the choice of working variables  $\tilde{\boldsymbol{q}}$ to write stability equations is crucial. For ideal gases, the common choice for the thermodynamic variables is
 $\tilde{p}$ and
 $\tilde{T}$. For non-ideal gases, the equation of state and transport properties are written as a function of
 $\unicode[STIX]{x1D70C}$ and
 $T$, so that variables
 $\tilde{\unicode[STIX]{x1D70C}}$ and
 $\tilde{T}$ are preferred (see e.g. Ren et al. (Reference Ren, Fu and Pecnik2019a)). Unfortunately, these variables are highly correlated for a perfect gas (see Sciacovelli et al. (Reference Sciacovelli, Cinnella and Gloerfelt2017a), § 4.3), leading to bad convergence properties of the stability code when
 $\tilde{\boldsymbol{q}}=(\tilde{u} ,\tilde{v},\tilde{w},\tilde{\unicode[STIX]{x1D70C}},\tilde{T})^{\text{T}}$ is used, as illustrated in figure 28(a). The deviation is enhanced for high values of the Mach number. In order to use exactly the same code for perfect and dense gases, we finally use
 $\tilde{p}$,
 $\tilde{\unicode[STIX]{x1D70C}}$ and
 $\tilde{T}$, by making use of the general relationship
 $$\begin{eqnarray}\tilde{p}=\frac{\unicode[STIX]{x2202}p}{\unicode[STIX]{x2202}\unicode[STIX]{x1D70C}}\tilde{\unicode[STIX]{x1D70C}}+\frac{\unicode[STIX]{x2202}p}{\unicode[STIX]{x2202}T}\tilde{T},\end{eqnarray}$$
where the derivative with respect to  $\unicode[STIX]{x1D70C}$ at constant
 $T$ (and vice versa) is noted as
 $\unicode[STIX]{x2202}/\unicode[STIX]{x2202}\unicode[STIX]{x1D70C}$, instead of
 $(\unicode[STIX]{x2202}/\unicode[STIX]{x2202}\unicode[STIX]{x1D70C})_{T}$. The derivatives of
 $p$ with respect to
 $\unicode[STIX]{x1D70C}$ and
 $T$ are derived analytically for an ideal gas or an MAH EOS. A second change in the code is the use of the energy equation written for the specific internal energy (instead of
 $T$). Finally, the third modification concerns the evaluation of first- and second-order derivatives of transport properties.
Since the formulas used for PP11 (Chung et al. Reference Chung, Ajlan, Lee and Starling1988) are tough, numerical differentiation is used by perturbing the variables by a non-dimensional disturbance  $\unicode[STIX]{x1D700}$. Second-order finite-difference formulas are implemented:
 $$\begin{eqnarray}\displaystyle & \displaystyle \frac{\unicode[STIX]{x2202}\unicode[STIX]{x1D707}}{\unicode[STIX]{x2202}T}=\frac{\unicode[STIX]{x1D707}(T+\unicode[STIX]{x1D700},\unicode[STIX]{x1D70C})-\unicode[STIX]{x1D707}(T-\unicode[STIX]{x1D700},\unicode[STIX]{x1D70C})}{2\unicode[STIX]{x1D700}}, & \displaystyle \nonumber\\ \displaystyle & \displaystyle \frac{\unicode[STIX]{x2202}\unicode[STIX]{x1D707}}{\unicode[STIX]{x2202}\unicode[STIX]{x1D70C}}=\frac{\unicode[STIX]{x1D707}(T,\unicode[STIX]{x1D70C}+\unicode[STIX]{x1D700})-\unicode[STIX]{x1D707}(T,\unicode[STIX]{x1D70C}-\unicode[STIX]{x1D700})}{2\unicode[STIX]{x1D700}}, & \displaystyle \nonumber\\ \displaystyle & \displaystyle \frac{\unicode[STIX]{x2202}^{2}\unicode[STIX]{x1D707}}{\unicode[STIX]{x2202}T^{2}}=\frac{\unicode[STIX]{x1D707}(T+\unicode[STIX]{x1D700},\unicode[STIX]{x1D70C})-2\unicode[STIX]{x1D707}(T,\unicode[STIX]{x1D70C})+\unicode[STIX]{x1D707}(T-\unicode[STIX]{x1D700},\unicode[STIX]{x1D70C})}{\unicode[STIX]{x1D700}^{2}}, & \displaystyle \nonumber\\ \displaystyle & \displaystyle \frac{\unicode[STIX]{x2202}^{2}\unicode[STIX]{x1D707}}{\unicode[STIX]{x2202}\unicode[STIX]{x1D70C}^{2}}=\frac{\unicode[STIX]{x1D707}(T,\unicode[STIX]{x1D70C}+\unicode[STIX]{x1D700})-2\unicode[STIX]{x1D707}(T,\unicode[STIX]{x1D70C})+\unicode[STIX]{x1D707}(T,\unicode[STIX]{x1D70C}-\unicode[STIX]{x1D700})}{\unicode[STIX]{x1D700}^{2}}, & \displaystyle \nonumber\\ \displaystyle & \displaystyle \frac{\unicode[STIX]{x2202}^{2}\unicode[STIX]{x1D707}}{\unicode[STIX]{x2202}T\unicode[STIX]{x2202}\unicode[STIX]{x1D70C}}=\frac{\unicode[STIX]{x1D707}(T+\unicode[STIX]{x1D700},\unicode[STIX]{x1D70C}+\unicode[STIX]{x1D700})-\unicode[STIX]{x1D707}(T-\unicode[STIX]{x1D700},\unicode[STIX]{x1D70C}+\unicode[STIX]{x1D700})-\unicode[STIX]{x1D707}(T+\unicode[STIX]{x1D700},\unicode[STIX]{x1D70C}-\unicode[STIX]{x1D700})+\unicode[STIX]{x1D707}(T-\unicode[STIX]{x1D700},\unicode[STIX]{x1D70C}-\unicode[STIX]{x1D700})}{4\unicode[STIX]{x1D700}^{2}}. & \displaystyle \nonumber\end{eqnarray}$$
The same formulas are used for thermal conductivity  $\unicode[STIX]{x1D705}$ and for the thermodynamic properties of dense gases modelled using the REFPROP library. The sensitivity to the choice of the disturbance
 $\unicode[STIX]{x1D700}$ is shown in figure 28(b) for the perfect gas, for which analytical derivatives of Sutherland’s law are available. No difference with the analytical derivatives is visible for different choices of
 $\unicode[STIX]{x1D700}$. In this study, the value
 $\unicode[STIX]{x1D700}=10^{-3}$ is used.
Influence of LST numerical parameters on the growth rate of the slow mode for a perfect gas at  $M=4.5$ and
 $Re=2000$. (a) Choice of working variables:
 $\tilde{\boldsymbol{q}}=(\tilde{u} ,\tilde{v},\tilde{w},\tilde{p},\tilde{T})^{\text{T}}$ (green – – –),
 $\tilde{\boldsymbol{q}}=(\tilde{u} ,\tilde{v},\tilde{w},\tilde{\unicode[STIX]{x1D70C}},\tilde{T})^{\text{T}}$ (red – – –) and
 $\tilde{\boldsymbol{q}}=(\tilde{u} ,\tilde{v},\tilde{w},\tilde{p},\tilde{\unicode[STIX]{x1D70C}},\tilde{T})^{\text{T}}$ (blue ——). (b) Numerical differentiation for transport properties
 $\unicode[STIX]{x1D707}$ and
 $\unicode[STIX]{x1D705}$: analytical derivatives (green – – –), differentiation with
 $\unicode[STIX]{x1D700}=10^{-2}$ (red - - - - -) and differentiation with
 $\unicode[STIX]{x1D700}=10^{-3}$ (blue ——).

With the preceding set of disturbance variables and equations, the stability equations are derived and put into the form of (3.5). The non-zero elements of the 6 × 6 matrices in (3.5) are given below. We use the notation  $\text{D}\equiv \text{d}/\text{d}y$ and, similarly,
 $\text{D}^{2}\equiv \text{d}^{2}/\text{d}y^{2}$.
The non-zero elements for the matrix  $\unicode[STIX]{x1D63C}$, implying second-order derivatives of disturbances, are given by
 $$\begin{eqnarray}\displaystyle \unicode[STIX]{x1D608}_{21}=-\frac{\unicode[STIX]{x1D707}}{Re},\quad \unicode[STIX]{x1D608}_{32}=-\frac{2\unicode[STIX]{x1D707}+\unicode[STIX]{x1D706}}{Re},\quad \unicode[STIX]{x1D608}_{43}=-\frac{\unicode[STIX]{x1D707}}{Re},\quad \unicode[STIX]{x1D608}_{56}=-\frac{\unicode[STIX]{x1D705}}{Re\,Pr\,Ec}. & & \displaystyle \nonumber\end{eqnarray}$$
The non-zero elements of  $\unicode[STIX]{x1D63D}$, implying first-order derivatives of disturbances, are obtained from the continuity equation as
 $$\begin{eqnarray}\unicode[STIX]{x1D609}_{12}=\unicode[STIX]{x1D70C};\end{eqnarray}$$
from the  $x$-momentum equation as
 $$\begin{eqnarray}\unicode[STIX]{x1D609}_{21}=-\frac{\text{D}\unicode[STIX]{x1D707}}{Re},\quad \unicode[STIX]{x1D609}_{22}=-\text{i}\unicode[STIX]{x1D6FC}\frac{\unicode[STIX]{x1D706}+\unicode[STIX]{x1D707}}{Re},\quad \unicode[STIX]{x1D609}_{25}=-\frac{\unicode[STIX]{x2202}\unicode[STIX]{x1D707}}{\unicode[STIX]{x2202}\unicode[STIX]{x1D70C}}\frac{\text{D}u}{Re},\quad \unicode[STIX]{x1D609}_{26}=-\frac{\unicode[STIX]{x2202}\unicode[STIX]{x1D707}}{\unicode[STIX]{x2202}T}\frac{\text{D}u}{Re};\end{eqnarray}$$
from the  $y$-momentum equation as
 $$\begin{eqnarray}\unicode[STIX]{x1D609}_{31}=-\text{i}\unicode[STIX]{x1D6FC}\frac{\unicode[STIX]{x1D706}+\unicode[STIX]{x1D707}}{Re},\quad \unicode[STIX]{x1D609}_{32}=-\frac{2\text{D}\unicode[STIX]{x1D707}+\text{D}\unicode[STIX]{x1D706}}{Re},\quad \unicode[STIX]{x1D609}_{33}=-\text{i}\unicode[STIX]{x1D6FD}\frac{\unicode[STIX]{x1D706}+\unicode[STIX]{x1D707}}{Re},\quad \unicode[STIX]{x1D609}_{34}=1;\end{eqnarray}$$
from the  $z$-momentum equation as
 $$\begin{eqnarray}\unicode[STIX]{x1D609}_{42}=-\text{i}\unicode[STIX]{x1D6FD}\frac{\unicode[STIX]{x1D706}+\unicode[STIX]{x1D707}}{Re},\quad \unicode[STIX]{x1D609}_{43}=-\frac{\text{D}\unicode[STIX]{x1D707}}{Re},\quad \unicode[STIX]{x1D609}_{45}=-\frac{\unicode[STIX]{x2202}\unicode[STIX]{x1D707}}{\unicode[STIX]{x2202}\unicode[STIX]{x1D70C}}\frac{\text{D}w}{Re},\quad \unicode[STIX]{x1D609}_{46}=-\frac{\unicode[STIX]{x2202}\unicode[STIX]{x1D707}}{\unicode[STIX]{x2202}T}\frac{\text{D}w}{Re};\end{eqnarray}$$
and from the energy equation as
 $$\begin{eqnarray}\displaystyle & \displaystyle \unicode[STIX]{x1D609}_{51}=-2\unicode[STIX]{x1D707}\frac{\text{D}u}{Re},\quad \unicode[STIX]{x1D609}_{52}=p;\quad \unicode[STIX]{x1D609}_{53}=-2\unicode[STIX]{x1D707}\frac{\text{D}w}{Re},\quad \unicode[STIX]{x1D609}_{55}=-\frac{1}{Re\,Pr\,Ec}\frac{\unicode[STIX]{x2202}\unicode[STIX]{x1D705}}{\unicode[STIX]{x2202}\unicode[STIX]{x1D70C}}\text{D}T, & \displaystyle \nonumber\\ \displaystyle & \displaystyle \unicode[STIX]{x1D609}_{56}=-\frac{1}{Re\,Pr\,Ec}\left(2\frac{\unicode[STIX]{x2202}\unicode[STIX]{x1D705}}{\unicode[STIX]{x2202}T}\text{D}T+\frac{\unicode[STIX]{x2202}\unicode[STIX]{x1D705}}{\unicode[STIX]{x2202}\unicode[STIX]{x1D70C}}\text{D}\unicode[STIX]{x1D70C}\right). & \displaystyle \nonumber\end{eqnarray}$$
Finally, the terms of matrix  $\unicode[STIX]{x1D63E}$, implying no derivatives with respect to the disturbance field, are obtained from the continuity equation as
 $$\begin{eqnarray}\unicode[STIX]{x1D60A}_{11}=\text{i}\unicode[STIX]{x1D6FC}\unicode[STIX]{x1D70C},\quad \unicode[STIX]{x1D60A}_{12}=\text{D}\unicode[STIX]{x1D70C},\quad \unicode[STIX]{x1D60A}_{13}=\text{i}\unicode[STIX]{x1D6FD}\unicode[STIX]{x1D70C},\quad \unicode[STIX]{x1D60A}_{15}=\text{i}(\unicode[STIX]{x1D6FC}u+\unicode[STIX]{x1D6FD}w-\unicode[STIX]{x1D714});\end{eqnarray}$$
from the  $x$-momentum equation as
 $$\begin{eqnarray}\displaystyle & \displaystyle \unicode[STIX]{x1D60A}_{21}=\text{i}\unicode[STIX]{x1D70C}(\unicode[STIX]{x1D6FC}u+\unicode[STIX]{x1D6FD}w-\unicode[STIX]{x1D714})+\unicode[STIX]{x1D707}\frac{\unicode[STIX]{x1D6FC}^{2}+\unicode[STIX]{x1D6FD}^{2}}{Re}+\unicode[STIX]{x1D6FC}^{2}\frac{\unicode[STIX]{x1D706}+\unicode[STIX]{x1D707}}{Re}, & \displaystyle \nonumber\\ \displaystyle & \displaystyle \unicode[STIX]{x1D60A}_{22}=\unicode[STIX]{x1D70C}\text{D}u-\text{i}\unicode[STIX]{x1D6FC}\frac{\text{D}\unicode[STIX]{x1D707}}{Re},\quad \unicode[STIX]{x1D60A}_{23}=\unicode[STIX]{x1D6FC}\unicode[STIX]{x1D6FD}\frac{\unicode[STIX]{x1D706}+\unicode[STIX]{x1D707}}{Re},\quad \unicode[STIX]{x1D60A}_{24}=\text{i}\unicode[STIX]{x1D6FC}, & \displaystyle \nonumber\\ \displaystyle & \displaystyle \unicode[STIX]{x1D60A}_{25}=-\frac{1}{Re}\left[\left(\frac{\unicode[STIX]{x2202}^{2}\unicode[STIX]{x1D707}}{\unicode[STIX]{x2202}\unicode[STIX]{x1D70C}^{2}}\text{D}\unicode[STIX]{x1D70C}+\frac{\unicode[STIX]{x2202}^{2}\unicode[STIX]{x1D707}}{\unicode[STIX]{x2202}T\unicode[STIX]{x2202}\unicode[STIX]{x1D70C}}\text{D}T\right)\text{D}u+\frac{\unicode[STIX]{x2202}\unicode[STIX]{x1D707}}{\unicode[STIX]{x2202}\unicode[STIX]{x1D70C}}\text{D}^{2}u\right], & \displaystyle \nonumber\\ \displaystyle & \displaystyle \unicode[STIX]{x1D60A}_{26}=-\frac{1}{Re}\left[\left(\frac{\unicode[STIX]{x2202}^{2}\unicode[STIX]{x1D707}}{\unicode[STIX]{x2202}T^{2}}\text{D}T+\frac{\unicode[STIX]{x2202}^{2}\unicode[STIX]{x1D707}}{\unicode[STIX]{x2202}T\unicode[STIX]{x2202}\unicode[STIX]{x1D70C}}\text{D}\unicode[STIX]{x1D70C}\right)\text{D}u+\frac{\unicode[STIX]{x2202}\unicode[STIX]{x1D707}}{\unicode[STIX]{x2202}T}\text{D}^{2}u\right]; & \displaystyle \nonumber\end{eqnarray}$$
from the  $y$-momentum equation as
 $$\begin{eqnarray}\displaystyle & \displaystyle \unicode[STIX]{x1D60A}_{31}=-\text{i}\unicode[STIX]{x1D6FC}\frac{\text{D}\unicode[STIX]{x1D706}}{Re},\quad \unicode[STIX]{x1D60A}_{32}=\text{i}\unicode[STIX]{x1D70C}(\unicode[STIX]{x1D6FC}u+\unicode[STIX]{x1D6FD}w-\unicode[STIX]{x1D714})+\unicode[STIX]{x1D707}\frac{\unicode[STIX]{x1D6FC}^{2}+\unicode[STIX]{x1D6FD}^{2}}{Re},\quad \unicode[STIX]{x1D60A}_{33}=-\text{i}\unicode[STIX]{x1D6FD}\frac{\text{D}\unicode[STIX]{x1D706}}{Re}, & \displaystyle \nonumber\\ \displaystyle & \displaystyle \unicode[STIX]{x1D60A}_{35}=-\text{i}\frac{\unicode[STIX]{x2202}\unicode[STIX]{x1D707}}{\unicode[STIX]{x2202}\unicode[STIX]{x1D70C}}\frac{\unicode[STIX]{x1D6FC}\text{D}u+\unicode[STIX]{x1D6FD}\text{D}w}{Re},\quad \unicode[STIX]{x1D60A}_{36}=-\text{i}\frac{\unicode[STIX]{x2202}\unicode[STIX]{x1D707}}{\unicode[STIX]{x2202}T}\frac{\unicode[STIX]{x1D6FC}\text{D}u+\unicode[STIX]{x1D6FD}\text{D}w}{Re}; & \displaystyle \nonumber\end{eqnarray}$$
Influence of LST numerical parameters on the growth rate of the slow mode for a perfect gas at  $M=4.5$ and
 $Re=2000$. (a) Number of Chebyshev collocation points:
 $N=120$ (red – – –),
 $N=150$ (green – – –),
 $N=200$ (blue ——) and
 $N=250$ (magenta – - – - –). (b) Non-dimensional upper limit of the computational domain:
 $y_{max}=50$ (red – – –),
 $y_{max}=100$ (blue ——) and
 $y_{max}=150$ (green – – –).

from the  $z$-momentum equation as
 $$\begin{eqnarray}\displaystyle & \displaystyle \unicode[STIX]{x1D60A}_{41}=\unicode[STIX]{x1D6FC}\unicode[STIX]{x1D6FD}\frac{\unicode[STIX]{x1D706}+\unicode[STIX]{x1D707}}{Re},\quad \unicode[STIX]{x1D60A}_{42}=\unicode[STIX]{x1D70C}\text{D}w-\text{i}\unicode[STIX]{x1D6FD}\frac{\text{D}\unicode[STIX]{x1D707}}{Re}, & \displaystyle \nonumber\\ \displaystyle & \displaystyle \unicode[STIX]{x1D60A}_{43}=\text{i}\unicode[STIX]{x1D70C}(\unicode[STIX]{x1D6FC}u+\unicode[STIX]{x1D6FD}w-\unicode[STIX]{x1D714})+\unicode[STIX]{x1D707}\frac{\unicode[STIX]{x1D6FC}^{2}+\unicode[STIX]{x1D6FD}^{2}}{Re}+\unicode[STIX]{x1D6FD}^{2}\frac{\unicode[STIX]{x1D706}+\unicode[STIX]{x1D707}}{Re},\quad \unicode[STIX]{x1D60A}_{44}=\text{i}\unicode[STIX]{x1D6FD}, & \displaystyle \nonumber\\ \displaystyle & \displaystyle \unicode[STIX]{x1D60A}_{45}=-\frac{1}{Re}\left[\left(\frac{\unicode[STIX]{x2202}^{2}\unicode[STIX]{x1D707}}{\unicode[STIX]{x2202}\unicode[STIX]{x1D70C}^{2}}\text{D}\unicode[STIX]{x1D70C}+\frac{\unicode[STIX]{x2202}^{2}\unicode[STIX]{x1D707}}{\unicode[STIX]{x2202}T\unicode[STIX]{x2202}\unicode[STIX]{x1D70C}}\text{D}T\right)\text{D}w+\frac{\unicode[STIX]{x2202}\unicode[STIX]{x1D707}}{\unicode[STIX]{x2202}\unicode[STIX]{x1D70C}}\text{D}^{2}w\right], & \displaystyle \nonumber\\ \displaystyle & \displaystyle \unicode[STIX]{x1D60A}_{46}=-\frac{1}{Re}\left[\left(\frac{\unicode[STIX]{x2202}^{2}\unicode[STIX]{x1D707}}{\unicode[STIX]{x2202}T^{2}}\text{D}T+\frac{\unicode[STIX]{x2202}^{2}\unicode[STIX]{x1D707}}{\unicode[STIX]{x2202}T\unicode[STIX]{x2202}\unicode[STIX]{x1D70C}}\text{D}\unicode[STIX]{x1D70C}\right)\text{D}w+\frac{\unicode[STIX]{x2202}\unicode[STIX]{x1D707}}{\unicode[STIX]{x2202}T}\text{D}^{2}w\right]; & \displaystyle \nonumber\end{eqnarray}$$
from the energy equation as
 $$\begin{eqnarray}\displaystyle \unicode[STIX]{x1D60A}_{51}=\text{i}\unicode[STIX]{x1D6FC}p,\quad \unicode[STIX]{x1D60A}_{52}=\unicode[STIX]{x1D70C}\text{D}e-2\text{i}\unicode[STIX]{x1D707}\frac{\unicode[STIX]{x1D6FC}\text{D}u+\unicode[STIX]{x1D6FD}\text{D}w}{Re},\quad \unicode[STIX]{x1D60A}_{53}=\text{i}\unicode[STIX]{x1D6FD}p; & & \displaystyle \nonumber\end{eqnarray}$$
 $$\begin{eqnarray}\displaystyle \unicode[STIX]{x1D60A}_{55} & = & \displaystyle \text{i}\unicode[STIX]{x1D70C}(\unicode[STIX]{x1D6FC}u+\unicode[STIX]{x1D6FD}w-\unicode[STIX]{x1D714})\frac{\unicode[STIX]{x2202}e}{\unicode[STIX]{x2202}\unicode[STIX]{x1D70C}}-\frac{\unicode[STIX]{x2202}\unicode[STIX]{x1D707}}{\unicode[STIX]{x2202}\unicode[STIX]{x1D70C}}\frac{(\text{D}u)^{2}+(\text{D}w)^{2}}{Re}\nonumber\\ \displaystyle & & \displaystyle -\,\frac{1}{Re\,Pr\,Ec}\left[\left(\frac{\unicode[STIX]{x2202}^{2}\unicode[STIX]{x1D705}}{\unicode[STIX]{x2202}\unicode[STIX]{x1D70C}^{2}}\text{D}\unicode[STIX]{x1D70C}+\frac{\unicode[STIX]{x2202}^{2}\unicode[STIX]{x1D705}}{\unicode[STIX]{x2202}T\unicode[STIX]{x2202}\unicode[STIX]{x1D70C}}\text{D}T\right)\text{D}T+\frac{\unicode[STIX]{x2202}\unicode[STIX]{x1D705}}{\unicode[STIX]{x2202}\unicode[STIX]{x1D70C}}\text{D}^{2}T\right],\nonumber\\ \displaystyle \unicode[STIX]{x1D60A}_{56} & = & \displaystyle \text{i}\unicode[STIX]{x1D70C}(\unicode[STIX]{x1D6FC}u+\unicode[STIX]{x1D6FD}w-\unicode[STIX]{x1D714})\frac{\unicode[STIX]{x2202}e}{\unicode[STIX]{x2202}T}-\frac{\unicode[STIX]{x2202}\unicode[STIX]{x1D707}}{\unicode[STIX]{x2202}T}\frac{(\text{D}u)^{2}+(\text{D}w)^{2}}{Re}\nonumber\\ \displaystyle & & \displaystyle -\,\frac{1}{Re\,Pr\,Ec}\left[\left(\frac{\unicode[STIX]{x2202}^{2}\unicode[STIX]{x1D705}}{\unicode[STIX]{x2202}T^{2}}\text{D}T+\frac{\unicode[STIX]{x2202}^{2}\unicode[STIX]{x1D705}}{\unicode[STIX]{x2202}T\unicode[STIX]{x2202}\unicode[STIX]{x1D70C}}\text{D}\unicode[STIX]{x1D70C}\right)\text{D}T+\frac{\unicode[STIX]{x2202}\unicode[STIX]{x1D705}}{\unicode[STIX]{x2202}T}\text{D}^{2}T-\unicode[STIX]{x1D705}(\unicode[STIX]{x1D6FC}^{2}+\unicode[STIX]{x1D6FD}^{2})\right];\nonumber\end{eqnarray}$$
and from the equation of state as
 $$\begin{eqnarray}\unicode[STIX]{x1D60A}_{64}=1,\quad \unicode[STIX]{x1D60A}_{65}=-\frac{\unicode[STIX]{x2202}p}{\unicode[STIX]{x2202}\unicode[STIX]{x1D70C}},\quad \unicode[STIX]{x1D60A}_{66}=-\frac{\unicode[STIX]{x2202}p}{\unicode[STIX]{x2202}T}.\end{eqnarray}$$
In these coefficients,  $\text{D}\unicode[STIX]{x1D707}$,
 $\text{D}\unicode[STIX]{x1D706}$ and
 $De$ are defined by the following differential relations:
 $$\begin{eqnarray}\text{D}\unicode[STIX]{x1D707}=\frac{\unicode[STIX]{x2202}\unicode[STIX]{x1D707}}{\unicode[STIX]{x2202}T}\text{D}T+\frac{\unicode[STIX]{x2202}\unicode[STIX]{x1D707}}{\unicode[STIX]{x2202}\unicode[STIX]{x1D70C}}\text{D}\unicode[STIX]{x1D70C},\quad \text{D}\unicode[STIX]{x1D706}=\frac{\unicode[STIX]{x2202}\unicode[STIX]{x1D706}}{\unicode[STIX]{x2202}T}\text{D}T+\frac{\unicode[STIX]{x2202}\unicode[STIX]{x1D706}}{\unicode[STIX]{x2202}\unicode[STIX]{x1D70C}}\text{D}\unicode[STIX]{x1D70C},\quad \text{D}e=\frac{\unicode[STIX]{x2202}e}{\unicode[STIX]{x2202}T}\text{D}T+\frac{\unicode[STIX]{x2202}e}{\unicode[STIX]{x2202}\unicode[STIX]{x1D70C}}\text{D}\unicode[STIX]{x1D70C}.\end{eqnarray}$$
The derivatives with respect to  $y$ are evaluated with the matrix form of the Chebyshev collocation derivatives (Gloerfelt & Robinet Reference Gloerfelt and Robinet2017). The influence of the number of collocation points is shown in figure 29(a). Typically,
 $N=200$ collocation points is sufficient to give an almost grid-independent solution of the physical modes. This value is used for all present calculations. In the compressible regime, the decay of eigenfunctions can be very slow and we have to choose properly the upper limit
 $y_{max}$ of the computational domain. Numerical tests, reported in figure 29(b), show that a value of
 $y_{max}=100$ is sufficient, and is retained in the present study.