


1. Introduction
The issue of the stability of Earth’s cryosphere has come to be seen as significant, especially given that models of the change in climate expected to occur as a consequence of increasing atmospheric concentrations of greenhouse gases are predicting substantial global warming (Reference Houghton, Filho, Callander, Harris, Kattenberg and MaskellHoughton and others, 1996). In order to assess the response of the modern cryosphere to the expected change in climate better, we require models of this component of the Earth system with which we can accurately predict the future. Models of the required accuracy do not currently exist, partly because there is no modern analogue of the expected changes of climate for calibrating them. This is why extensive analyses of the history of glaciation and deglaciation to which the planet has been subjected during the Pleistocene period of Earth history are being performed (e.g. Reference Deblonde and PeltierDeblonde and Peltier, 1991, Reference Deblonde and Peltier1993; Reference Deblonde, Peltier and HydeDeblonde and others, 1992; Reference Peltier and MarshallPeltier and Marshall 1995; Reference Marshall, Clarke, Dyke and FisherMarshall and others, 1996; Reference Huybrechts and TsiobbelHuybrechts and T’Siobel, 1997; Reference Marshall and ClarkeMarshall and Clarke, 1997a, b). The burgeoning interest in reconstructing ice-age ice sheets has developed on the excellent base of the improved understanding made possible by the application and intercomparison of modern thermomechanical models of ice-sheet evolution in the context of the European Ice Sheet Modelling Initiative (EISMINT), enabling reproduction of the forms of the existing Greenland and Antarctic ice sheets (e.g. Reference HuybrechtsHuybrechts, 1986, Reference Huybrechts1996; Reference Letréguilly, Huybrechts and ReehLetreguilly and others, 1991; Reference Huybrechts and PayneHuybrechts and others, 1996). As a result of our recent work (Reference Tarasov and PeltierTarasov and Peltier, 1997b, Reference Tarasov and Peltier1999) and the work of others (Reference Huybrechts and TsiobbelHuybrechts and T’Siobel, 1997), it has become clear that a fundamental problem may exist concerning our understanding of the mechanism through which large continental-scale ice sheets flow in response to the weak gravitationally applied shear stresses to which they are subject.
This problem has become evident as a consequence of the development of a solid-earth-geophysical methodology which makes it possible to infer the thicknesses of the ice sheets that covered substantial fractions of the Northern Hemisphere continents near the rotation pole at the Last Glacial Maximum (LGM). Reference PeltierPeltier (1994) demonstrated how relative sea-level observations from sites glaciated at the LGM could be used to infer the thickness of ice that must have been removed in order to induce the amount of post-glacial emergence of the crust since deglaciation was complete. It was thereby shown that the necessary ice thicknesses were in full accord, in their sum, with the total amount of ice that must have been removed from all such locations, according to the constraint provided by the LGM to Holocene inference of the variation of sea level based upon U/Th-dated coral sequences from Barbados (Reference FairbanksFairbanks, 1989; Reference Bard, Hamelin, Fairbanks and ZindlerBard and others, 1990). As pointed out by Reference PeltierPeltier (1994, Reference Peltier1996), the thicknesses thereby inferred are significantly smaller than those previously suggested in the context of the CLIMAP project (CLIMAP, 1976) on the basis of steady-state glaciological reconstructions based on Glen’s flow law. Since the surface areas covered by the LGM ice sheets are very well constrained by the geomorphological evidence (e.g. Reference Dyke and PrestDyke and Prest (1987) for the Laurentide and adjacent ice sheets), it was immediately clear that these new results could pose a significant challenge to conventional glaciological theory. For these ice sheets to cover the large surface areas required by the geological observations, it was apparent they would have to flow much more readily in response to the small gravitationally applied shear stresses than they would if they were frozen to their beds and if the usual Reference GlenGlen (1955) rheology were assumed to represent the stress-strain-rate relation adequately.
One suggestion as to how this problem might be resolved was provided by Reference Clark, Licciardi, MacAyeal and JensonClark and others (1996) who suggested the Laurentide ice sheet might have its rate of flow over the surface controlled by basal processes rather than by internal deformation. In their view, this might be accommodated by the soft sediments that underlaid this ice sheet in the Canadian Prairies and along its southern margin. Although this mechanism could play some role in explaining the geophysically inferred aspect ratio, there is still the problem that much of the central dome of the ice sheet was underlain by the exposed crystalline basement rocks of the Canadian Shield. Although one cannot rule out the possibility that significantly enhanced flow, accommodated by sediment deformation or sliding, might nevertheless have occurred, no explicit model has yet been produced in which the phenomenon is fully realized (see Tarasov and Peltier, 2000). The lack of an acceptable model of subglacial processes, required to more fully investigate this issue, might be alleviated by further advances of the type described in Reference Marshall and ClarkeMarshall and Clarke (1997a, b), but until then it seems reasonable to consider whether there might be other explanations of the "aspect-ratio paradox". In this paper, we focus on the rheology of ice itself in the search for such an alternative explanation.
Ever since the pioneering work of Reference GlenGlen (1955), it has most often been assumed that the rheology of both continental-scale ice sheets and alpine glaciers is governed essentially by the mechanism of dislocation creep (but see section 2 which demonstrates that attribution of Glen’s law to a pure-dislocation mechanism is probably incorrect). This mechanism is such that it may be described as a special case of the following most general form of a thermally activated isotropic flow law,

in which ε is the strain rate, A is a materials parameter, a is differential stress, d is grain-size, Q is the activation energy for creep, R is the gas constant and T* is absolute temperature corrected for the pressure-melting point. The usual isotropic form of Glen’s flow law corresponds to the case in which the grain-size exponent p = 0 and the stress exponent n=3 whereas f is a factor that is unity for clean ice in the laboratory, but which may be increased in order to account for the "speed-up" due to softening caused by the presence of impurities such as dust or, more importantly, due to the influence of anisotropy (see below). Modern ice mechanical analyses, discussed at length in Reference PatersonPaterson (1994), usually assume (A, Q) = (1.14 × 10⁻⁵ Pa−3 a−1, 60 kJ mole−1) for T* ≤ 263.15 K and (A,Q) = (5.47×10⁻¹⁰ pa–3a−1, 139 kJ mole ) for T > 263.15 K. These are the standard values of the isotropic-flow-law parameters that have been selected for use in the EISMINT intercomparison project (Reference Huybrechts and PayneHuybrechts and others, 1996). Although models based on the assumption of this rheology have usually been employed essentially without question for decades in modelling ice-sheet flow, the laboratory experiments upon which Glen’s original formulation of his law were based have, in fact, not been subjected to the much more stringent tests that are possible using modern experimental methods until relatively recently.
In section 2, we describe results obtained recently from new laboratory experiments on the rheology of ice at the University of Minnesota (Reference GoldsbyGoldsby, 1997; Reference Goldsby and KohlstedtGoldsby and Kohlstedt, 1997a, b). They suggest very strongly that, at the low levels of differential stress realized in the flow of large continental ice sheets, the mechanism that is expected to control the strain rate is not in fact dislocation creep but rather grain-boundary sliding (GBS). Furthermore, in the GBS regime and for the range of temperatures relevant to the flow of such large ice masses, the strain rate realized at the appropriate levels of differential stress may be as much as 1–2 orders of magnitude higher than would be delivered by the conventional form of Glen’s flow law. This, as it happens, is precisely the magnitude of strain-rate enhancement, above that needed to reconcile the form of the modern Greenland ice sheet, that is required to resolve the previously discussed aspect-ratio paradox associated with the LGM Laurentide ice sheet.
In section 3 we explicitly intercompare ice-sheet-model predictions based on the new GBS rheology with those employing the usual Glen model. The observed form of the modern Greenland ice sheet will be used to tune these rheologies (through the choice of / in Equation (1)) in order to account for the important influence of the anisotropy known to be characteristic of glacier and ice-sheet ice. Models based upon these tuned rheologies are then used in climate-forced reconstructions of the LGM Laurentide ice sheet. We show that the aspect ratio of the Laurentide ice sheet predicted by the Glen based thermomechanical calculation is far too large to fit the observations. It can only be corrected by arbitrarily speeding up the rheology by a factor of approximately 20 over that required by the model to represent the influence of anisotropy when fitting the form of the existing Greenland ice sheet. This seems to be entirely implausible unless the influence of sliding/soft-sediment deformation is much more extreme than usually thought possible. However, when the GBS model is tuned to Greenland and then employed to predict the LGM Laurentide complex, the severity of the aspect-ratio paradox is dramatically reduced at least and eliminated entirely at best.
On the basis of previous laboratory creep measurements (e.g. Reference Pimienta and DuvalPimienta and Duval, 1987), theoretical analyses of fabric development in polycrystalline ice (Reference Castelnau, Duval, Lebensohn and CanovaCastelnau and others, 1996) and studies of dynamic recrystallization and texture development in deep ice cores from Antarctica and Greenland (e.g. Reference AlleyAlley, 1988,Reference Alley1992; Reference De La Chapelle, Castelnau, Lipenkov and DuvalDe la Chapelle and others, 1998), strong evidence has accumulated that natural ice sheets do not have their flow controlled by a grain-size-sensitive diffusion-accommodated GBS mechanism (see Reference Duval, Arnaud, Brissaud, Montagnat and de La ChapelleDuval and others, 2000); a Newtonian n = 1 mechanism known to destroy texture. Rather, the process that controls the creep rate more strongly appears to Duval and colleagues to be the rotation of crystals by dislocation glide and strain-induced boundary migration; processes that nicely explain the high degree of crystalline anisotropy characteristic of ice-sheet ice fabric and an anisotropy that is associated with the increasing alignment with depth of the c axes of individual crystals into the vertical direction. As it happens, and as discussed in greater detail below, these processes support a stress-strain-rate relation that is essentially identical with the non-Newtonian dislocation-accommodated GBS mechanism interpreted by Reference Goldsby and KohlstedtGoldsby and Kohlstedt (1997a, b) as explaining the results of the Minnesota experiments. When mediated by the migration of dislocations, rather than by diffusion, the GBS mechanism does not in fact destroy texture but very efficiently generates it. It seems clear, therefore, that the Minnesota results are not in any conflict with the ideas of Duval and colleagues discussed above, but rather should be seen as fully supportive of them.
2. The Rheology of Glacial Ice
The rheology of isotropic polycrystalline ice in axial com-predion is typically described by a flow law of the following power-law form:

The materials parameter B contains both the exponential temperature dependence of the flow rate and any effects of grain-size on creep rate. The isotropic form of the flow law commonly used for ice has come to be known as Glen’s law after the pioneering experiments of Reference GlenGlen (1955). He determined a value for the stress exponent of n ≪ 3 from laboratory experiments on ice samples with relatively coarse grain-sizes (∼1 mm) that were deformed at stresses of 0.1–1MPa. Since his initial study numerous other experimental investigations of the rheology of coarse-grained samples (d≈1mm) have yielded results similar to Glen’s over similar ranges of stress (e.g. Reference SteinemannSteinemann, 1954; Reference Mellor and TestaMellor and Testa, 1969; Reference Barnes, Tabor and WalkerBarnes and others, 1971).
To facilitate further discussion, it is instructive to rewrite Equation (2) in the more explicit form of Equation (1) so as to fully display the nature of the temperature dependence and the effect of grain-size on strain rate. AtT ≤ 260 K, the activation energy for creep is - 6 0 kJ mol−1, approximately equal to that for volume self-diffusion in ice (Reference RamseierRamseier, 1967). At T > 2 6 0 KJ, the apparent activation energy for creep increases. This increase, which is not observed for ice single crystals, apparently results from "pre-melting" (Reference Dash, Fu and WettlauferDash and others, 1995) and has been documented by numerous experimental studies at ambient pressure (e.g. Reference SteinemannSteinemann, 1954; Reference GlenGlen, 1955; Reference Mellor and TestaMellor and Testa, 1969; Reference Barnes, Tabor and WalkerBarnes and others, 1971). The creep rate of ice is generally treated as if it is independent of grain-size, even though the effect of grain-size on the B parameter in Glen’s law has been investigated.
Recently, a large body of new rheological data for dislocation creep of ice has been acquired at high confining pressures (Reference Kirby, Durham, Beeman, Heard and DaleyKirby and others, 1987; Reference Durham, Kirby and SternDurham and others, 1992). The experiments were conducted at constant strain rate in a gas-medium high-pressure apparatus on samples with grain-sizes >200 μm. High confining pressures allow larger differential stresses to be explored without inducing the microcracking that would lead to catastrophic failure of unconfined samples at the same stresses. Since the strength of ice increases exponentially with decreasing temperature, high confining pressures also allow the exploration of creep at lower temperatures than is practical in ambient-pressure experiments. The flow-law parameters obtained in these high-pressure studies are included in Table 1. Over nearly the entire 195–258 K temperature range, these experiments consistently yield a stress exponent of 4.0. At the lowest temperatures (<195K) and therefore the highest stresses, the value of the stress exponent increases from 4.0 to 5.6. This increase in n has been attributed to onset of the breakdown of the power-law creep equation, that is Equations (1) and (2) (personal communication fromW. Durham to D. Goldsby and D. Kohlstedt, 1999). For the strain rate and temperature conditions investigated, these constant-strain-rate experiments indicate that the flow stress is independent of grain-size for grain-sizes of∼0.2–2.5 mm.
Flow-law parameters for tee I at confining pressure of 50 MPa (Reference Durham, Kirby and SternDurham and others, 1992)

Creep data for polycrystalline ice from the high-pressure experiments and from numerous ambient-pressure studies, including Reference GlenGlen (1955), are plotted as ε vs a in Figure 1. Also plotted are data for ice single crystals oriented for both basal slip (Reference Wakahama and OuraWakahama, 1967) and non-basal slip (Reference NakayaNakaya, 1958; Reference Higashi and OuraHigashi, 1967; Reference Wakahama and OuraWakahama, 1967; Andermann, 1982, from Reference Duval, Ashby and AndermanDuval and others, 1983). Basal-slip single crystals yield a stress exponent of about 2.5. Thε stress exponent for non basal-slip crystals is more difficult to determine accurately, since slight misorientation of the sample gives rise to significant basal slip. Individual datasets for non basal slip typically yield a stress exponent of ∼ 3, whereas a least-squares fit of the entire non basal-slip dataset in Figure 1 suggests a higher value close to 4.
Plot of strain rate,  vs stress, a, comparing creep data for polycrystalline and single-crystal ice samples at 263 K. Data for basal-slip single crystals are indicated by the uppermost dataset which yields a slope of∼2.5; all other single-crystal data are for non basal slip. The Glen flow law is indicated by the dashed line of slope 3 High-pressure data of Durham and others are indicated by the dashed-dotted line of slope 4.
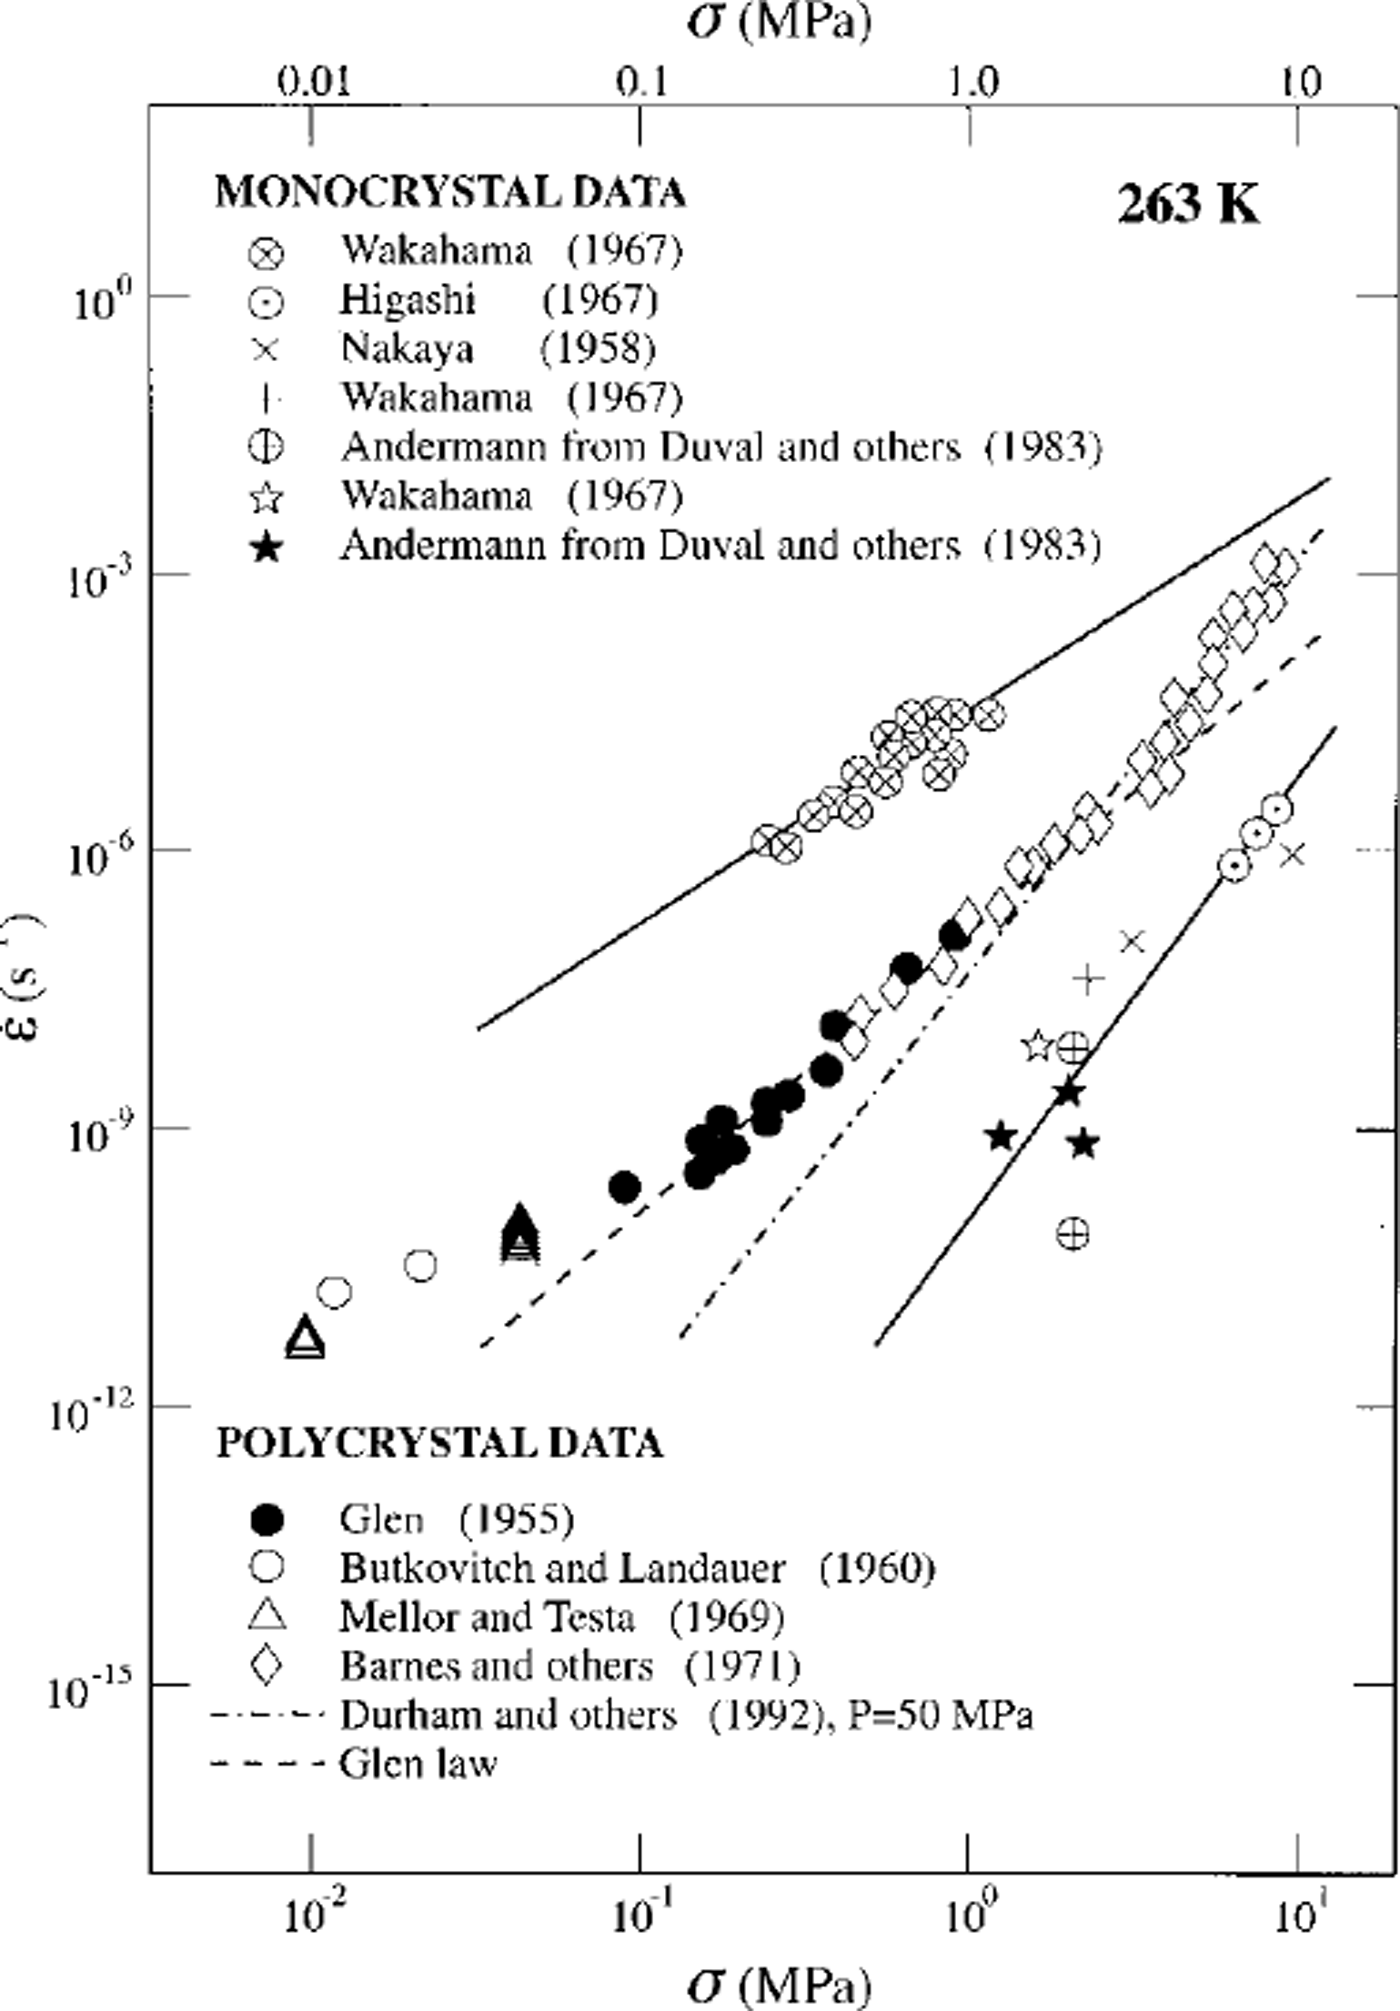
Results from several ambient-pressure laboratory deformation studies on coarse-grained polycrystalline ice at low stresses suggest that a transition to a deformation mechanism characterized by 1 ≤ n φ2 occurs below a stress of∼0.1 MPa (Reference SteinemannSteinemann, 1954; Reference GlenGlen, 1955; Reference Jellinek and BrillJellinek and Brill, 1956; Reference Butkovich and LandauerButkovitch and Landauer, 1960; Reference Mellor and SmithMellor and Smith, 1966; Reference Bromer and KingeryBromer and Kingery, 1968; Reference Mellor and TestaMellor and Testa, 1969; Reference Colbeck and EvansColbeck and Evans, 1973; Reference Pimienta and DuvalPimienta and Duval 1987). A subset of these data is plotted in Figure 1 for comparison with both coarsegrained polycrystalline ice at higher stresses and with single-crystal data. The high-pressure data (Reference Kirby, Durham, Beeman, Heard and DaleyKirby and others, 1987; Reference Durham, Kirby and SternDurham and others, 1992), coupled with these low-stress ambient-pressure data, suggest that with decreasing stress a transition occurs from dislocation creep, characterized by n = 4, to grain-size-sensitive flow, characterized by n ≤ 2. These data also suggest that Glen’s flow law, shown as a dashed line in Figure 1, is not characteristic of a single-creep mechanism, but is rather a composite flow law containing contributions of both dislocation creep and grain-size-sensitive flow. If this transition to grain-size-sensitive flow at low stress is real, it is clear that the flow of ice cannot be described accurately by a constitutive law, such as Glen’s, containing a single power law; rather, the constitutive law for the flow of ice must contain the contributions of at least two different flow laws, that is, two different mechanisms of deformation.
However, the low-stress data of Figure 1 were all acquired at impractically slow laboratory strain rates of ≤ 10–8 s−1, such that they may contain substantial contributions from transient creep (see Reference JackaJacka, 1984b; Reference Budd and JackaBudd and Jacka, 1989). These data alone cannot then be used as reliable indicators of steady-state, grain-size-sensitive flow (see Reference JackaJacka, 1984a, Reference Jacka1994, for discussions on the grain-size dependence of the flow law). As indicated in Equation (1), in the grain-size-sensitive flow regime the strain rate is proportional to 1/dP with p = 1 to 3, such that the creep rate increases with decreasing grain-size. Therefore, reliable determination of the flow law for grain-size-sensitive creep of ice at practical laboratory strain rates requires the development of techniques to fabricate and deform fine-grained ice.
2.1. Rheology of fine-grained ice
A series of ambient-pressure experiments on fine-grained ice has been conducted to investigate both grain-size-sensitive and "pure"-dislocation creep processes (Reference Goldsby and KohlstedtGoldsby and Kohlstedt, 1997b). Recently developed techniques (Reference Goldsby and KohlstedtGoldsby and Kohlstedt, 1997b) have allowed the fabrication of samples with uniform grain-sizes of 3–200 μm for the first time. The use of fine grain-sizes has several advantages: First, fine grain-sizes allow grain-size-sensitive creep mechanisms to be studied at practical laboratory strain rates. Second, fine grain-sizes increase the fracture strength a{
(since  thereby increasing the practical range of stress that can be used in unconfined-creep experiments by up to one order of magnitude. Third, fine grain-sizes allow creep mechanisms to be characterized at lower temperatures, avoiding the increase in apparent activation energy that occurs at high temperatures due to pre-melting. Experiments were conducted at temperatures of 170 ≤ T ≤ 268 K, stresses of 0.2 ≤ a ≤ 20 MPa, and stτain τates

Creep results from this study (see Reference Goldsby and KohlstedtGoldsby and Kohlstedt, 1997b; figs 7 and 8) are summarized as vs
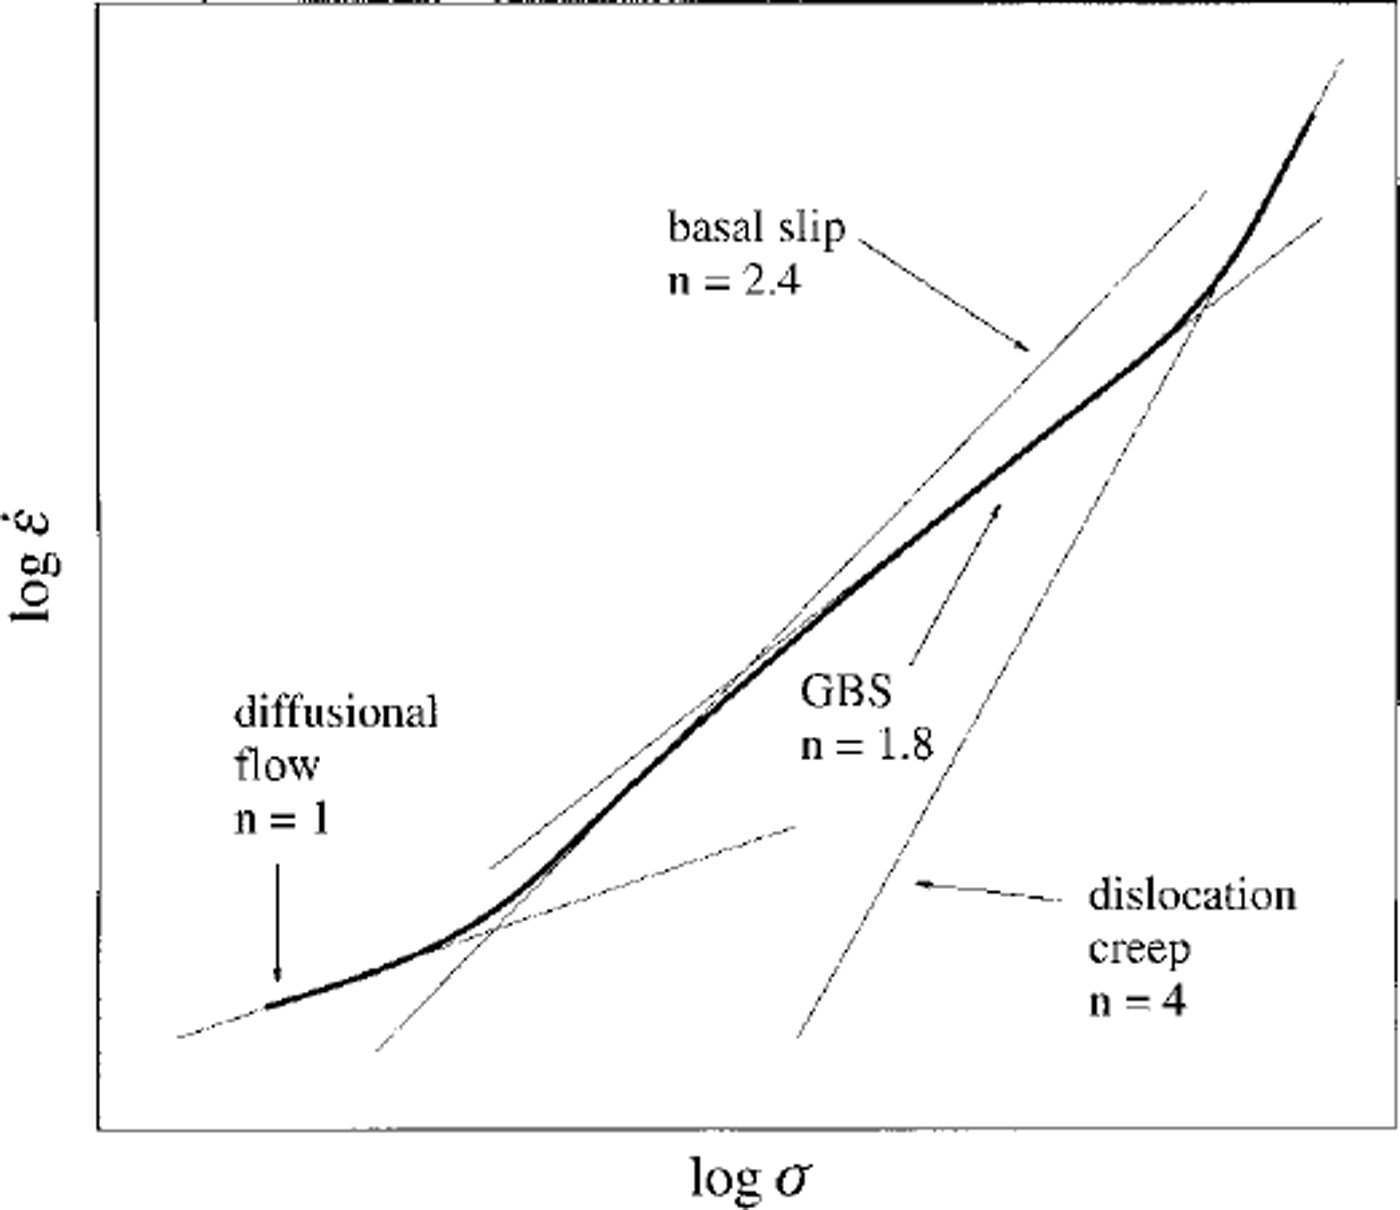
a in Figure 2. Three creep regimes can be identified in the experimental data. At the highest stresses, the fine-grained ice samples flow by dislocation creep with n = 4. These data are in excellent agreement with the high-pressure dislocation-creep data of Reference Durham, Kirby and SternDurham and others (1992) on coarse-grained ice, differing in strain rate by at most a factor of 1.3 (see Reference Goldsby and KohlstedtGoldsby and Kohlstedt, 1997b; fig. 7). With decreasing stress, a transition occurs to a GBS-creep regime with n=1.8 (we actually employ n = 1.7 below in modelling the Wisconsinan Laurentide complex as this provides a marginally better fit to the data). Finally, at the lowest stresses used, the creep rate of the fine-grained polycrystalline samples is rate-limited by basal slip with n = 2.4. If it exists, the diffusion-creep regime for ice with n = 1 must occur at still lower stresses.
Schematic plot vs a illustrating Reference Goldsby and KohlstedtGoldsby and Kohlstedt’s (1997b) creep results for fine-grained ice. Three creep regimes are identified: dislocation creep characterized byn = 4; GBS creep characterized by n =1.8; and basal-slip-limited creep characterized by n = 2.4. A transition to diffusional flow, with n = 1, is anticipated at the lowest stresses.
The rheology of polycrystalline ice can be described as follows:
At the highest stresses, in the dislocation-creep regime characterized by n = 4, the GBS mechanism is slower than non-basal slip and multiple-slip systems including non basal-slip systems are required for compatible deformation. With decreasing stress, the creep rate due to GBS becomes faster than non basal slip, such that GBS in series with basal slip is now sufficient for compatible deformation. The slower of these two processes limits the creep rate.
At intermediate stresses, in the GBS-creep regime charac n=1.8 terized by the creep rate is limited by GBS which is slower than basal slip. It is important to note that the existence of the transition to an n ≤ 2 regime is entirely consistent with the results of Reference Duval and CastelnauDuval and Castelnau (1995) as sketched, for example, in Reference Castelnau, Duval, Lebensohn and CanovaCastelnau and others (1996; fig. 2) although these authors do not associate this regime with the dislocation-accommodated GBS mechanism.
At the lowest stresses, in the basal-slip-limited regime characterized by n = 2.4, the creep rate is limited by easy slip, which is slower than GBS. A transition to diffusion creep is expected at the lowest stresses (e.g. Reference MukherjeeMukherjee, 1971)
2.2. New constitutive law
To describe the flow of ice over a wide range of stress and temperature conditions, a constitutive relationship of the following form has been proposed (Reference Goldsby and KohlstedtGoldsby and Kohlstedt, 1997a):

where the subscripts have the following meanings: diffdenotes diffusion creep, es indicates easy slip on the basal-slip system for ice single crystals, GBS denotes dislocation-accommodated grain-boundary-sliding creep, and disl specifies dislocation creep. Each of the terms that contributes to  in the constitutive equation given by Equation (3) can be described by a flow law of the form expressed in Equation (1). All of the parameters have been determined experimentally for each flow law for all of the creep mechanisms included in Equation (3), except for diffusion creep. The diffusion-creep rate has been estimated using the diffusion-creep equations (Reference NabarroNabarro, 1948; Reference HerringHerring, 1950; Reference CobleCoble, 1963) combined with the materials parameters for ice given by Reference Frost and AshbyFrost and Ashby (1982). To estimate the diffusion-creep rate, we computed a value for the grain-boundary diffusivity by assuming that the activation energy for grain-boundary diffusion is equal to that for GBS creep (our n = 1.8 regime), namely 4 9 k J mol–1 in accordance with models of dislocation-accommodated GBS (e.g. Reference MukherjeeMukherjee, 1971). We also assumed a value for the pre-exponential term for grain-boundary diffusion equal to that for volume diffusion (Reference RamseierRamseier, 1967), following the approach used by Reference Frost and AshbyFrost and Ashby (1982). We employ volume-diffusion parameters from Reference RamseierRamseier (1967). The strain rate due to basal slip was taken from Reference Wakahama and OuraWakahama (1967). Flow laws for dislocation-accommodated GBS creep and pure-dislocation creep were derived from creep data from the Minnesota experiments (Reference Goldsby and KohlstedtGoldsby and Kohlstedt, 1997b).
2.3. Compaτison with pτevioUs laboτatoτy and field data
To test thε applicability of this constitutive law to thε flow of glaciers, we extrapolate Equation (3) to larger grain-sizes more characteristic of natural ice bodies. We then compare the predictions of the constitutive equation with laboratory data from published creep experiments on coarse-grained ice samples and with field data from observations of thε flow of ice in glaciers. To extrapolate the relation described by Equation (3) to the full range of glaciologically significant temperatures, the increase in apparent activation energy, which occurs for both the GBS-creep regime and dislocation-creep regime (see below), must be determined. In the following section, we discuss the enhancement in the GBS-creep rate observed experimentally for T > 255 K and the techniques used to determine the enhancement in dislocation-creep rate at similar temperatures.
2.3.1. The effect of pre-melting on creep rate
Pre-melting in ice begins at temperatures below the melting point (Reference Dash, Fu and WettlauferDash and others, 1995). The presence of liquid water in ice enhances the creep rate, in both the GBS- and dislocation-creep regimes, as will be shown below. This increase in the creep rate is manifested as an increase in the apparent activation energy for creep. Reference Goldsby and KohlstedtGoldsby and Kohlstedt (1997b) have determined the increase in apparent activation energy for GBS experimentally at temperatures up to 268 K and on this basis approximate the activation energy for GBS above 255 K as l97kJmor1.
The activation energy for dislocation creep is more difficult to quantify. Most of the experimental data attributed to dislocation creep were actually obtained near the transition between dislocation creep and dislocation-accommodated GBS creep. As a result, these experiments yield an intermediate or transitional value of n = 3 for the stress exponent rather than a value characteristic of either true dislocation creep (n = 4) or of GBS creep (n = 1.8). The apparent activation energy in the experiments that yield n = 3 is thus a complex average of the activation energies for premelting-enhanced dislocation creep and dislocation-accommodated GBS creep.
We therefore adopt the following procedure to estimate the enhancement in the dislocation-creep rate due to premelting. We first calculate the dislocation-creep rate at a given temperature above 255 K using the dislocation-creep parameters (determined below 255 K) in Table 2. These calculated values of the dislocation-creep rate are then compared with previous experimental data for coarse-grained ice at the same temperature. Previous data are chosen for which the stress exponent at the highest stresses is equal to - 4 (e.g. Reference SteinemannSteinemann, 1954; Reference Barnes, Tabor and WalkerBarnes and others, 1971) to insure that samples were deforming by dislocation creep only. We then determine the strain-rate enhancement required to reconcile calculated values of the dislocation-creep rate with those from previous studies. The results of this procedure deliver an apparent activation energy for dislocation creep ( n = 4 )of 2 2 0 k J mol−1 forT> 255 K.
Flow-law parameters from Reference Goldsby and KohlstedtGoldsby and Kohlstedt (1997b) and this study
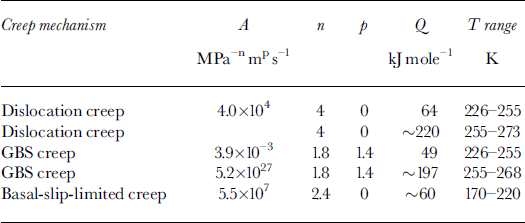
With these values for the apparent activation energies for GBS creep and dislocation creep at T > 255 K and the estimated values for the rate of diffusional flow, our constitutive equation describing the flow of ice over a wide range of conditions can now be extrapolated to the larger grain-sizes typically used in most previous laboratory experiments and which are also more characteristic of glacial ice.
2.3.2. Comparison with previous laboratory data
To test the applicability of our constitutive equation to the flow of coarse-grained ice, we extrapolate Equation (3) to larger grain-sizes and compare with creep data from previous laboratory experiments. As already discussed, a number of data from previous laboratory studies suggest that a transition to grain-size-sensitive flow, characterized by a stress exponent φ2 occurs at a stress of ∼ 1 MPa and a strain rate of ∼10–6−1 (Reference SteinemannSteinemann, 1954; Reference GlenGlen, 1955; Reference Jellinek and BrillJellinek and Brill, 1956; Reference Butkovich and LandauerButkovitch and Landauer, 1960; Reference Mellor and SmithMellor and Smith, 1966; Reference Bromer and KingeryBromer and Kingery, 1968; Reference Mellor and TestaMellor and Testa, 1969; Reference Colbeck and EvansColbeck and Evans, 1973; Reference Pimienta and DuvalPimienta and Duval, 1987). In the vs a plot of Figure 3a, we compare our constitutive equation (solid curve) with previous laboratory creep data for coarse-grained samples deformed at temperatures close to the melting point (Reference GlenGlen, 1955; Reference Mellor and TestaMellor and Testa, 1969; Reference Barnes, Tabor and WalkerBarnes and others, 1971). Grain-sizes are not reported in Glen’s paper; initial grain-sizes of ∼ 1 mm are reported in Reference Mellor and TestaMellor and Testa (1969) and Reference Barnes, Tabor and WalkerBarnes and others (1971). These experiments were conducted for extended periods of time at temperatures close to the melting point. For example, the total duration of the creep tests reported in Mellor and Testa is ∼250 days. Similarly, the low-stress data points were acquired by Barnes and others over periods of up to 100 days. It is likely that significant grain growth occurred during these long-duration experiments at temperatures close to the melting point. We therefore calculate our constitutive equation for a grain-size of 3 mm. As can be seen from Figure 3a, our constitutive equation, calculated for a grain-size of 3 mm, is in excellent agreement with previous data for coarse-grained ice deformed near the melting point, differing in strain rate by less than a factor of 1.2.
(a) Plot ofe vs a comparing Equation (3) with creep data on coarse-grained ice at temperatures near the melting point. The solid curve is the constitutive equation calculated for a grain-size of 3 mm. The creep data indicate a transition from dislocation^ (n = 4) to GBS creep (n =1.8) with decreasing stress, (b) Plot of effective strain rate vs effective shear stress comparing the Equation (3) with data from field experiments on glaciers. Parallelogram indicates the stress-strain rate conditions of Hooke’s experiment for which a stress exponent ofn = 1.65 was determined. The constitutive law is calculated for grain-sizes of 1 mm (uppermost curve), 5mm (middle curve), and 100 mm (lowermost curve), all at 273 K. Note that strain rate is independent of grain-size in the dislocation-creep regime at stresses above –1 MPa. The 100 mm curve indicates that GBS creep should be the rate-limiting creep mechanism below a stress of ∼0.02 MPa.

The excellent agreement between this composite constitutive equation and laboratory creep data for coarsegrained ice demonstrates that these previous low-stress data indeed indicate a transition from dislocation creep (n =4) to dislocation-accommodated GBS creep (n = 1.8) with decreasing stress. Furthermore, this comparison strongly suggests that transient creep did not contribute significantly to the creep rate in these previous experiments at low stresses in the GBS-creep regime, although this has been shown to be a very serious problem in some previous experiments that revealed stress exponents n ≤ 2 (see Reference Budd and JackaBudd and Jacka, 1989; Reference JackaJacka, 1984b). Finally, the transition to GBS creep at low stresses indicates that Glen’s law, a single-power-law expression obtained over a limited range of stress, cannot be used to accurately describe the flow of ice at glaciologically significant stresses less than ∼0.2 MPa (precisely the stress range previously identified by Reference Pimienta and DuvalPimienta and Duval (1987) as the regime in which the Glen law was inappropriate).
2.3.3 Comparison with field results
To test the applicability of our constitutive law to the flow of glaciers, we extrapolate Equation (3) to large grain-sizes more characteristic of natural ice bodies and compare with data from field studies of glacier flow. A number of field experiments have been conducted to determine the relationship between strain rate and stress in glaciers (e.g. Reference Geττaτd, Perutz and RochGerrard and others, 1952; Reference NyeNye, 1953; Reference MeierMeier, 1960; Reference Holdsworth and BullHoldsworth and Bull, 1970; Reference HookeHooke, 1973; Reference Doake and WolffDoake and Wolff, 1985; Reference Lliboutry and DuvalLliboutry and Duval, 1985). In them strain rates were determined from measurements of the deformation of the ice, e.g. from measurements of borehole deformation, tunnel contraction or strain-net deformation. Stresses cannot be determined directly and are therefore calculated from a stress analysis. Shear stress, r, as a function of depth is assumed to be given by

where ρ is the density of the ice, h is the depth below the surface of the ice cap and a is the surface slope of the glacier.
A number of these studies appear to indicate that the flow of glacier ice is characterized by a stress exponent φ2 at effective shear stresses ≤0.1MPa (e.g. Reference Geττaτd, Perutz and RochGerrard and others, 1952; Reference NyeNye, 1953; Reference MeierMeier, 1960; Reference Holdsworth and BullHoldsworth and Bull, 1970; Reference HookeHooke, 1973; Reference Doake and WolffDoake and Wolff, 1985; Reference Duval and CastelnauDuval and Castelnau, 1995; Reference Pimienta and DuvalPimienta and Duval, 1987). For example, the jungfraufirn borehole results (Reference Geττaτd, Perutz and RochGerrard and others, 1952) yield a stress exponent of ∼ 1.5 over the stress range 0.02 ≤ r ≤ 0.1 MPa (Reference NyeNye, 1953). Similarly, field measurements of the flow of Saskatchewan Glacier, Canada, by Reference MeierMeier (1960) indicate a transition to a creep mechanism with n φ2 at shear stresses less than approximately 0.1 MPa. Meier interpreted these field results (as is now clearly incorrect) as indicating a transition to diffusion^ flow (n = 1) at low stresses. Results of a field study of Meserve Glacier by Reference Holdsworth and BullHoldsworth and Bull (1970) indicated a transition from a creep mechanism characterized by n = 4.5 at higher stresses to n = 1.9 at lower stresses, in remarkably good agreement with the new results from the Minnesota experiments. Finally, Reference HookeHooke (1973) obtained a stress exponent of 1.65 over the shear stress range 0.014 ≤ r ≤ 0.033 MPa in a field experiment on Barnes Ice Cap, Canada.
We compare predictions of the new constitutive equation, Equation (3), with a subset of the results listed above (Reference Geττaτd, Perutz and RochGerrard and others (1952) as re-analyzed in Reference NyeNye, 1953; Reference MeierMeier, 1960; Reference HookeHooke, 1973) in the effective strain-rate vs effective shear-stress plot of Figure 3b. The effective strain rate is given by  and the effective shear stress by
 We extrapolate Equation (3) to grain-sizes of 1 and 5 mm. The studies of Nye and of Meier are for temperate glacier ice, whereas Hooke’s is for ice with a temperature of ∼ 2 6 3 K. For clarity, we calculate Equation (3) at a temperature of 273 K. The curve for d = 1 mm is the upper curve in the plot, the d = 5 mm curve is the middle curve and the lower curve is for d = 100 mm.
As shown in Figure 3b, we obtain very good agreement between our constitutive equation and results from field experiments. Nye’s analysis of the jungfraufirn borehole data of Reference Geττaτd, Perutz and RochGerrard and others (1952), for example, yields results that differ by less than a factor of 1.5 from predictions of the constitutive equation for a grain-size of 5 mm. Similarly, the results of Reference MeierMeier (1960) differ in strain rate by less than a factor of 2 from predictions of the constitutive equation for the same grain-size. This excellent agreement between our constitutive equation and field data strongly suggests that the creep rate of glacier ice is rate-limited by dislocation-accommodated GBS. Furthermore, this agreement demonstrates that the Glen flow law, a single-power-law expression containing the contributions of both dislocation-accommodated GBS creep and dislocation creep, cannot be employed to accurately describe the flow of ice at shear stresses less than ∼0.1 MPa, in complete agreement with the previous conclusion of Reference Pimienta and DuvalPimienta and Duval (1987).
In summary, shear stresses within large continental ice sheets, such as that on Greenland, are typically of order 10−2 MPa. Comparisons of our constitutive equation with previous laboratory and field creep data strongly suggest that the dislocation-accommodated GBS-creep mechanism is the rate-controlling creep process over a wide range of grain-size stress-temperature conditions; these conditions overlap those appropriate for large continental ice sheets. For differential stress of order 10−2 MPa, the isotropic form of the GBS flow law yields strain rates 1 to 2 orders of magnitude faster than those calculated from the isotropic form of Glen’s flow law, depending on temperature. Prior to describing the results obtained for Laurentide ice-sheet reconstructions based on the new flow law, it seems appropriate to comment further on the issue of fabric development and flow-law anisotropy in dislocation-accommodated GBS creep.
2.3.4. Lattice-preferred orientation, flow-law anisotropy and GBS
It has long been known that ice in glaciers and ice sheets exhibits significant lattice-preferred orientation (LPO) that increases in strength from the surface of an ice body towards its base (eg. Reference KambKamb, 1959; Reference RigsbyRigsby, 1960; Reference Gow and WilliamsonGow and Williamson, 1976; Reference De La Chapelle, Castelnau, Lipenkov and DuvalDe La Chapelle and others, 1998). It is often supposed that a GBS-creep mechanism is inconsistent with the development of texture, as occurs in glacier ice (Reference Duval, Arnaud, Brissaud, Montagnat and de La ChapelleDuval and others, 2000). Indeed, many studies indicate that GBS accommodated by diffusional flow (i.e. diffusion creep) does not lead to the formation of LPO in initially isotropic materials and also destroys pre-existing texture (e.g. Reference Behrmann and MainpriceBehrmann and Main-price, 1987; Reference Law, Knipe and RutterLaw, 1990; Reference Karato and LiKarato and Li, 1992). In contrast, when GBS is accommodated by dislocation motion, as in the n = 1.8 regime discovered in the Reference Goldsby and KohlstedtGoldsby and Kohlstedt (1997b) study, a strong LPO can develop (Reference Etheridge and WilkieEtheridge and Wilkie, 1979) In the superplasticity literature, for example, a relatively large body of evidence exists which demonstrates that texture develops, and pre-existing texture is modified, in superplastic metals and alloys deformed via dislocation-accommodated GBS in superplastic region II, a creep regime equivalent to the n = 1.8 creep regime in ice (e.g. Reference Naziri and PearceNaziri and Pearce, 1970; Reference Duval-Rivier, Carry and VicensDuval-Rivier and others, 1996; Reference Perez-Prado, Cristina, Ruano and Gonzalez-DoncelPerez-Prado and others, 1998; see Reference Padmanabhan and LueckePadmanabhan and Luecke, 1986, for a review). Furthermore, recent theoretical work suggests that GBS acting in concert with intragranular-dislocation motion can give rise to texture development. Using a numerical model to investigate the effect of GBS on texture development, Reference Zhang, Hobbs and JessellZhang and others (1994) found that a stronger texture can in fact develop when GBS acts in concert with intragranular slip rather than via dislocation slip alone. Hence, rather than arguing against a GBS-creep mechanism (see Reference Duval, Arnaud, Brissaud, Montagnat and de La ChapelleDuval and others, 2000), the presence of texture in glaciers and ice sheets is entirely consistent with GBS accommodated by intragranular-dislocation slip on the basal-slip system, as in the n = 1.8 creep regime described above.
For the simulations of time-dependent ice-sheet form discussed in what follows and which are based on the dislocation-accommodated GBS rheology, the parameters that appear in Equation (1) will be fixed to n = 1.7 and p = 1.4, with (A,Q)= (3.9×10⁻³MPa–1.7s–1m1.4 49 kJ mole−1) for T#φ257K and (A,Q) = (5.19 × 1027 MPa–1.7 s–1 m1.4, 197 kJ mole0−1) for T# > 257 K. By employing these parameters, in place of those appropriate for the conventional Glen rheology listed in the Introduction, we will be able to evaluate the impact that this alternative rheology has upon predicted ice-sheet form directly.
3. Ice-Sheet Rheologigal Control on Ice-Sheet Form
Given the strong case presented in the last section for the use of the "faster-than-Glen" GBS law with n ≤ 2 in the context of ice mechanical simulations of the growth and evolution of continental-scale ice sheets, it seems reasonable to investigate the extent to which the forms of such ice sheets predicted by this rheology would be expected to differ from those based upon the Glen model. Although an initial investigation of this issue was recently described in Reference PeltierPeltier (1998), our goal here will be to investigate these differences in greater detail. To this end, we will briefly review the structure of the thermomechanical model of ice-sheet evolution to be employed in these analyses in section 3.1. The results obtained through application of the model using both the Glen and GBS rheologies are thereafter described in a separate subsection.
3.1. The climate-thermomechanical model of ice-sheet evolution
The model employed to investigate the impact of ice rheology on predictions of ice-sheet form is based upon the early work of Reference Deblonde and PeltierDeblonde and Peltier (1991) whose isothermal model was further developed into a full three-dimensional, state-of-the-art, thermomechanical model by Reference Tarasov and PeltierTarasov and Peltier (1997b, Reference Tarasov and Peltier1999). This ice-dynamics model is asynchronously coupled to an energy-balance model (EBM), used to predict the evolution of surface temperature, and to a local model of the isostatic-adjustment process. When stimulated by variations in the effective solar-insolation derivative of low-frequency variations in the geometry of the Earth’s orbit around the Sun, the coupled model has been shown to deliver an excellent facsimile of the 105year cycle of glaciation and deglaciation that is so apparent in the 5180 proxy records of continental ice-volume variations derived from deep-sea sedimentary cores (Reference Shackleton, Berger and PeltierShackleton and others, 1990). A brief review of this model was recently provided in Reference PeltierPeltier (1998) and no purpose will be served by repeating that discussion here.
3.2. Results from ice-sheet-climate model predictions
Here our goal will be to present and compare the ice-sheet forms predicted for the Greenland ice sheet under modern climate conditions and the Laurentide ice sheet under LGM climate conditions for both the conventional Glen rheology and the new GBS rheology of Reference Goldsby and KohlstedtGoldsby and Kohlstedt (1997b) discussed in section 2. It makes sense to begin presentation of these intercomparisons with the Greenland ice sheet since its modern form is amenable to direct observation.
To this end, in Figure 4, we first show a series of west-east transects across the Greenland ice sheet predicted by the thermomechanical model, taken at 72.75° N for both surface elevation (a) and zonal surface velocity (b), for several different versions of both the Glen and GBS rheologies. In order to fully conform with the EISMINT protocols for the simulation of this present-day ice sheet, we have elected at this stage to bypass the use of the EBM entirely in specifying the time-dependent climate regime that this region has been subjected to. Consistent with EISMINT (Reference Huybrechts and PayneHuybrechts and others, 1996) we have rather elected to employ the ice-core-derived climate-forcing dataset of Reference OhmuraOhmura (1987) based upon the use of oxygen-isotope data to infer the varying temperature of the atmosphere from which Greenland precipitation was derived. It will be clear from Figure 4a that both the 4 × accelerated Glen flow model and the GBS rheology, based upon the assumption of a 1mm grain-size, fit the gridded observations extremely well on this traverse, whereas the 0.5 × GBS and 2 × GBS rheologies deliver too much ice and too little ice, respectively. Complete topographic maps presented previously in Reference PeltierPeltier (1998; plate 13) confirm that these two models, respectively 4 × Glen and 1 mm GBS, fit the entire longitude- and latitude-dependent topography very well. Figure 4b, which shows the zonal component of ice velocity across the same transect, demonstrates that this component of ice velocity reaches very high values on the western flank of the ice sheet.
A series of west-east transects at 72.75° N through the predicted form of the present-day Greenland ice sheet for various ice-sheet rheologies. The climate forcing employed in all cases is that prescribed in the EISMINT II project and based on Reference OhmuraOhmura’s (1987) dataset. The transects in (a) are for surface elevation above sea level and in (b) for the zonal component of the surface velocity. Ice volume (c) and maximum elevation (d) time series from the same set of thermomechanical Greenland simulations employed to construct the present-day cross sections shown in Figure 5.

Probably more informative than these cross sections insofar as the intercomparison of the two rheologies for Greenland is concerned are the time-dependent results presented in Figure 4c which shows the ice-volume time series predicted by the various models and Figure 4d which shows the corresponding time series for maximum elevation. Comparison of these two figures shows that although the 4 × Glen and 1 mm GBS rheologies track each other very well over the entire 250 kyr of the Ohmura forced simulation, the two rheologies predict the same elevation maximum only during the interglacial periods, the Eemean interglacial, approximately 125 kyr ago, and the present Holocene interglacial, respectively. Generally speaking the maximum elevation predicted by the 1mm GBS rheology is as much as 100 m lower than that predicted by the 4 × Glen model. As detailed analyses demonstrate, it is only during the interglacial periods that the average basal-shear-layer temperature of the simulated ice sheet is at its coldest and it is only on these "occasions" that the predictions of the two models agree.
It will be important in these further discussions to appreciate the fact that the GBS rheology is grain-size dependent, as discussed fully in section 2. It is rather fortuitous then that the GBS rheology with a grain-size of 1 mm happens to reproduce the Glen based simulation of Greenland rather precisely. However, the ice fabric in the Greenland Icecore Project (GRIP) core from Summit is not consistent with this grain-size in the deep Wisconsinan section. Rather, as described in detail byReference Thorsteinsson, Kipfstuhl and MillerThorsteinsson and others (1997) the mean grain-size, d, in this part of the core is approximately 2.7 mm (discussed further in section 4). Since the GBS rheology is such that  with p=1.4 we may reinterpret the good fit of the d = 1 mm GBS model to the Greenland observations as equivalent to the fit that would be obtained with d = 2.7 mm but with a speed-up factor of / - 4. The "speedup factor" itself may be taken to represent either the impact of impurities on the strain-rate, realized at a given level of differential stress, or, more reasonably, the impact of the anisotropy of fabric that is produced by alignment of the c axes of individual ice crystals with the local vertical direction (see Reference De La Chapelle, Castelnau, Lipenkov and DuvalDe La Chapelle and others, 1998). This is the same speed-up factor required to fit the form of the modern Greenland ice sheet using the Glen rheology. By tuning the alternate rheologies to Greenland in this way, we are attempting to fully incorporate the influence of a fabric anisotropy that is known to lead to an enhancement of the strain rate, as predicted by an isotropic rheology, by as much as an order of magnitude. Reference Dahl-Jensen and GundestrupDahl-Jensen and others (1987) infer a speed-up due to this cause that is very close to a factor of 4 in their analysis of Greenland data. In this initial analysis we have determined that the apparent acceleration in the bulk behaviour of the Greenland ice sheet, due to this cause, is by a factor of approximately 4.
The primary issue we wish to address is whether or not either of these rheological models, tuned to modern Greenland, are capable of accurately predicting the form of the LGM Laurentide ice sheet complex inferred on the basis of geophysical inversions of relative sea-level data, as first discussed in Reference PeltierPeltier (1994). These inferences, and the basis upon which they have been made, have been reviewed in detail in Reference PeltierPeltier (1998). In order to make glaciological predictions of the LGM Laurentide complex to compare with the geophysical inference, we must integrate the full climate-thermomechanical model whose detailed structure was described recently by Reference Tarasov and PeltierTarasov and Peltier (1999). We initiate these integrations at the time of the Eemean interglacial approximately 125 kyr before present. They are all forced with precisely the same orbital-insolation variability and employ precisely the same physics, differing only in the internal rheology assumed to govern the flow of the evolving ice sheets.
We begin our discussion of the results of this very comprehensive set of model integrations by focusing on the form of the Laurentide complex predicted using the "corrected-for-anisotropy’ form of the Glen model with / = 4. The predicted LGM form of the North American ice-sheet complex at 21 kyr before present is shown in Figure 5a and b in terms of elevation above sea level (a) together with the accompanying basal-temperature map (b). Comparing this LGM Laurentide prediction with the geophysical inference (see Reference PeltierPeltier, 1998; plates 8 and 9) it will be clear that the Greenland-tuned Glen model delivers an ice cover that is much less extensive in area than that which is known to have existed at LGM based upon the detailed geomorphological analyses of Reference Dyke and PrestDyke and Prest (1987). The Laurentide and Cordilleran complexes do not merge over the Canadian Prairies and the southern extent of the Laurentide complex, known to have reached the United States-Canadian border in the Prairie regions at LGM and to have extended deep into New England on its southeastern flank, is entirely inadequate. This result for the Glen model may be compared to that obtained using the Greenland-tuned GBS model in Figure 5c and d. It is immediately apparent that the GBS model predicts an LGM North American ice complex that differs significantly from that predicted using the Glen model. In particular, the Cordilleran and Laurentide components of the complex now merge in the north, the Laurentide complex extends much further south and the maximum elevation of the complex is reduced from 3125 m to 2950 m, still somewhat higher than the approximately 2750 m maximum inferred on the basis of geophysical inversion. The GBS-based model is in fact very close to reconciling the geophysical inference without requiring any further modification whereas it has already been demonstrated (Reference Huybrechts and TsiobbelHuybrechts andT’Siobel, 1997; Reference PeltierPeltier, 1998; Reference Tarasov and PeltierTarasov and Peltier, 1999) that, to fit the geophysically inferred thickness and the geomorphologically inferred areal extent, the Glen model must be accelerated enormously from its / = 4 Greenland-tuned form by increasing / by a further factor of at least 20 (see Reference PeltierPeltier, 1998; plate 13). It is clearly difficult, though perhaps not impossible, to accept this as a reasonable consequence of basal sliding/soft-sediment deformation, especially as the core of the Laurentide ice sheet was apparently frozen to crystalline basement (see basal-temperature maps in previously discussed figures).
(a) Planform of the elevation of the Laurentide ice sheet above sea level and (b) the corresponding map of basal temperature for the simulation using the Glen rheology tuned fil the the observed form of the present-day Greenland ice sheet. The calculation was initiated in the Eemean interglacial and employed the energy-balance climate model defined by Equation (5) with explicit orbital forcing to drive ice-sheet evolution, (c) Planform and (d) basal temperature for the Laurentide ice sheet using the GBS rheology of Reference GoldsbyGoldsby and Kohlstedt (1997) tuned to fit the present-day the Greenland ice sheet, (e) Planform and (f) basal temperature for the Laurentide ice sheet based on the GBS rheology tuned to fit the geophysically inferred form of this ice sheet. This retuned model has f increased by a factor of 4 over the value used for modern day Greenlandin the EISMINT II intercomParison.

The differences between various versions of the Glen and GBS based rheologies are further illustrated in Figure 6 where we show north-south surface-elevation transects (a) and basal-temperature transects (b) at 85.25° W. The result, "Tbase, Glen flow", is for the Glen model with / = 80, that is 20 × the value of/ required to tune the model to Greenland. This is the version of the Glen model that best fits the geophysical inference of Laurentide form which is shown in plate 13 of Reference PeltierPeltier (1998). Also shown are results for the Glen model with / = 20 (denoted 0.25 × flow) and for / = 4 (precisely the Greenland-tuned model). Clearly, as / decreases, the southern extent of the Laurentide ice sheet decreases and the maximum topographic height increases, leading to a marked increase in the aspect (height-width) ratio. The results for three versions of the GBS rheology (Fig. 6) show that even with Greenland tuning the southwards extent of the ice sheet is significantly increased and the maximum topographic height reduced. With a speed-up of the GBS rheology by a factor of 2 over Greenland one comes very close to Tbase and with a factor of 4 speed-up one further reduces the aspect ratio beyond the reduction achieved withTbase itself. Clearly then, the difference between the GBS-based rheology tuned to Greenland and that required to reconcile the inferred form of the Laurentide complex is very much less (about an order of magnitude as measured by / ) than the difference between the Glen based rheology tuned to Greenland and that required to reconcile the inferred form of the Laurentide complex. The form of the Laurentide ice sheet predicted using the GBS rheology with / equal to 4 times the Greenland value, together with its basal-temperature map, are shown on Figure 5e and f It should be clear from Equation (1) that the GBS rheology tuned to Greenland could be made to predict the geophysically inferred form of the Laurentide ice sheet exactly if we were to assume a larger grain-size near 5 mm to best characterize the bulk ice caps.
North-south transects at 85.25° W through the predicted LGM form of the Laurentide ice sheet for various theologies with all other properties of the simulations fixed: (a) surface elevation above sea level; (b) basal temperature. Synthetic ice-volume time series using the same range of theologies as in (a) and (b)for the North American (c) and Eurasian (d) ice complexes.
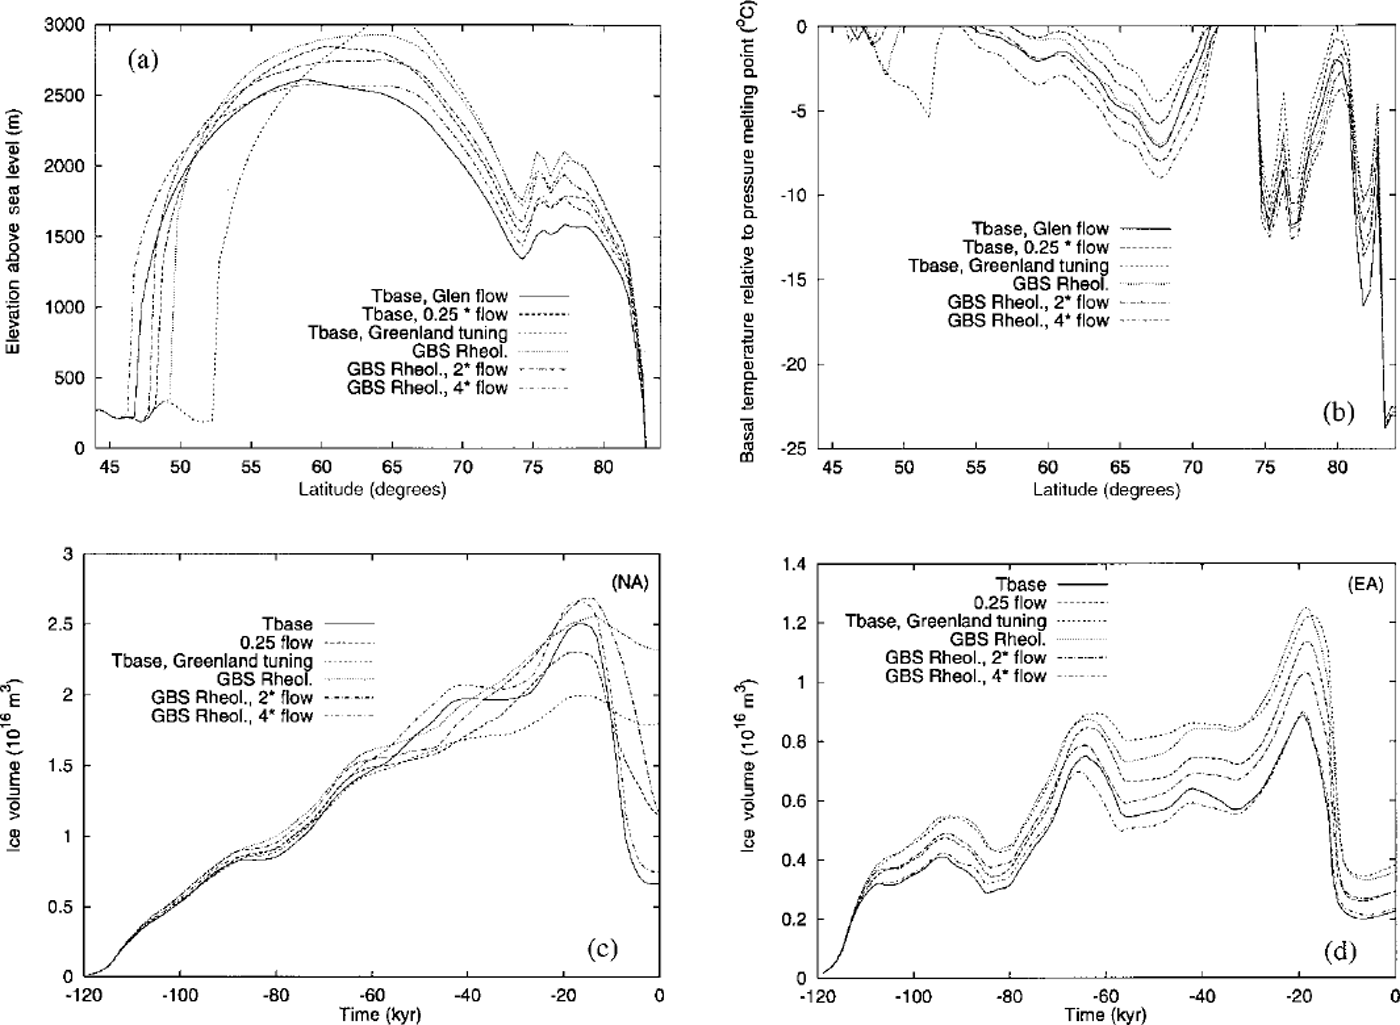
These six different rheologies are further intercompared in Figure 6 in terms of the Eemean to Holocene ice-volume time series predicted using the ice-sheet-climate model. In Figure 6c we show these time series for North America (NA) and in Figure 6d for Eurasia (EA). Since the latter time series are quite sensitive to the assumptions made concerning variations in the strength of the thermohaline circulation, we focus our commentary here on the NA results which are much less sensitive to this contribution to climate variability. These results demonstrate that neither of the Greenland-tuned models (GBS Rheol. and Tbase Greenland tuning) deliver any significant degree of deglaciation subsequent to LGM whereas both the GBS Rheol. (4 × flow) and Tbase models (Glen model with / = 80) lead to very significant although incomplete deglaciation. However, Reference Tarasov and PeltierTarasov and Peltier (1999) show that the extent to which complete deglaciation is achieved is quite strongly dependent upon the numerical resolution of the model. Using higher spatial resolution than employed in Tbase and GBS Rheol. does deliver the more complete deglaciation event that actually occurred.
4. Conclusions
The experimental measurements of the rheology of polycrystalhne ice described above have demonstrated that the conventional Glen flow law provides a good approximation to the stress-strain-rate relation only over a very narrow range of differential stress, the range in which Glen’s original measurements were made. The new measurements on fine-grained "laboratory ice", which have been made over a much wider range of stress, show that there is a transition in the flow law from a dislocation-creep-dominated regime in which the stress exponent n=4 into a dislocation accommodated grain-boundary-sliding regime in which n=1.8. The Glen model appears to be an acceptable approximation only near the corner. For ice with a 1mm grain-size, this corner is located just below IMPa of differential stress at a temperature of 250 K and just above 1 MPa of differential stress at a temperature of 273 K. Since the stress regime in which continental-scale ice sheets are mobilized lies below this corner, it seems not only possible, but actually expected, that their flow should be governed by the dislocation-accommodated GBS rheology rather than by the pure-dislocation-creep rheology that is adequately approximated by the Glen model only near the "corner". Previous analyses by Duval and colleagues (Reference Duval, Arnaud, Brissaud, Montagnat and de La ChapelleDuval and others, 2000) have also suggested very strongly that the stress exponent n was less than 2 in the same low-stress regime in which the dislocation-accommodated GBS mechanism is rate controlling in the Minnesota experiments on fine-grained ice. However, the mechanism which they invoke to explain their observations is not GBS. That it could not be diffusion-accommodated GBS, a Newtonian law with n = 1, is strongly suggested by the fact that this mechanism cannot be responsible for generating the crystalline anisotropy that is so clearly evident in the GRIP and Greenland Ice Sheet Project Two (GISP2) ice cores from central Greenland and from Antarctic ice cores. However, when GBS is accommodated by the migration of dislocations, rather than by diffusion, the mechanism does not destroy texture, but rather produces it by allowing individual grains in the polycrystal to rotate so as to achieve a vertical alignment of their c axes. It therefore seems clear that the dislocation-accommodated GBS mechanism, so clearly revealed in the Minnesota experiments, is in complete accord with the previously referenced ideas of Duval and colleagues.
In the present paper we have extended the initial cursory discussion of the impact of ice-sheet rheology on ice-sheet form and history presented in Reference PeltierPeltier (1998) considerably by providing a detailed assessment of the different predictions that these two rheologies, Glen and GBS, make of the LGM Laurentide ice sheet when the rheologies are tuned to Greenland so as to control for the speed-up due to anisotropy. In this way we are able to separate the impact due to anisotropy from the impact due to the isotropic form of the flow law itself. Although both rheologies require an enhancement of the Greenland-tuned rheology in order to fit the geophysically and geomorphologically inferred form of the Laurentide ice sheet (though / in Equation (1)), the enhancement that is required using the GBS-based model is approximately an order of magnitude smaller than the factor of 20 enhancement that must be employed using Glen’s flow law and may be reduced to zero by an appropriate choice of grain-size. In our view, the enhancement of the flow laws required to hit the modern Greenland target is most probably attributable to the crystalline anisotropy that is observed to develop at depth in the ice sheet due to c axis alignment of the individual crystal grains. Although one might ascribe the small additional enhancement, required by the GBS model in order to fit the LGM Laurentide ice sheet, to the influence of sliding/soft-sediment deformation at the base, the much larger enhancement required by the Glen model seems much less plausibly attributable to this cause. Since the experimental basis on which the Glen model was originally proposed has now been seriously undermined, we should feel no dis-compunction in employing the GBS model for the same broad range of glaciological problems to which the Glen model has been applied in the past. It remains for future work to determine how present understanding will require revision in consequence of such analyses.
Probably the most fundamental conclusion to follow from these analyses concerns the issue of the relative importance of ice rheology and subglacial hydrology/geology in controlling the rate at which continental-scale ice sheets flow over the landscape. The initial response of the glaciological community to publication of the ICE-4G inference of the form of the LGM Laurentide ice sheet (Reference PeltierPeltier, 1994) was that this should be construed as effectively proving the important role played by the deformation of soft sediments at the bed of the ice sheet (Reference Clark, Licciardi, MacAyeal and JensonClark and others, 1996) in controlling the flow rate. The analyses described here and in Reference PeltierPeltier (1998), however, show quite clearly that the rate of internal deformation determined by the rheology of the ice itself could be so important that the role of such subglacial processes in contributing to the control of large-scale ice-sheet form should be seen as minor. It would be of some considerable interest to perform further, perhaps more definitive, tests of the quality of the new GBS rheology in the context of the simulation of continent-scale ice-sheet evolution. The reconstruction of the depth variations of specific isotopic tracers in deep ice cores may provide a means for further testing. Analyses of this kind will be presented in later work.
One specific point, not directly addressed here but requiring further comment in the future, concerns the question of the impact that recrystallization processes have on the effective rheology of the ice sheet. It is well known (e.g. Reference Thorsteinsson, Kipfstuhl and MillerThorsteinsson and others, 1997) that crystal size tends to be rather large (typically of order 10 mm) in the regime of relatively high temperature that obtains near the base of a large continental ice sheet. It might then be expected in this usually critical region, where the vertical shear of horizontal velocity is expected to be largest, that the dynamics would be controlled by the slower creep rate delivered by the n = 4 pure-dislocation mechanism. It seems clear on the basis of existing observations (see Dahl-Jensen and others, 2000, for Greenland) that the horizontal motion tends to concentrate somewhat above the base in the region where the GBS rheology is expected to be controlling and the rheology is therefore "soft’.
Acknowledgements
The authors are grateful for the support provided to the Canadian programme in Climate System History and Dynamics by the Natural Sciences and Engineering Research Council and the Atmospheric Environment Service and from NSERC grant No. A9627 (to W.R.P and L.T.) and through the U.S. National Aeronautics and Space Administration grant No NAG5–4956 (to D.L.G. and D.L.K.)



