Economic problems plagued the federal government under the Articles of Confederation. The government could not regulate commerce or establish commercial policies, it could not tax, and it could not provide enough security to fully stabilize the economy. The Constitutional Convention of 1787 promised to address these concerns as long as delegate preferences and state interests could be sufficiently coalesced. One major impediment to studying delegate preferences, and the extent to which they coalesced, comes from the lack of data on delegate votes. Because the delegates voted in state blocs and wanted to maintain secrecy to promote candid discussions, the convention journal and the notes of James Madison recorded the vote of each state bloc (determined by the majority of its delegation), but rarely recorded the votes of individual delegates. As Alan Gibson (2007) notes, this has seriously hampered the ability of scholars to analyze questions regarding the voting behavior of individual delegates.
Among the more quantitative studies of the economic motivation of the framers is a series of works by Robert McGuire and Robert Ohsfeldt (1984, 1986, 1997), McGuire (2003), and Jac Heckelman and Keith Dougherty (2007). These studies attempt to determine whether economic interests affected delegate voting across the course of the Convention. Unfortunately, these studies are limited to 16 specific motions originally chosen by Forrest McDonald (1958). McGuire and Ohsfeldt claim that the 16 motions are representative of all the issues voted on at the Convention, but some issues in the sample are overrepresented, such as powers of the state governments, while other issues are represented by only one roll call each, such as motions on government spending, taxation, and monetary policy, or ignored altogether, such as regulation of the slave trade (Dougherty et al. 2012).
In this article, we attempt to determine if economic interests and other delegate attributes systematically explain delegate voting behavior on all substantive motions from the Constitutional Convention. We face two difficulties. First, as noted above, actual votes are not known and must be inferred. Second, we need a method of grouping together all of the substantive motions.
One way to overcome the second problem would be to classify delegate votes according to some preconceived scale. The ADA does this when it identifies the “liberal” position on a set of bills for a contemporary congress and calculate the percentage of times a congressperson votes on the “liberal” side of the issue. McGuire and Ohsfeldt (1997) attempt something similar for the Constitutional Convention by assuming the major question at the Convention was whether there should be a more powerful central government. They then discern the pro-national position on each of McDonald's 16 motions and calculate the percentage of pro-national votes for each delegate—which they later use as a dependent variable. Although this approach has its merits, it also has several limitations. First, it is not clear which issue is the most appropriate issue to scale ex ante. Jeremy Pope and Sean Trier (2012) argue that the major question at the Convention was the method of apportionment, William Crosskey and William Jeffrey (1981) claim it was the regulation of commerce, and McGuire and Ohsfeldt (1997) believe it was the strength of the central government. Because scholars have disagreed on the main question of the Convention, it is not clear which issue characterizes the entire Convention. Second, the delegates must perceive the underlying dimension to be the same as the one identified by the researcher in order for the scale to be accurate. To see this, suppose a researcher thought the underlying issue of the Convention was the protection of slavery. The researcher would code a yea vote on the runaway slave clause, which compelled states to return slaves to their masters, and the clause that prohibited the federal government from taxing imported slaves until 1808 as pro-slavery votes. However, if some of the delegates coded were truly motivated by the desire to expand federal power, they would support the former clause and oppose the latter. Such delegates would be coded as mixed on slavery even though their true position on slavery might be entirely consistent. The delegates would appear inconsistent only because they voted according to an attribute other than the one identified by the researcher. Determining how to interpret a “yea” vote on any particular motion thus requires a correct assumption about the most important attribute of voting that is true for all delegates. Third, there would not seem to be a method for testing whether one scale is more accurate than another after several are created. This prevents us from creating a scale for each idea in the literature and testing which one best represents the data. For these reasons, we adopt a method that allows us to discover the latent dimension of the Convention ex post, rather than preconceive it ex ante. The technique allows hundreds of seemingly disparate motions to be scaled without relying on ex ante characterizations.
We proceed by first inferring delegate votes as “yea” or “nay” based on statements made by delegates in debate for all substantive motions at the Convention. Rather than pooling votes directly for empirical analysis, we use spatial modeling techniques to estimate a single dimensional position for each delegate. Positions can be thought of as the relative preferences of the delegates on the issues considered at the Convention assuming a unidimensional scale. Such procedures identify delegates who tend to vote similarly without relying on the content of a motion (such as determining if a “yea” vote on a specific motion would be considered “pro-national,” “pro-slavery,” or “pro-free trade,” etc.).
As explained below, the estimated spatial alignment of the delegates appears to be consistent with a localism to nationalism scale, which lends support for McGuire and Ohsfledt's (1986, 1997) characterization of the Convention. Yet because our scale is interpreted ex post, we were able to include roughly 400 roll calls without using our own personal judgment on how to interpret each roll call first. This might provide a fairer assessment of the underlying dimension of conflict at the Convention. The expanded data set we use allows for more precision in determining the degree of pro-nationalism among delegates than the percentage of supposedly pro-national positions over a small number of roll calls.
After estimating delegate positions, we next seek to explain those positions using regression analysis with a variety of independent variables that reflect various claims regarding the economic interests, political backgrounds, and demographics of the delegates, as well as the interest of their constituents. This step follows in the vein of studies by McGuire and Ohsfeldt (1984, 1986, 1997), McGuire (2003), Heckelman and Dougherty (2007, 2010), and Dougherty and Heckelman (2008), except that our model is broader because we are trying to explain the overall positions representing all roll calls across the entire Convention, rather than an isolated number of roll calls.
Our regressions reveal a strong relationship between the relative positions of the delegates and whether or not they were Anti-Federalists, the number of years they served in legislative, judicial, and/or executive service, if they owned slaves or private securities, and the extent to which their state complied with federal requisitions during the confederation.
A less robust effect is found for the region of the country from which a delegate resides and the population of his state. Some insignificant factors include whether a delegate held public securities, whether he depended upon agricultural income, whether he was a Revolutionary War officer, his religious background, age, and the debt per capita in his state. These results show that economic interests, related to ownership of slaves and private securities, had important effects across the course of the Convention, not just effects on the specific roll calls previously studied. In addition, personal noneconomic characteristics, such as age and religion, are perhaps less important for affecting overall voting at the Convention, despite previous findings in the literature on limited roll calls.
To illustrate the usefulness of our study, we also make out-of-sample predictions for the location of delegates for whom we have too few inferred votes to be included in our initial spatial estimates. We then use the full set of spatial estimates to determine the median delegate for each state and the median state on the floor. We find that median delegates from Georgia and South Carolina were typically pivotal, with the particular state median determined by whether or not New York or New Hampshire attended. This might explain why several prominent clauses in the Constitution favored Southern interests, including the 3/5ths compromise and the protection of the slave trade until 1808. It also might explain important economic clauses such as the prohibition of export tariffs and the barring of state currencies which seem to have aided a young U.S. economy. The Deep South wanted such clauses and was in a fortuitous position to see them included in the final document.
INFERRING DELEGATE VOTES
Because delegate votes were not recorded at the Convention, we first inferred delegate votes for each of the 620 non-procedural motionsFootnote 1 at the Convention (only 569 of which were numbered in the journal) in three steps.Footnote 2 We assigned a delegate the vote recorded for his state if the state only had two delegates in attendance.Footnote 3 By the rules of the Convention, the position of each state (yea, nay, divided) was determined by a simple majority of the state's delegates. Hence, if there were only two delegates in attendance from a state and the state voted yea or nay, we inferred that both delegates voted the same as the vote recorded for their state. For example, on vote 387 to prohibit the states from issuing paper currency, Georgia is recorded as a yea. Thus, Abraham Baldwin and William Few were both coded yea because they were the only members from Georgia present.
Additional delegate votes were then inferred using statements made by the delegates in debate as recorded in the notes of Madison, Robert Yates, Rufus King, and others (collected in Max Farrand 1966). We also used statements from personal manuscripts and speeches published in Farrand's (1966) volume 3 or the supplement (Hutson 1987) if they could be tied to a particular roll call on a particular day. A statement was applied to a vote only if it came from the same debate.Footnote 4 For example, Nathaniel Gorham, a member of the Massachusetts delegation, was inferred as voting nay on vote 387 because in response to the motion to add an absolute prohibition of state currency to Article XII (of the resolves of the Committee of Detail), Gorham said the purpose of the clause was already protected in Article XIII which required the consent of the national legislature for the states to issue currency.
He further claimed “an absolute prohibition would rouse the most desperate opposition from its partizans” (Farrand 1966, vol. 2, p. 439). George Read, from Delaware, strongly opposed paper currency two weeks earlier, but he was not coded on vote 387 because his statement was not directly related to that vote.
After the positions of the delegates were recovered, attendance records were again consulted to determine whether additional delegate votes could be inferred from the state's vote and the fact that each state's vote was determined by a majority of its delegates. For example, Massachusetts was recorded as a yea on vote 387. Because Caleb Strong was absent and Gorham was coded as nay, the two remaining Massachusetts delegates, Elbridge Gerry and King, must have voted yea in order for a majority of the Massachusetts delegation to have voted yea.
These three coding steps produced 5,121 vote inferences, which, as described by Dougherty et al. (2012), represent the largest and most representative data set assembled on constitutional votes.Footnote 5 Our coding results in an average of 93 vote inferences per delegate (19.8 percent of the possible votes among those attending). Baldwin has the most codes with 451 inferences, while William C. Houston (New Jersey), who left the Convention one week after it began, has no codes.
Of the 620 substantive motions, only 398 had at least one delegate on both sides of the issue. W-NOMINATE, the spatial estimation technique described below, requires at least one delegate on each side to be included in the analysis because one-sided roll calls provide no information about relative distances.Footnote 6 Among these 398 roll calls, we were able to record a yea or nay position for an average of 10.3 delegates per roll call. Thus our included sample contains 4,102 usable observations (24.1 percent of the possible votes among those attending).
Can Votes Be Inferred from Statements?
The second step in our coding process implicitly equates a position stated by a delegate with his vote on the issue. In other words, it assumes no strategic “talking.”Footnote 7 This assumption is reasonable for two reasons. First, because votes were taken verbally and sequentially, delegates who stated positions contrary to their vote could incur fairly high costs. Other delegates would notice their inconsistencies and might discount their statements on future votes. Second, in cases where historians believe there was a vote trade (such as preventing Congress from prohibiting the importation of slaves until 1808 traded for rejection of a 2/3rds requirement to pass navigation acts), delegates who were alleged parties to the vote trade stated positions consistent with the vote trade they were about to cast or they remained silent. For example, during a debate over apportionment Sherman called the slave trade “iniquitous” (Farrand 1966, vol. 2, p. 220). But when he later supported a temporary protection of the slave trade as part of an alleged log roll, he said “it was better to let the S. States import slaves than to part with them, if they made it a sine qua non” (Farrand 1996, vol. 2, p. 374). The latter statement was consistent with his vote, even though it may or may not have reflected an intellectually consistent position on imported slaves.Footnote 8
To test this conjecture, we compared “known” votes of the delegates to votes inferred from delegate statements. One set of “known” votes are those with no more than two delegates from a state in attendance. For each of these cases, if a state voted yea or nay (as opposed to divided) both delegates must have voted the same way to be consistent with the position recorded for their state. Following the methods described previously, we asked a coder to infer votes in such cases based on statements made in debate. We then compared these codes to the “known” votes of the delegates.
Of these 61 cases, 58 were in agreement (95 percent). Furthermore, only three statements came from days other than the vote. In all three of these cases, the statement was coded consistent with the delegate's vote. This experiment suggests that the process used to infer votes provides a fairly accurate assessment of actual votes. In other words, cases of strategic talking (where a delegate talks one way but votes another) appears to have been rare.
ESTIMATION OF SPATIAL POSITIONS
After inferring delegate votes, we then estimate a single dimensional scaling of the delegates using a 55 by 398 (delegate by motion) matrix and W-NOMINATE.Footnote 9 W-NOMINATE is a parametric scaling procedure that estimates three sets of parameters from a matrix of yea and nay votes using maximum likelihood estimation: (1) the coordinates for each delegate's ideal point (i.e., the delegate's most preferred location in the space), (2) the coordinates for the “cut point” of each roll call (i.e., the point that demarcates the predicted yeas from the predicted nays), and (3) a signal-to-noise ratio. In one dimension, voter ideal points are restricted to the [–1, 1] interval. The scaling produced by W-NOMINATE is the one that makes the observed yea and nay votes as likely as possible, with individuals exhibiting similar preferences placed more closely together than those behaving dissimilarly. Unlike ADA or ACU scores, there is nothing in the procedure that defines the recovered dimension ex ante. Instead, the substantive content has to be interpreted ex post. Such a data reduction technique allows one to “discover” the underlying pattern of voting rather than to preconceive a scale and then impose it on the data.
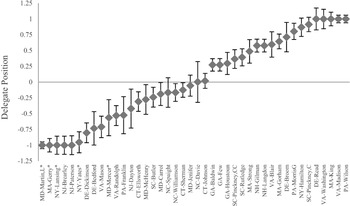
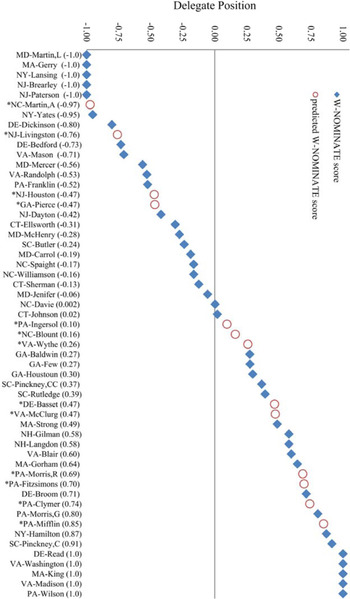
To assure there is adequate information to infer delegate positions, we exclude delegates with 10 or fewer inferred votes in the W-NOMINATE estimates. Of the 55 delegates at the Convention, 42 have enough inferred votes to be included in the analysis. Among them, five have between 10 and 20 inferred votes and five others have more than 200 inferred votes.Footnote 10Figure 1 displays the W-NOMINATE scores and bootstrapped standard errors created from this procedure. Specifically, the centered marks indicate the W-NOMINATE scores and vertical lines around the centered marks represent one standard error in each direction. The bootstrapped standard errors are largest for delegates who spoke the least, such as Jacob Broom (Delaware), Jonathon Dayton (New Jersey), and Richard Dobbs Spaight (North Carolina). We were less capable of inferring votes for such delegates and it is not surprising that their bootstrapped standard errors are larger than the standard error for delegates such as Madison (Virginia), who spoke often. The correlation between the number of inferred votes and the estimated standard error of the W-NOMINATE score is −0.69, which is statistically significant with a p-value = 0.00.
DELEGATE W-NOMINATE SCORES AND BOOTSTRAPPED STANDARD ERRORS

This means that the estimates are more precise for those who talked more, motioned more, or came from a delegation with fewer members. Nevertheless, being more vocal does not appear to force delegate estimates either away from or toward the extremes. The absolute distance of each delegate from the median position is correlated with the number of inferred votes at only −0.12 with a p-value = 0.46.Footnote 11 Thus, while we achieve greater precision in estimation as the number of inferred votes increases, the values of the W-NOMINATE scores do not simply capture how often a delegate spoke. Statistical methods are fundamentally sound if they tell us something we already know. Our scaling tells us that Alexander Hamilton voted very differently from his two co-delegates from New York, Yates and John Lansing, because they appear on opposite ends of the scale. It also tells us that the two delegates from New Hampshire, John Langdon and Nicholas Gilman, voted very similarly because they are mapped at the same location. This is consistent with the historical record regarding these well-known delegates and therefore gives our model some degree of validity.
The spatial representation does, however, yield several new and important insights. First, the spatial mapping helps us understand that a single dimension explains much of the voting at the Constitutional Convention. It is important to note that W-NOMINATE does not estimate the appropriate number of dimensions directly. Instead, the researcher first assumes the issue space is one dimensional and fits the model to the data. The researcher then assumes the issue space is two dimensional and fits the model to the data again, and so on. Ex ante, the improvement in fit must grow with each additional dimension (similar to an R 2 increasing with each additional variable). In our case, a single dimension correctly classifies 81 percent of the 4,102 coded yea or nay choices across the roll calls. Meaning, for 3,322 of the 4,102 yea or nay choices, the model correctly puts a delegate on the yea (resp. nay) side of the cut point if he is inferred to have voted yea (resp. nay) on the roll call. Adding a second dimension only increases the number of correctly classified voters by four percentage points to 3,487 correct predictions.Footnote 12 This suggests that our single dimensional scaling accurately predicts 81 percent of the inferred votes at the Convention. (That is, 81 percent of the votes inferred from the methods described in section 2.) This is comparable to 83 percent of the votes correctly classified by one dimension for the U.S. House and the 80 percent of the votes correctly classified by one dimension for the U.S. Senate from 1789 to 1985 (Poole and Rosenthal 1997).
Another insight provided by the scaling is the potential ability to uncover the major underlying issue at the Convention. Scholars have hypothesized multiple dimensions of voting at the Constitutional Convention over issues related to apportionment, localism-nationalism, and separation of powers (Pope and Treier 2012). Any one of these dimensions, or another, could be the primary dimension. Our model suggests that localism-nationalism is the primary dimension of conflict among delegates, which represents the classic dichotomy between individuals who favor decentralization and those who favor centralization. Our claim is based on the placement of known localists or nationalist on the scale. We use three sources for this purpose. Calvin Jillson and Rick Wilson (1994) and H. James Henderson (1974) label politicians localists or nationalists based on voting behavior in the Congress of the Confederation 1781–1783, which were years when the powers of the national government were debated.Footnote 13 Jackson Turner Main (1973) labels politicians localists or cosmopolitan based on the votes they cast in their state legislatures, 1780–1788. Combined, the three sets of authors label 12 of the 42 delegates examined in one of two categories—without contradictions among the authors. Even though delegates might have different positions at the Convention (because the Convention addressed different issues than the Congress or a state legislature), the location of the twelve delegates is consistent with a localist-nationalist interpretation of the scale. Three of the twelve delegates identified as localists (Gerry, Luther Martin, and John Mercer) are all to the left of the nine delegates identified as nationalists (Daniel Carrol, Hugh Williamson, Few, Gorham, Gouverneur Morris, Hamilton, Charles Cotesworth Pinckney, Madison, and James Wilson). Furthermore, delegates who were known for their localist stances at the Constitutional Convention, such as Gerry, Lansing, Luther Martin, William Paterson, and Yates, are near the extreme left, while some of the Convention's most ardent nationalists, Hamilton, Madison, Read, and Wilson are toward the extreme right. Other issues may correlate with this dimension, so our label should not be interpreted as solely measuring differences over centralization.
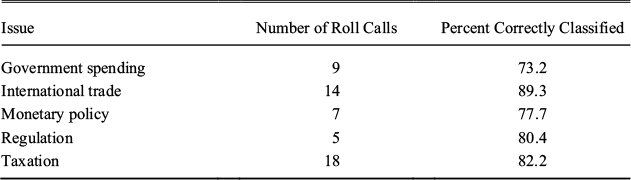
With this interpretation, it might seem reasonable to assume that the dimension scales issues about the powers of the state and national government quite nicely, but it would scale preferences on clear economic issues poorly. The dimension correctly classifies inferred votes on amendments and ratification of the Constitution and the power of the states at a rate of 87.2 percent and 82.4 percent, respectively. Both are above the average of 81 percent, which may not be that surprising considering both issues are directly related to preferences for centralization. However, the dimension also does a good job of correctly classifying inferred votes related to specific economic issues. Table 1 shows the percent of votes correctly classified on the economic issues considered at the Convention. Although these roll calls make up a small percentage of the total number of roll calls in the study (about 13 percent), they are not noise in the model.Footnote 14 All five categories appear to “fit” the dimension fairly well, with three of the five categories correctly classifying above average and the two others reasonably close. This suggests that the similarity and dissimilarity of delegate preferences on economic issues is congruent with the similarity and dissimilarity of their preferences on other issues, namely centralization. The power a delegate wanted to give the national government over spending, international trade, and taxation could have been a function of his preference for a stronger national government.
PERCENT CORRECTLY CLASSIFIED OF ECONOMIC ISSUES AT THE CONVENTION
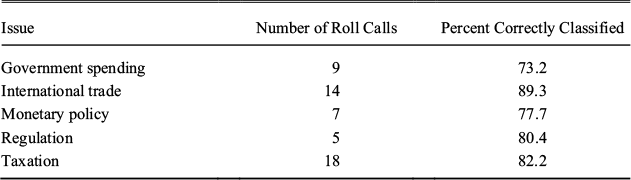
Note:
Roll call categories based on Dougherty and Heckelman (2012).
One of the biggest advantages of the scaling is that it quantifies the relative distances between delegates and allows us to address more fine-grained questions about the Convention. While it is well-known that Yates held strongly different views from Hamilton, the scaling quantifies the distance between Hamilton and his co-delegates and therefore the extent of their preference disagreement. For example, the distance between Yates and Hamilton is more than five times the distance between Oliver Ellsworth and Johnson, the extremes of the Connecticut delegation. The scaling also helps us locate more moderate delegates, such as Sherman (Connecticut) and John Rutledge (South Carolina), more precisely than historical accounts which simply put them somewhere in the center. The scaling can also identify the positions of delegates who have received less attention, such as Williamson and Broom, with the former being much more centrist than the latter. We examine the factors that might affect delegate preferences in the next section.
DETERMINANTS OF THE SPATIAL POSITIONS
Having estimated spatial positions for most delegates, we next seek to explain the preferences revealed by this procedure. The analysis in the previous section suggests that the underlying dimension appears to represent favoritism/disfavoritism toward a strong national government.
Econometric Methodology
Our empirical model begins as

where Yi represents delegate i's preferences on a new constitution which strengthens the federal government relative to the states, Xi is a matrix of potential determinants comprised of economic, political, and demographic factors (including a constant term), B is a vector of parameters to estimate, and ui is a random error term such that ui ~ N(0, v 2). We do not directly observe preferences. Rather our observed proxies for delegate preferences are generated by W-NOMINATE. Let yi represent the W-NOMINATE scores, where

and zi represents measurement error associated with the W-NOMINATE procedure such that zi ~ N(0, wi 2). Although the standard errors from W-NOMINATE are often ignored in empirical analysis, we will incorporate them directly in the empirical model. This is potentially important because as can be observed from Figure 1, the range of standard errors from W-NOMINATE estimates is quite varied, from a low of 0.055 (Luther Martin) to a high of 0.323 (William Davie). Substituting equation 2 into equation 1 reveals that our regression actually takes the form

where ei =ui + zi, such that ei ~ N(0,  ). Assuming Corr(ui, zi) = 0, then
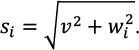 . This derivation implies that our model is heteroskedastic because the dependent variable is an estimate. In standard linear models, heteroskedasticity associated with measurement error of the dependent variable leads only to biased standard errors, but the coefficient estimates are still consistent (Lewis and Linzer 2005).Footnote 15 Estimation of robust standard errors is a standard solution to the problem.
However, ideal points estimated by W-NOMINATE are limited to the [–1, 1] scale. As shown in Figure 1, five delegates have a W-NOMINATE score at the left endpoint, and five delegates are at the right endpoint. Thus, a nontrivial portion of our data is censored. The censored nature of our data is represented by

For this reason, Tobit estimation is appropriate, treating the data as both top and bottom censored. In Tobit models heteroskedasticity leads to inconsistent, not merely inefficient, parameter estimates (Wooldridge 2004). Thus, applying robust standard errors is not sufficient in our case. Instead, we estimate the heteroskedastic error term, si, as part of the Tobit routine.
Using our censored values from equation 4, the likelihood function of the double-censored heteroskedastic Tobit takes the form
![\[
\begin{array}
L = \prod\limits_{\left\{ {i| \minus 1 \lt y_i \lt 1} \right\}} {\left[{\mathop s\nolimits_i^{ \minus 1} f\left({\left({y_i - X_i B} \right)\mathop s\nolimits_i^{ \minus 1}} \right)} \right]} \prod\limits_{\left\{ {i|y_i = \minus 1} \right\}} {\left[{F\left({\left({ \minus 1 - X_i B} \right)\mathop s\nolimits_i^{ \minus 1}} \right)} \right]} \prod\limits_{\left\{ {i|y_i = \minus 1} \right\}} {\left[{1 - F\left({\left({1 - X_i B} \right)\mathop s\nolimits_i^{ \minus 1}} \right)} \right]}
\end{array}
\](https://static.cambridge.org/binary/version/id/urn:cambridge.org:id:binary:20160308071023466-0300:S0022050713000314_eqn5.gif?pub-status=live)
where f(•) is the standard normal density function, F(•) is the standard normal cumulative distribution function, and 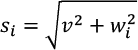 from above.Footnote 16 Output from W-NOMINATE generates both W-NOMINATE scores (yi) and bootstrapped standard errors (wi), which we use in the estimation of equation 5. Maximizing the log of L produces estimates for
 and
 , from which
 can be computed if desired. Our initial interest is in the estimation of
 , the unconditional marginal effects of each variable on the latent preferences from equation 1. As described in a later section, we can also use this method to make out-of-sample predictions on the conditional expected value of
 for delegates missing from the W-NOMINATE sample.
Independent Variables
We now attempt to explain overall voting patterns at the Constitutional Convention using equation 5 as our likelihood function and the single dimensional W-NOMINATE scores from Figure 1 as our dependent variable. Our explanatory variables capture various economic interests, ideology, and political experiences as described below.
In recent works, John Kaminski (1995) and Richard Beeman (2009) imply that slavery was a dominant issue at the Convention. Because the strength of the new federal government might affect the institutions of slavery, slave interests may have been implicit on many votes which were not directly related to slavery. McGuire and Ohsfeldt (1984, 1986) thought slaveowners opposed strengthening the national government in fear of domination by Northern interests which would weaken or even eliminate slavery. At the time of the Convention, only Massachusetts had abolished slavery although Connecticut and Pennsylvania had passed legislation for the gradual emancipation of slaves.Footnote 17 In contrast, Charles Beard ([1913] 2004) thought slaveowners favored a strong federal government that could be called on to suppress potential slave revolts. To address the possible effect of slave ownership on voting across the Convention, we include a dummy for whether a delegate owned slaves as an explanatory variable.Footnote 18
Farley Grubb (2003, 2006) argues that delegates with financial interests in the Bank of North America (BNA) favored granting the BNA a monopoly on currency issues and blocking the ability of states to issue their own currencies. Heckelman and Dougherty (2010) extend his argument by suggesting that it should also apply to stockholders of state banks because state bank notes were in competition with the bills of credit issued by state governments. In contrast, Donald Wittman (1995) argues that people who owned stock in the BNA supported the elimination of state currencies for more disinterested reasons. According to Wittman, delegates with a financial interest in the BNA wanted to erect a set of institutions that would protect sound financial interests, assure the payment of current debts, and tax at rates necessary to pay federal expenditures without having to accrue additional debt. Much earlier, Beard ([1913] 2004) had argued that those who were heavily invested in securities, as opposed to those heavily invested in agriculture, were part of an economic class that derived advantages from the new constitution. He believed securities owners worked together across the course of the Convention. To capture such economic interests, we include a dummy for whether the delegate owned public securities and a dummy for whether they owned private, bank securities.Footnote 19
In addition, delegates may have acted as representatives of their states (McGuire and Ohsfeldt 1986, McGuire 2003). Various scholars have noted differences between the large and small states over issues of apportionment (Jillson and Anderson 1978; Slez and Martin 2007). Larger states might have expected to possess greater power in the new federal government and benefit from expanding its authority (McGurie 2003). To represent this concept, we include the total population of each state as an additional explanatory variable.Footnote 20 It is important to keep in mind, however, that Georgia, a small state, voted with the large state coalition on the issue of apportionment because their delegates anticipated considerable population growth (Jillson and Anderson 1978). Hence, population at the time of the Convention may not adequately capture state interests in apportionment, even though it may control for other interests and abilities related to state size.
We also include a variable measuring the compliance of a delegate's state with federal requisitions prior to the Convention. The Continental Congress raised funds, soldiers, and supplies by requisitioning the states according to a prespecified apportionment. Without any enforcement power, it was up to the states to voluntarily comply. Dougherty (2001) argues this was a major failing of the Articles and a justification for a new constitution. Ben Baack (2001) presents a similar claim and further suggests that free-riding may have affected the financial authority of the Continental Congress. Delegates from states with greater compliance may have been especially frustrated with other states free-riding on requisitions and more cognizant of the need for a strong federal government with the power to tax independently.
Other important factors could include the delegate's ideology and political experience. An obvious measure of ideology in a modern U.S. Congress is a congressperson's political party because it helps determine his/her position on a liberal-conservative dimension.Footnote 21 In the same vein, we include a dummy for whether a delegate was an “Anti-Federalist” because it should help determine a delegate's position on a dimension related to centralization. William Riker (1987, p. 12) identifies six “proto-Antifederalists” at the Convention based on whether delegates were “proponents of a provincial political establishment,” not whether they opposed the drafted Constitution. He excludes Edmund Randolph and George Mason because their “Anti-federalism was entirely expost” (Ibid., p. 14). Because Riker created his list based on perceived ideology, we treat this variable as a measure of ideology.Footnote 22
Merrill Jensen (1950) argues that another factor which affects whether delegates were localists or nationalists was their political experience. Delegates who worked in local politics were beholden to local constituents and thus favored localist policies. Those who spent years in national politics saw the problems of a weak confederation and supposedly favored a stronger national government (Ferguson 1969; Main 1973). To capture the idea, we include the number of years of past political experience in the federal government and the number of years in state and local government, separately.
Finally, we consider regional distinctions. Daniel Elazar (1972, pp. 103–12) argues that the three colonial regions of New England, the Mid-Atlantic, and the South had different cultural and economic interests. A strong national government would be in a better position to regulate trade, both between the states and internationally, and to provide public goods. New Englanders tended to favor policies that protected manufacturing. In contrast, the South wanted to prevent tariffs from interfering with their agricultural exports. Kenneth Sokoloff and Stanley Engerman (2000) describe additional differences between the three regions. For example, Southerners were more heavily dependent on slave labor than were people from the New England or Middle Atlantic states. Wealth was much more equitably distributed in the latter two regions and the economies of scale in Southern agriculture were more limited than in the North. After the War for Independence, New England and Southern states become net importers of cereals from the Mid-Atlantic (Bjork 1964). Middle Atlantic states were also better able to maintain the value of their emitted bills of credit than states in other regions (Smith 1985).Footnote 23 Such differences in the economic climate would imply distributional effects from the ability of the national government to establish and regulate various economic institutions, such as currency, tariffs, taxation, militia, and slavery.
To determine the effect of regional differences on delegate positions, we include dummy variables for delegates from the South (up to Virginia) and Mid-Atlantic (Maryland to New York), leaving New England as the omitted category. These variables could represent either the preferences of the individual delegate or his perceived view of the cultural or economic preferences of his constituents.
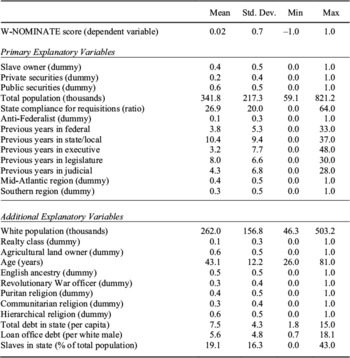
Descriptive statistics for all of these variables are presented in Table 2. Data sources are listed in the Appendix. A proto-typical delegate in our sample (for which we have a W-NOMINATE score) was a 43 year old Federalist with 12 years of past political experience (8 years of legislative experience, 4.3 years of experience in the judicial branch, and 3.2 years of experience in the executive branch).Footnote 24 In addition, the delegate would have been in service at the federal level for 3.8 years, mostly in the Continental Congress, and 10.4 years at the state or local level. He was likely to have held public but not private securities, and he did not personally own slaves. He came from a state of roughly 340,000 persons, 3/4ths of whom were white, and 20 percent of which were slaves. His state sent only one-quarter of the money requested by Congress during the Confederation, and he was more likely to have lived in the Mid-Atlantic than in the South or New England.
DESCRIPTIVE STATISTICS

Notes:
N = 42 for sample of delegates included in the regressions.
Results
Each of the variables from the upper portion of Table 2 are included in our base specification, except for the political variables which have substantial overlap. Specifically, we initially include the total years of past political experience which includes state and federal experience separately. We follow this with a second regression which breaks down political experience by branch of government.
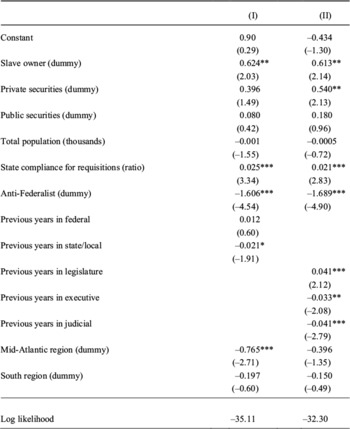
Coefficient estimates for the base specification appear in Table 3, column I. As presented in equations 1 and 5, these estimates represent the unconditional marginal effect on the latent variable of interest (i.e., preferences) rather than the same effect on the observed dependent variable (i.e., W-NOMINATE scores). The estimates suggest that, ceteris paribus, Anti-Federalists, and those from the Mid-Atlantic region tended to hold positions significantly to the left of other delegates. Even though four of the five Anti-Federalists were from Mid-Atlantic states, the high level of statistical significance for both coefficients suggests they capture independent effects.
We find that owning slaves tends to move a delegate in a pronational direction (i.e., to the right). Owning slaves would have moved a delegate in the pro-national direction if slaveowners believed a strong national government would be more likely to protect their property rights (by requiring all states to return runaway slaves to their masters) than diminish their property rights (by emancipating slaves). The positive and significant result contrasts with the work of Heckelman and Dougherty (2007) who found slave ownership to not be an important factor in affecting the likelihood of voting in a pro-national manner at the Convention. And it contrasts with McGuire (2003) who interprets his overall results as suggesting that slaveowners were less nationalistic than other delegates.Footnote 25 The difference is likely due to the fact that we are examining overall voting patterns at the Convention, while Heckelman and Dougherty (2007) and McGuire (2003) were examining a small subset of roll call votes.
We also find that owning private securities tended to make a delegate more nationalistic (though the effect is statistically significant only at the 14 percent level), consistent with the rent-seeking theory of Grubb (2003, 2006) and good governance theory of Wittman (1995). Both might argue that owners of private bank stock would support a strong national government, but for reasons different from each other and from Beard.
Yet, Beard's primary focus was on public bondholders. He thought holders of state and continental securities were “immediately concerned in the establishment of a stable national government” (p. 32). We do not find ownership of public securities to be a significant factor, and thus our findings only provide limited support for Beard's thesis about holders of securities.
DETERMINANTS OF DELEGATE POSITIONS

* = Significant at < 0.10.
** = Significant at < 0.05.
*** = Significant at < 0.01.
Notes:
N = 42. Estimates are derived from heteroskedastic Tobit regression treating data as censored at −1 and 1. Associated z-statistics are in parentheses.
Estimated coefficients for the two variables representing the number of years of federal or state/local experience have the signs we expected, but the former has only half the magnitude of the latter and is not statistically significant at any reasonable level. The latter suggests that more years in state and local politics tended to make a delegate more localist. The estimated marginal impacts suggest 30 years of state or local political experience were needed to fully offset the pro-national effect of owning slaves. Thus the slave owner William Houstoun from Georgia, who had no state/local political experience, and the non-slave owning Benjamin Franklin from Pennsylvania, who had 31 years of state/local experience, would be expected to hold roughly similar positions at the Convention if they came from the same state.Footnote 26 Similarly, if their other state and personal characteristics were identical, Gerry from Massachusetts, the lone Anti-Federalist from outside the mid-Atlantic region, would need 34 years of additional state/local experience compared to the other Anti-Federalists to match their positions.
In addition, greater compliance with requisitions by a delegate's state pushed a delegate further to the right. This is consistent with the argument that delegates from states in greater compliance with federal requisitions were more cognizant of the need for a strong federal government. They may have been more concerned about free-riding than delegates from states with less compliance.
Our estimates also indicate that delegates from larger states tended to be less nationalistic, although the effect is statistically significant only at the 12 percent level. The relative magnitudes suggest a difference of nearly 400,000 residents (roughly the difference between North Carolina and Delaware) would be needed to counter the effect from ownership (or lack thereof) of private securities.Footnote 27 The direction of the effect is inconsistent with delegates from large states favoring a stronger national government. However, as noted previously, contemporaneous population totals may be a weak proxy for membership in the large state coalition, which is traditionally viewed as favoring a stronger national government.
Although some of our variables appear to be relatively unimportant, we are not suggesting they were never meaningful for subsets of votes at the Convention. For example, McGuire and Ohsfeldt (1986) find ownership of public securities to be significantly related to yea or nay votes on four of the fourteen votes they analyze, including a prohibition on export tariffs. Our results simply suggest that owning public securities did not have a meaningful impact on delegate voting patterns across all substantive votes at the Convention.
The only other insignificant variable is federal experience. Further exploration of the data reveals that except for Franklin, Langdon, and both Gouverneur and Robert Morris, previous federal experience comes almost exclusively from service in the Continental Congress. In contrast, only about half of the delegates with state or local experience earned their years in a legislature. Thus, federal experience may be capturing legislative experience rather than experience in national politics.Footnote 28
To test this notion directly, we separated years of political experience into three variables, presented in column II: previous years of legislative service, previous years of executive service, and previous years of judicial service. More years of service in the legislature pushes a delegate further to the right and more experience in the executive or judicial branch moves a delegate to the left. The level of statistical significance for each of the branch coefficients is greater than the level of significance for either of the federal or state/local coefficients in column I. Note the magnitude of the legislative and judicial effects are the same but in opposite directions. Hence, if their other characteristics were the same, we would predict James McHenry's five years in the legislature and two years in the judiciary would put him in a similar ideological position as Davie's three years of exclusively legislative experience.
It is not clear why the three political variables have their estimated signs. One explanation could be that the Articles of Confederation provided no federal judiciary and almost no federal executive. All federal business was conducted through a federal legislature. Although a more nationalist constitution might separate and strengthen the three branches, the greatest increases in strength would occur in the executive and judiciary (Congleton 2011, p. 543).Footnote 29 Delegates with local judicial experience knew local laws and may have worried that a federal judiciary would require them to learn new legal precedents and potentially overrule their prior (or future) local and state court decisions through a federal appeals process. In the same vein, delegates with executive service (almost entirely at the state or local level) might view the federal government as a competing power, infringing on state sovereignty and undermine their authority as an executive. In contrast, delegates with legislative experience may have seen the failures of the confederation firsthand (both at the state and federal level) and felt relatively unthreatened by a stronger federal government which already had a legislature.
Separating the branches in column II also increases the impact from private securities both in terms of magnitude and level of statistical significance while eliminating the significance of the regional effect. The effect of total population was cut in half with an associated loss in significance level. In this specification, the difference between the largest and smallest state would not be enough to match the effect of private securities ownership. Everything else equal, owning private securities pushes a delegate 0.5 units to the right. Owning slaves pushes him 0.6 units to the right. Owning both would still not fully offset the leftward effect of being an Anti-Federalist. The sign and significance of the remaining variables were not affected by separating political experience into three branches.
As a robustness test, we also ran several additional regressions, which are not presented in the table. First, we considered alternative ways to operationalize Beard's ([1913] 2004) view of personalty interests versus realty interests. Beard identifies the groups primarily opposed to the Constitution as debtors or those who owned agricultural land. According to data obtained from McGuire (2003), only two of our included delegates were debtors, and only two other delegates would be considered to have a primary career in farming.Footnote 30 A realty dummy variable for these four delegates comes close to statistical significance (19 percent when added to specification I and 14 percent when added to specification II) but of opposite (positive) sign than expected from Beard's thesis. We next replaced this realty dummy by a dummy variable for whether a delegate owned land used for agricultural purposes, constructed from McDonald (1958, p. 91). This variable identifies all 26 delegates who owned active farming land even if farming was not their primary profession. Including it produced similar results.
We next considered additional proxies for delegate ideology originally utilized by McGuire and Ohsfeldt (1984), including a delegate's age, whether he was of English ancestry, or a Revolutionary War officer.Footnote 31 Each was entered separately but none were found to be statistically significant. The Anti-Federalist indicator remained statistically significant and of similar magnitude in each case.
Pundits repeatedly claim that religion affected political attitudes at the Convention. M. E. Bradford (1982) lists Congregationalists, Diests, Dutch Reformed, Episcopalians, Lutherans, Methodists, Presbyterians, Quakers, and Roman Catholics as the denominations represented. We tried various combinations of these sects. The Puritans (defined as one of the four Calvinist religions: Congregationalist, Dutch Reformed, Methodist, or Presbyterian) stood out as a useful category because they emigrated to America to avoid religious persecution and seemed generally opposed to strong central authority. As a second scheme, we grouped delegates that practiced a hierarchical religion (Episcopalian or Roman Catholic) into one category and delegates that practiced a communitarian religion (Congregationalists, Diests, or Quakers) into another. Finally, we considered the importance of being from a religion that actively supported the abolition of slavery in 1787 (Methodists or Quakers). Various combinations of these variables were added to the specification reported in column II. None were significant.
We also considered various ways of measuring federal debt held by constituents. The total federal debt in a state included Loan Office Certificates (federal bonds), IOUs for conscripted goods, and salaries owed to veterans. None of these measures were significant individually or in combination, regardless of whether they were calculated on a total per capita basis or per white male only basis. The number of slaves per capita (or per white male only) was also insignificant.Footnote 32 Furthermore, an alternative definition of region (North vs. South, with the North including the six states north of Delaware) was not significant.
Finally, to gauge the effect of our heteroskedastic correction, we also generated estimates from homoskedastic double-censored Tobit regressions for the specifications reported in columns I and II. In each case, the signs and significance of the variables remain the same, but the magnitudes for the coefficients are generally larger, suggesting that ignoring the measurement error associated with the W-NOMINATE scores would overestimate the size of the marginal effects.
Our analysis therefore suggests the relative preferences of a delegate were significantly affected by whether the delegate was an Anti-Federalist, the number of his prior years in executive, judicial, or legislative work, if he owned private securities or slaves, and the extent of his state's compliance with federal requisitions. Delegates voting in a manner most consistent with the localist positions were Anti-Federalists with several years of executive and judicial experience, who came from a state in the Mid-Atlantic which hardly complied with federal requisitions, such as New Jersey. Delegates who voted more nationalistic tended to be Federalists who served many years in the legislature, owned slaves and bank securities, and represented a state such as Pennsylvania, which largely complied with federal requisitions.
PIVOTAL DELEGATES
One useful implication of our regression analysis is that it can be used to predict the spatial location of delegates who were previously excluded because they had less than ten inferred votes. We can then use the full set of ideal points to identify the median delegate(s) for each state and the median delegate(s) on the floor.
Spatial Positions of Missing Delegates
The predicted values for the dependent variable of a heteroskedastic Tobit model censored at −1 and 1 are calculated as
![\[
\begin{array}
\hat y_i = \left[{F\left({h_{1i}} \right) - F\left({h_{ \minus 1i}} \right)} \right]\left[{X_i \hat B + \hat s_i \left[{f\left({h_{ \minus 1i}} \right)} \right]^{ \minus 1}} \right] - F\left({h_{ \minus 1i}} \right) + F\left({1 - h_{ \minus 1i}} \right)
\end{array}
\](https://static.cambridge.org/binary/version/id/urn:cambridge.org:id:binary:20160308071023466-0300:S0022050713000314_eqn6.gif?pub-status=live)
where  .Footnote 33 It can be shown that the predicted values of this representation fall within [–1, 1] and are thus comparable to the W-NOMINATE scores for the other delegates.
We have all of the explanatory variables (Xi) for the delegate locations we wish to predict, but because the delegates were not included in the W-NOMINATE procedure, we are missing values for their measurement error (wi) which we would need to compute 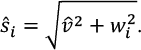 .Footnote 34 We considered several measures of wi based on the standard errors estimated by W-NOMINATE for the other delegates.
In particular, we considered using the minimum, mean, and maximum values of the observed, bootstrapped standard errors from the delegates with W-NOMINATE scores as the measurement error for delegates without W-NOMINATE scores. As noted earlier, the standard error from W-NOMINATE is highly correlated with the number of inferred votes, and because our missing delegates each have fewer than ten inferred votes, we would expect the missing delegates to have relatively large standard errors on their W-NOMINATE scores. Hence, predicting positions based on the maximum measurement error appears most appropriate. Choosing a smaller value for wi when computing the predicted positions for the 13 missing delegates has little effect on the results and never reverses the rank order of delegates from the same state. Thus, the choice of standard error value will not affect which delegates are identified as the median of their state.
For illustrative purposes, Figure 2 depicts the predicted W-NOMINATE scores for missing delegates using the maximum standard error value and the specification in Table 3, column II, along with the W-NOMINATE scores from the previous section. Predicted spatial positions for the missing delegates are spread throughout the distribution, with four delegates placed left of −0.45, six delegates placed right of 0.45, and three in between. This suggests that our missing delegates are fairly randomly distributed over the interval.
Median Voters
With a complete list of W-NOMINATE scores, we can now identify the location of the median delegate from each state and consequently the median delegates of all the state medians.Footnote 35 For this exercise, we rely on the distribution of delegate positions as presented in Figure 2.Footnote 36
DELEGATE W-NOMINATE AND PREDICTED W-NOMINATE SCORES

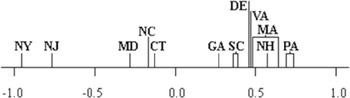
STATE POSITIONS BASED ON MEDIAN DELEGATES

Figure 3 presents the position of each state, as determined by its median delegate (or co-median delegates in the case of even-sized delegations). Scholars have long recognized Pennsylvania's voting record as one of the most nationalistic of the states (McDonald 1958; Jillson 1981; Gibson 2007). In contrast, New York and New Jersey are generally thought to have supported strident localist positions. The other states are less clear-cut, although Massachusetts and Virginia are often depicted as relatively nationalistic as well, partly due to the prominence of the Virginia Plan. Figure 3 is consistent with this conventional wisdom and also depicts where the other states fall in between.
It is interesting to note that several delegates are far from their state's median. Strong and Gorham, the co-median delegates from Massachusetts, are pro-national, while their most prominent co-delegate, Gerry, held an extreme localist position. New York was a localist state, because its median delegate, Yates, was a strident localist even though Hamilton, one of the other two New York delegates, was near the nationalist extreme. And despite Franklin's relatively strong left position and Jared Ingersoll's centrist position, these two delegates would have been routinely overruled by Robert Morris and Gouverneur Morris, the co-median delegates from Pennsylvania, who were much further to the right. Thus our mapping is consistent with historical understandings of both delegate and state positions simultaneously, giving us even greater confidence in our estimates.
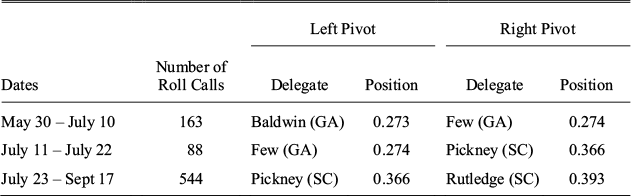
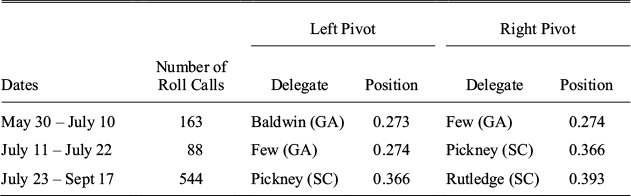
An implication of delegates voting in state blocs by majority rule is that the median delegate of state j would pivot state j and the median of the state medians would pivot the floor.Footnote 37 In the case of Figure 3, Baldwin of Georgia would be the left floor pivot and Rutledge of South Carolina would be the right floor pivot. All points in between would be in equilibrium.
Contrast this with what would occur if votes were tallied by individuals rather than by states. If votes were tallied by individuals and all 55 delegates were present at the same time (which never occurred), Ingersoll from Pennsylvania would be the median delegate, even though Davie from North Carolina is closer to the center of the scale.Footnote 38 This suggests that if delegates voted as independent individuals, the clauses in the Constitution might gravitate toward Ingersoll's position, rather than the positions of Baldwin and Rutledge. The result would be a more localist document than that expected from bloc voting.Footnote 39
Following Dougherty and Heckelman (2006), we can also break the Convention into three periods based on the attendance of delegates from New York and New Hampshire. From May 30–July 10 delegates from New York attended the Convention, but delegates from New Hampshire did not. During this period, our estimates suggest Georgia was generally the median state with Baldwin and Few holding nearly identical co-median positions. Growing discouraged with the proceedings, Lansing and Yates left the Convention after the July 10 meeting, leaving New York with fewer than the minimum number of delegates required by their state. From July 11 to July 22 only ten states were represented, making South Carolina a co-median with Georgia, with Few from Georgia becoming the left pivot and Charles Cotesworth Pinckney from South Carolina the new right pivot. This subtle shift allowed for winning proposals to become slightly more nationalistic. On July 23 Gilman and Langdon of New Hampshire arrived for their first vote. Because they were positioned to the right of both floor pivots, South Carolina now solely controlled the floor pivots with Pinckney and Rutledge in the left and right pivotal positions. The Convention should have become even more nationalistic with the arrival of the New Hampshire delegates, but not by much. These descriptions are summarized in Table 4.
PIVOTAL DELEGATES
Notes:
Pivots were identified assuming full attendance by all delegates. All positions between the left and right pivots (inclusive) are in equilibrium.
A cursory view of attendance records suggests that the floor medians were relatively stable, with either a delegate from Georgia or South Carolina typically representing the median state(s). The four delegates from South Carolina never missed a day and, with the exception of Pierce, each of the Georgia delegates held very similar positions.
The consequences for the economic interpretation of the Constitution are clear. Beard ([1913] 2004) argued that the Constitution resulted from a struggle between delegates who owned personalty and those who owned land. He divided land owners into three groups: small farmers, manorial lords from the Hudson Valley, and the “slaveholding planters of the South” (Ibid, p. 27). Beard claimed that delegates who owned personalty controlled the Convention and inserted clauses into the Constitution that favored their interests, often against the interests of those who owned land. Our analysis suggests that plantation owners were much more in control of the Convention than their landholding status might suggest. Delegates like Few and Houstoun from Georgia, and Pinckney and Rutledge from South Carolina, all owned sizable plantations at the time of the Constitutional Convention. They were also the floor pivots during our three periods of analysis or, in the case of Houstoun, very close to the floor pivots. Such delegates were more likely to influence the final document than those on the extreme. Nationalists, such as Madison, might have been able to control parts of the agenda, but they would need the approval of the floor medians to get clauses passed. In this sense, delegates from the Deep South who owned large plantations and represented constituents with interests in agriculture should have been considerably more influential than Beard's thesis suggests.Footnote 40 If delegates were perfect spatial voters, the Deep South would have to agree to all proposals, which might explain why there is limited evidence in favor of Beard's narrow economic interpretation (Heckelman and Dougherty 2010).
CONCLUSION
The Constitutional Convention provides a rich story about nation building. Although every good story is worth retelling, our intent has not been to retell the story of how the Constitution was created. Instead, we have brought new data to bear on the age-old question of the motivation of the framers at the Constitutional Convention. Previous studies have tried to address this question by examining delegate positions on a handful of roll call votes. One study on roll calls related to financial issues found that financial interests explain delegate voting behavior on the margin (Heckelman and Dougherty 2010). Another study of roll calls related to slavery found that slave ownership affects delegate voting behavior on the margin (Dougherty and Heckelman 2008). Studies that try to make generalizations across the course of the Convention have either focused on a single set of sixteen roll calls (McGuire and Ohsfeldt 1984, 1986, 1997) or have relied on the votes recorded for the state blocs and omitted differences within state blocs altogether (Jillson and Anderson 1978; Slez and Martin 2007; Pope and Treier 2012). Not surprisingly, the latter two groups have produced more mixed results about the motivation of the framers.
By making an effort to infer delegate votes on all substantive motions at the Convention, we have been able to estimate a position representing their relative preferences across the course of the Convention. This dimension does not show delegates clumped together based on their holding of public securities nor does it show one of the geographic regions grouped on an extreme. Instead, latent interests at the Convention appear to reflect different preferences for centralization, much like modern economic preferences are largely based on views about the proper role of government. Finding that centralization was the primary issue at the Convention is consistent with the historical perspectives of Jensen (1950), Ferguson (1969), and McGuire (2003), who thought the Convention was pushed by people who favored stronger national government. Our spatial estimates also provide evidence against the claims of Crosskey and Jeffrey (1981) and Joseph Davis (1977), who claim the primary motivation for the new Constitution was to regulate commerce or address sectional conflicts, respectively.
We also find that preferences for a stronger central government often varied among delegates from the same state. Hamilton, like many of the prototypical nationalists, was near the right extreme of the scale, while Hamilton's co-delegates were at or near the left extreme. Delegates from Delaware ranged from John Dickinson (–0.80) on the far left to Read (1.0) at the extreme right, and other states such as Virginia and Pennsylvania were less unified than many may have believed.
However, there is more to our story than simply revealing different tastes for centralization. We identify several factors which covaried with the localist-nationalist dimension. With other factors controlled, the type of political experience (judicial, executive, or legislative), ownership of slaves and/or private bank securities, and the extent of home state compliance with federal requisitions seem to be major determinants of the spatial positions of the delegates. Legislative experience and greater compliance with federal requisitions by a delegate's state tended to move a delegate toward a nationalist position, perhaps because these factors gave them greater faith in federal decision making, centralization, and a document that would virtually eliminate state free-riding. Owning slaves and bank securities had a similar effect, but for different reasons. Greater experience in the judiciary and executive tended to give delegates a more localist view. The latter qualities may reflect stronger interests in state sovereignty, free from federal interference.
Most of these factors vary by delegate, not by state. The population of each state, state slave holdings, debt held within each state, and to a lesser extent region had limited or no affect. Finding that delegates voted primarily according to delegate level factors raises questions about whether state level votes can be properly used to analyze delegate level questions as well as the principle-agent relationships maintained between delegates and the legislatures which elected them. Although delegates seemed to freely pursue their own interests, we cannot determine whether they acted on their best judgment of principle or pursued self-advantage. Delegates with different attributes may have simply had different principled views.
As an ancillary result, we have also shown that delegates from Georgia and South Carolina held median positions across the Convention. Because Baldwin, Few, Charles Cotesworth Pinckney, and Rutledge were floor medians from Georgia and South Carolina respectively, one should see their preferences in various parts of the Constitution. These delegates were consistently opposed to federal export tariffs because export tariffs would reduce Southern trade with Great Britain. Prohibiting states from issuing bills of credit and not requiring the approval of two-thirds of Congress for navigation acts allegedly passed because these delegates acquiesced. As Grubb (2003, p. 1790) writes, “The prohibition against state-issued bills of credit was a sovereign power states were willing to relinquish considering that the Constitution gave states considerable sovereign power over most other matters internal to each state, most notably slavery—as General Pinckney of South Carolina and Abraham Baldwin of Georgia pointed out during the Constitutional Convention.” Delegates from the Deep South were also opposed to a clause forcing state compliance with federal taxes and a clause enumerating the federal government's power to accrue debt while promoting the common defense and general welfare. Each of these positions prevailed, and the final document reflected Southern preferences on these issues—even though Article 1, section 8 seems to leave room for an implied power to accrue debt.
In this sense, the nation's broader acceptance of free trade may have been initiated by less vocal delegates who have been heretofore obscured by a cacophony of vocal nationalists. Such delegates may provide a better caricature of the preferences and motivation of those who attended the Convention than delegates on the extreme.
Appendix: Data Sources for Independent Variables
Age, years in politics, and years in specific offices were gathered from three sources: the American National Biography, Oxford University Press, 2000; “America's Founding Fathers: Delegates to the Constitutional Convention,” National Archives, http://www.archives.gov/exhibits/charters/constitution_founding_fathers.html; and the “Biographical Directory of the United States Congress,” http://bioguide.congress.gov/.
Anti-Federalists came from Riker (1987).
Agricultural landholder came from McDonald (1958, p. 91).
Religion came from Bradford (1982).
Public and private securities owned by the delegates, their slave holdings, and whether a delegate was of English ancestry, a Revolutionary War officer, debtor, or farmer, were made available by McGuire (2003).
Debt per capita came from the American State Papers, Volume 1 (Finance): 231.
State compliance with requisitions for money (1784–1789) came from Dougherty (2001, p. 95). Population figures came from the Department of Commerce and Labor (1909) A Century of Population Growth from the First Census of the United States to the Twelfth, 1790–1900. We use the state boundaries that existed at the time of the Convention. Hence, Maine is included with Massachusetts, Kentucky is included with Virginia, and Tennessee (also known as the Southwest Territory) is included with North Carolina.
The Mid-Atlantic region includes New York, New Jersey, Pennsylvania, Delaware, and Maryland. States north and south of this region were coded as New England and the South, respectively.
 is estimated as part of