Introduction
The onset of lactation in the dairy cow represents a large and abrupt rise in nutrient demand. The increased glucose requirements of the lactating mammary gland require marked adjustments in nutrient partitioning and the metabolism of non-mammary tissues. Hepatic gluconeogenesis is increased to meet mammary demands during early lactation, while glucose utilization by adipose tissue and muscle is reduced. These responses are mediated by reduced circulating insulin concentrations, and through a series of coordinated adaptations – orchestrated by increased circulating growth hormone concentrations – to reduce peripheral tissue sensitivity and responsiveness to insulin (Bell and Bauman, Reference Bell and Bauman1997). In addition, adipose tissue responsiveness to lipolytic stimuli is markedly increased in early lactation to facilitate body fat mobilization in support of lactation (Bauman, Reference Bauman2000). Catecholamines are important signals to promote mobilization of fuel stores to meet short-term energy needs. Epinephrine is a neurotransmitter in the sympathetic nervous system with powerful lipolytic action, and induces maximum rates of lipolysis in adipose tissue (Sechen et al., Reference Sechen, Dunshea and Bauman1990).
The administration of bovine somatotropin (bST) to lactating dairy cows alters tissue responsiveness to homeostatic signals to increase nutrient partitioning towards milk production (Etherton and Bauman, Reference Etherton and Bauman1998). Alterations in response to homeostatic signals may occur through changes in receptor number, binding kinetics or intracellular expression of the signal (e.g. amplification, enzyme activation; Bauman and Elliot, Reference Bauman and Elliot1983). Genetic selection for increased milk yield has been associated with an increased ratio of somatotropin to insulin (Bonczek et al., Reference Bonczek, Young, Wheaton and and Miller1988), though relative differences are reduced when high-producing cows are placed on a higher plane of nutrition (Hart, Reference Hart1983). Previous investigations have shown an association between genetic merit and changes in insulin secretion in response to a glucose challenge in juvenile dairy bulls (Mackenzie et al., Reference MacKenzie, Wilson, McCutcheon and Peterson1988), while Kolver et al. (Reference Kolver, Roche, DeVeth, Thorne and Napper2001) reported a greater lipolytic response to an epinephrine challenge for cows of greater milk yield potential. The greater propensity for body reserve mobilization that accompanies genetic selection for milk production may thus result from changes in the set points for physiological responses to homeostatic signals.
The Moorepark strain comparison study evaluated the milk production, body condition score (BCS), bodyweight and fertility characteristics of the North American (NA) and New Zealand (NZ) strains of Holstein–Friesian (HF) cattle managed under a range of pasture-feeding systems (Horan et al., Reference Horan, Dillon, Faverdin, Delaby, Buckley and Rath2005). The NA strain had been selected for increased milk yield in a confinement environment, whereas the NZ strain had been selected for milk solids production, feed efficiency and survival in a pasture-based system with limited concentrate input. Among the principal findings of the study were greater milk production, lower BCS and inferior fertility performance for the NA strain across the feeding systems. A notable feature of the Moorepark strain comparison study was the greater milk production response to additional concentrate supplementation for NA cows compared to NZ cows, indicating a greater capacity to partition additional ingested nutrients to milk production for NA cows (Horan et al., Reference Horan, Dillon, Faverdin, Delaby, Buckley and Rath2005). It also reported that increasing concentrate supplementation in pasture-based systems is ineffective as a strategy to reduce the extent of BCS loss for NA cows in early lactation. The current study was carried out to test the hypothesis that differences in nutrient partitioning between the NZ and NA strains are the result of altered tissue responsiveness to homeostatic signals.
Material and methods
Animals and experimental design
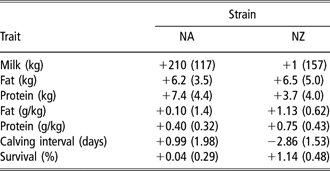
Two groups of 10 spring-calving, multiparous HF cows were selected from the NA and NZ groups of the Moorepark strain comparison study. The origins and establishment of the experimental groups from which the cows were selected have been previously described by Horan et al. (Reference Horan, Dillon, Faverdin, Delaby, Buckley and Rath2005). The NA strain was developed by mating the top 50% of cows in Moorepark (based on pedigree index for milk production) with five NA Holstein sires, selected as the highest available in Ireland for pedigree index for milk production. The NZ strains were imported as embryos from New Zealand and implanted into Holstein heifers. These NZ embryos were generated by mating high genetic merit NZ HF cows with five high genetic merit (based on Breeding Worth, the New Zealand genetic evaluation system) NZ HF sires. The experimental animals used in the current study were selected as representative of the NA and NZ treatment groups involved in the Moorepark strain comparison study (Horan et al., Reference Horan, Dillon, Faverdin, Delaby, Buckley and Rath2005). The genetic merit for milk production of the experimental groups is outlined in Table 1.
Genetic merit of the North American and New Zealand Holstein–Friesian cowsFootnote 1 based on predicted differencesFootnote 2 and standard deviations (s.d.) for milk production, calving interval and survival

NA = North American Holstein–Friesian; NZ = New Zealand Holstein–Friesian.
1 Information previously published in Patton et al. (Reference Patton, Murphy, O’Mara and Butler2008).
2 All predicted differences obtained from the February 2004 international evaluations of the INTERBULL Animal Centre (Uppsala, Sweden).
Animal management and sampling
Cows were housed in a free-stall barn commencing 3 weeks prior to expected calving date, and trained to use the Griffith Elder feeding system (Griffith Elder Ltd, Bury St Edmunds, Suffolk, UK). Forage mangers were mounted on electronic load cells and concentrates were dispensed through automatic feeders to facilitate measurement of DMI and calculation of energy balance. Cows had ad libitum access to forage, which was fed once daily and offered to allow for feed refusals of at least 5%. Refusals were removed daily.
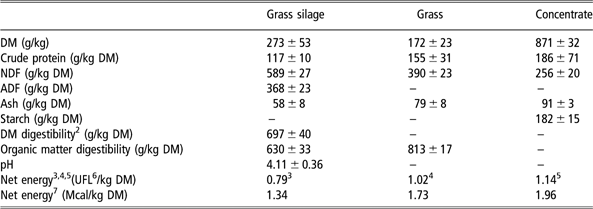
Glucose tolerance tests, epinephrine challenges and insulin challenges were carried out at two time periods for each cow. The first series of challenges were carried out on consecutive days commencing on day 32 ± 0.48 (mean ± s.e.) of lactation (T1), and the second series of challenges were carried out on consecutive days commencing on day 137 ± 2.44 of lactation (T2). Cows were moved to individual tie-stalls during the period when homeostatic challenges were taking place, and were milked in the stall at 0730 and 1530 h. Feed was removed at least 1 h prior to the administration of each challenge. The diet offered in the week preceding and during T1 consisted of ad libitum grass silage (L. perenne spp.) plus 8 kg/day (as fed) of concentrate. The diet offered in the week preceding and during T2 consisted of ad libitum freshly cut grass (L. perenne spp.) plus 4 kg/day (as fed) of concentrate. The daily concentrate allowance was fed in equal amounts at each milking, and consisted of barley 220 g/kg; rapeseed meal 210 g/kg, beet pulp 200 g/kg, maize gluten 170 g/kg, soybean meal 140 g/kg, vegetable oil 30 g/kg and mineral mix 30 g/kg. The chemical analyses of the forages and concentrate used are detailed in Table 2.
Chemical composition of forages and concentrateFootnote 1

DM=dry matter.
1 Values reported are mean ± s.d. and adapted from information previously reported in Tables 2 and 3 of Patton et al. (Reference Patton, Murphy, O’Mara and Butler2008).
2Estimated using near-infrared spectroscopy.
3The net energy value of silage was related to its in vitro DMD concentration (O’Mara et al., Reference O’Mara, Caffrey and Drennan1997).
4The net energy value of grass was determined according to Jarrige (Reference Jarrige1989).
5The net energy of concentrate was calculated from the net energy values for ingredients (Jarrige, Reference Jarrige1989).
6Unité Fourragère Lait, net energy for lactation equivalent of 1 kg standard air-dry barley (Jarrige, Reference Jarrige1989).
7Estimated based on 1 UFL = 1.7 Mcal/kg (Vermorel, Reference Vermorel1989).
Mean daily energy balance (EB) for the week preceding the administration of homeostatic challenges was estimated as the difference between energy intake and the sum of energy requirements for maintenance and milk production. The French net energy (NE) system was used, where one UFL is the NE content of 1 kg of air-dry standard barley for milk production (Jarrige, Reference Jarrige1989). Solids-corrected milk (SCM) yield was calculated using the equation of Tyrell and Reid (Reference Tyrell and Reid1965). On day 1 (Monday) of each time period, i.e. the day before the first homeostatic challenge, cows were weighed to facilitate calculation of dosage rates, and indwelling jugular catheters were fitted to facilitate collection of blood samples and allow intravenous (i.v.) infusion of glucose, epinephrine and insulin. BCS (Lowman et al., Reference Lowman, Scott and Somerville1976) was also recorded for each animal on day 1 of each time period.
Administration of homeostatic challenges
The glucose tolerance test was carried out on day 2 of each time period. Cows were infused with glucose (50% wt/vol dextrose solution; Baxter Healthcare Ltd, Norfolk, England) at a rate of 1.5 g glucose/kg of BW0.75 via the jugular catheter at 0900 h and immediately flushed with 10 ml saline. Blood samples were collected at −45, −40, −30, −20, −10, −5 and 0 min relative to the start of infusion, and at 2.5, 5, 7.5, 10, 15, 20, 30, 45, 60, 120, 150 and 180 min relative to the completion of infusion. Mean infusion times (±s.e.) for NA cows were 495 ± 45 and 400 ± 17 s at T1 and T2, respectively. Mean infusion times for NZ cows were 401 ± 18 and 363 ± 19 s at T1 and T2, respectively.
The epinephrine challenge was carried out on day 3 of each experimental week. Epinephrine acid tartrate (1 mg/ml solution; Phoenix Pharma Ltd, Gloucester, England, UK) was infused at a rate of 1.4 μg/kg BW via the jugular catheter at 0900 h and immediately flushed with 10 ml of sterile saline. Blood samples were collected at −45, −40, −30, −20, −10, −5, 0, 2.5, 5, 7.5, 10, 15, 20, 30, 45, 60, 120, 125 and 130 min relative to epinephrine administration. The epinephrine dose chosen was previously reported to result in a maximum lypolytic response (Sechen et al., Reference Sechen, Dunshea and Bauman1990).
The insulin challenge was carried out on day 4 of each experimental week. Bovine pancreatic insulin (I-5500, lot 064K1582, 28.7 USP units/mg; Sigma, Dublin, Ireland) was dissolved in a sterile solution of 0.01 M HCl to generate a 2 mg/ml solution, and this was diluted with sterile saline to a final concentration of 1 mg/ml. The insulin solution was prepared on the evening prior to the insulin challenges, and stored overnight at 4°C. Insulin was infused at a rate of 1.0 μg/kg BW via the jugular catheter at 0900 h, and immediately flushed with 10 ml of sterile saline. The blood-sampling schedule for the insulin challenge was identical to that of the epinephrine challenge.
All blood samples collected during each challenge were decanted into tubes containing 100 IU of heparin, centrifuged at 2000 × g for 15 min at 4°C, and the plasma was harvested and stored at −20°C until analysis.
Laboratory procedures and sample analysis
The DM, NDF, crude fiber and CP of the forage and concentrate samples were analyzed as described by McNamara et al. (Reference McNamara, O’Mara, Rath and Murphy2003). Determination of in vitro dry matter digestibility (DMD) was carried out by near-infrared spectroscopy using a NIRsystems 6500 spectrophotometer (Perstorp Analytical Incorporated, Silver Springs, MD, USA). Silage pH was measured on the juice pressed from the silage using a glass electrode and a pH meter (Radiometer pHM2 standard pH meter-radiometer; Copenhagen, Denmark). The organic matter digestibility of grass was determined as described by Morgan et al. (Reference Morgan, Stakelum and Dwyer1989).
Blood plasma was analyzed for glucose and non-esterified fatty acid (NEFA) concentrations by enzymatic colorimetry, using an ABX Mira Autoanalyser (ABX Mira, Cedex, France) and appropriate kits (NEFA kit supplied by Wako Chemicals, GmbH, Nissanstraße, Germany; glucose kit supplied by ABX Montpellier, Cedex, France). Plasma insulin was assayed using a solid-phase fluoroimmunoassay (AutoDELFIA; Perkin-Elmer Life and Analytical Sciences, Turku, Finland; Perkin-Elmer kit no. 312439 supplied by Unitech BD Ltd, Dublin, Ireland). The inter- and intra-assay coefficients of variation were 8.72% and 5.71%, respectively. The minimum detectable concentration of the assay was 1.52 μIU/ml.
Data handling and statistical analysis
Metabolite and hormone responses to each homeostatic challenge were calculated as area under the response curve (AUC), corrected for differences in baseline value. AUC was calculated using the EXPAND procedure in SAS (Statistical Analysis Systems (SAS) Institute, 1991). Baseline values for each analyte were determined by calculating the overall mean concentration of samples collected prior to administration and samples collected from 120 min post challenge. When measuring the AUC response to the hormone/metabolite administered (i.e. glucose AUC in response to the glucose tolerance test, and insulin AUC in response to the insulin challenge), calculations were from the time of administration until the time of return to baseline concentration for the individual animal. In all other instances, the AUC was calculated from 0 min until the average time that maximal response had occurred to minimize the effect of counter-regulatory mechanisms. Maximal responses occurred at 20 min after administration of epinephrine for both glucose and NEFA. For the insulin and glucose challenges, maximum NEFA responses occurred at 30 min after infusion.
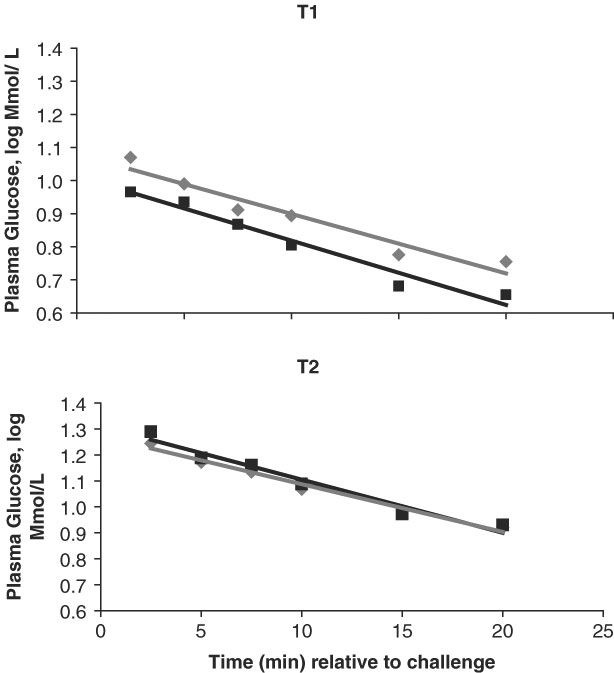
The glucose response to the insulin challenge was expressed as the fractional rate of change (FRC) in glucose. This was calculated as the slope of the natural logarithm of glucose concentration over the initial declining phase (0 to 20 min) plotted v. time.
The half-life (t½) and clearance rate (CR) of glucose and insulin were calculated using the NLIN procedure in SAS (SAS Institute, 1991). Data from the first 60 min following infusion of each challenge were fitted to the following equation:

where t = time, b = parameter for starting concentration and c = parameter for rate of decay.
CR is the slope of this exponential function. Therefore, CR and t½ of glucose and insulin were calculated as follows:

where [ta] = concentration of metabolite or hormone at time a (ta), [tb] = concentration of metabolite or hormone at time b (tb).
Data from T1 and T2 were analyzed as repeated measures using the MIXED procedure of SAS (SAS Institute, 1991). Treatment, time and a treatment × time interaction terms were included in the models as fixed effects; cow was treated as a random variable nested within treatment, and an autoregressive covariance structure was used. The P-values presented in Tables 4–6 represent the main effects of strain, time and the interaction between strain and time. Pairwise comparisons of strain effects within time period and time effects within strain were adjusted using the Tukey–Kramer test; in the Results section, these comparisons are described using adjusted P-values.
Results
Milk production, EB, BCS and bodyweight
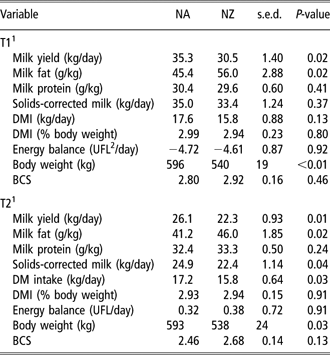
The milk yield, DMI and EB data of the strains during the periods of administration of homeostatic challenges are presented in Table 3. The NA strain had higher milk yield at T1 (P = 0.02) compared to the NZ strain. SCM yield did not differ (P = 0.37) between the strains at T1 due to a higher milk fat content for NZ cows (P = 0.02). Mean daily EB (P = 0.92) was similar for the strains at T1, and differences in DMI were not significant (P = 0.13). The NA cows had a greater milk yield (P = 0.01) and lower milk fat concentration (P = 0.04) compared to the NZ strain at T2. SCM yield (P = 0.04) and DMI (P = 0.03) were greater for NA compared to NZ cows at T2. However, DMI as a percentage of body weight (P = 0.91) and daily EB (P = 0.16) did not differ between the strains during this time period. The NA cows were heavier (P < 0.05) during both experimental periods. There was no difference in BCS between the strains at T1 (P = 0.46) or at T2 (P = 0.13). The milk production, post-partum EB and metabolic profiles of the animals used in the current study have been previously reported (Patton et al., Reference Patton, Murphy, O’Mara and Butler2008).
Milk production, DMI, body weight and EB during periods of homeostatic challenges

DMI=dry matter intake; EB=energy balance; NA = North American Holstein–Friesian; NZ = New Zealand Holstein–Friesian; DM=dry matter; BCS=body condition score.
1T1 = 32 ± 0.48 (mean ± s.e.) days in milk; T2 = 137 ± 2.44 days in milk.
2Unité Fourragère Lait, net energy for lactation equivalent of 1 kg standard air-dry barley (Jarrige, Reference Jarrige1989).
Glucose tolerance test
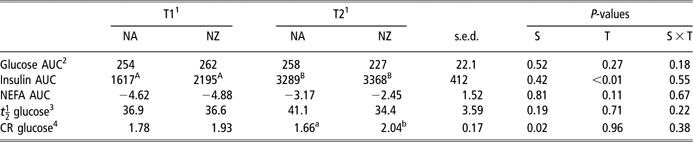
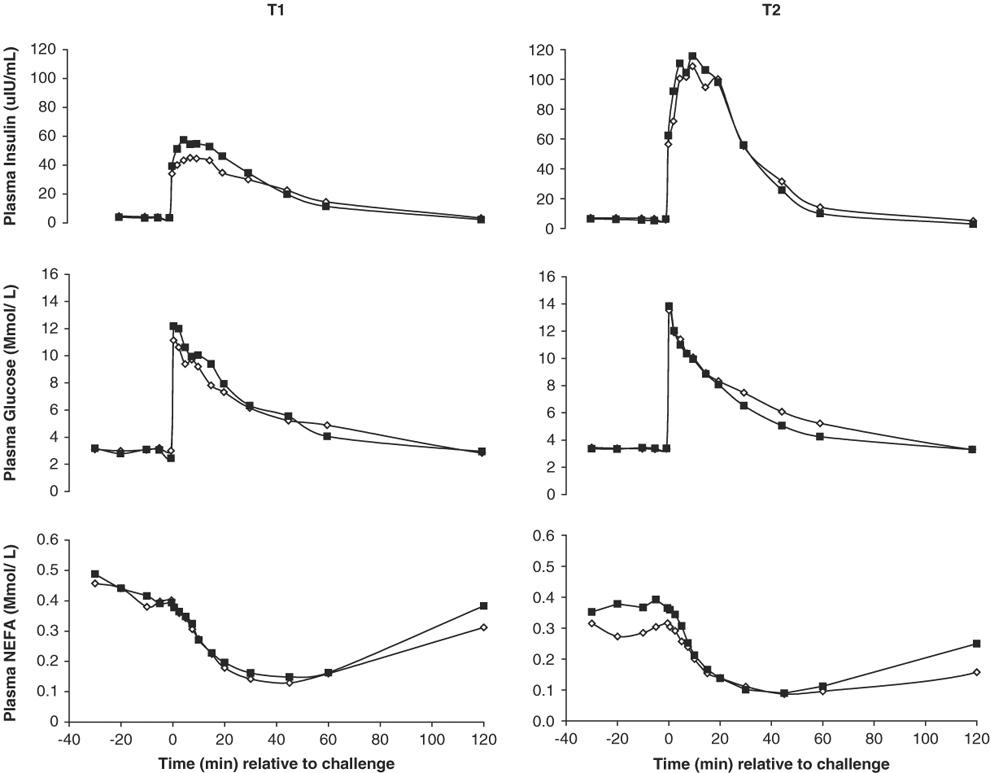
Intravenous infusion of glucose resulted in an acute increase in plasma insulin concentrations and a reduction in plasma NEFA concentrations (Table 4 and Figure 1). The NA and NZ strains had similar glucose AUC (P = 0.73), insulin AUC (P = 0.32), NEFA AUC (P = 0.85), glucose CR (P = 0.37) and glucose t½ (P = 0.93) at T1.
Effect of cow strain on responses to intravenous glucose tolerance tests in early and mid-lactation

NA = North American Holstein–Friesian; NZ = New Zealand Holstein–Friesian; S = strain, T = time period; NEFA=non-esterified fatty acid.
1T1 = 32 ± 0.48 (mean ± s.e.) days in milk; T2 = 137 ± 2.44 days in milk.
2AUC = area under the response curve. Expressed in units of Mmol min/l for glucose and NEFA and μIU min/ml for insulin.
3 t½ = glucose half-life (min).
4CR = clearance rate (%/min).
ABabMeans having different upper case superscripts differ significantly within strain across time period (P < 0.05). Means having different lower case superscripts differ significantly within time period across strain (P < 0.05).
Responses of the NA (◊) and NZ (▪) strains of Holstein–Friesian cattle to intravenous glucose tolerance tests at two stages of lactation (T1 = 32 ± 0.48 (mean ± s.e.) days in milk; T2 = 137 ± 2.44 days in milk). Cows were infused with 1.5 g glucose (50% wt/vol)/kg of BW0.75 via the jugular catheter. Areas under the response curve and statistical analysis are outlined in Table 4.

The CR of glucose was greater for NZ compared to NA cows at T2 (P = 0.03), while t½ for glucose tended to be greater for NA cows at that time (P = 0.07). There were no differences between the strains at T2 in insulin AUC (P = 0.89), glucose AUC (P = 0.17) or NEFA AUC (P = 0.63). A significant effect of time was observed, where the insulin response to glucose infusion was greater at T2 v. T1 (P < 0.01).
Epinephrine challenge
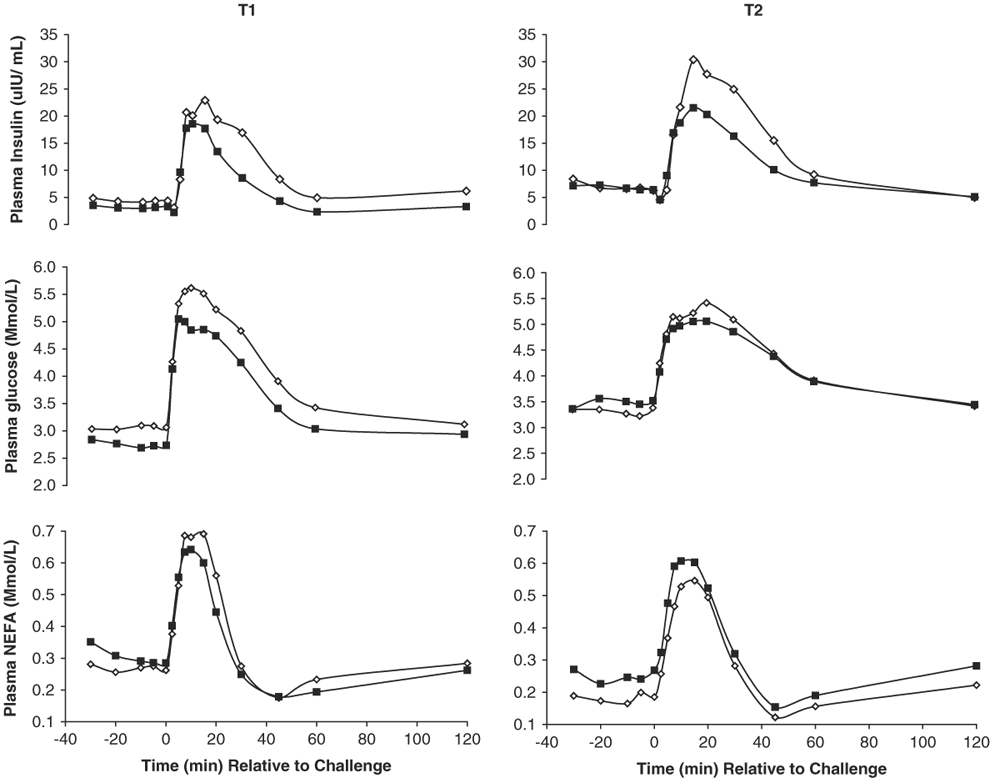
Plasma concentrations of glucose were acutely elevated by i.v. infusion of epinephrine at T1 and T2 (Table 5 and Figure 2). The NA strain tended to have a greater glucose response to epinephrine at T1 (P = 0.10) and T2 (P = 0.14), as measured by AUC, resulting in an overall greater response (P = 0.04) for NA cows across the two time periods.
Effect of cow strain on responses to intravenous epinephrine challenges in early and mid-lactation

NA = North American Holstein–Friesian; NZ = New Zealand Holstein–Friesian; S = strain, T = time period; NEFA=non-esterified fatty acid.
1T1 = 32 ± 0.48 (mean ± s.e.) days in milk; T2 = 137 ± 2.44 days in milk.
2AUC = area under the response curve. Expressed in units of Mmol min/l for glucose and NEFA and μIU min/ml for insulin.
ABMeans having different upper case superscripts differ significantly within strain across time period (P < 0.05).
Responses of the NA (◊) and NZ (▪) strains of Holstein–Friesian cattle to intravenous epinephrine challenges at two stages of lactation (T1 = 32 ± 0.48 (mean ± s.e.) days in milk; T2 = 137 ± 2.44 days in milk). Epinephrine acid tartrate (1.4 μg/kg BW) was administered via the jugular catheter. Areas under the response curve and statistical analysis are outlined in Table 5.

Epinephrine infusion also resulted in an acute increase in circulating concentrations of NEFA, which returned to baseline concentrations by 45 min post infusion. The NEFA response to epinephrine, measured as AUC, was similar for both strains at T1 (P = 0.25) and T2 (P = 0.73). The NA cows tended to have a greater (P = 0.07) insulin response to epinephrine infusion across the two time periods.
Insulin challenge
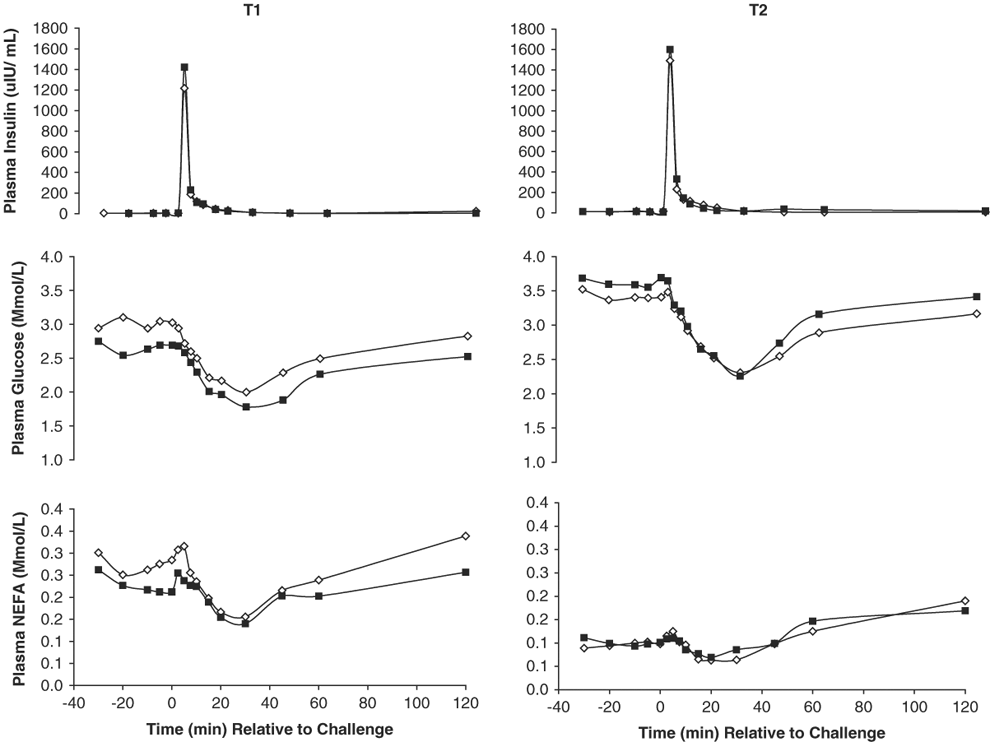
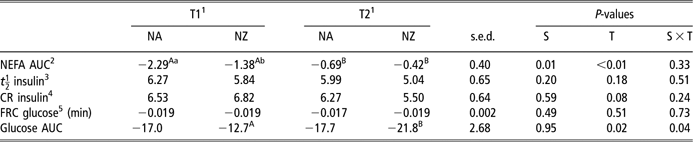
The NA cows had a greater NEFA AUC compared to NZ cows at T1 (P = 0.02), whereas the strains had a similar (P = 0.51) AUC at T2 (Figure 3 and Table 6). The NEFA AUC in response to the insulin challenge was greater in both strains at T1 v. T2 (time effect, P < 0.01). The baseline plasma NEFA concentration, measured as the mean concentration from −45 to 0 min relative to infusion of insulin, was greater at T1 compared to T2 (0.25 v. 0.11 Mmol/l; P < 0.01).
Responses of the NA (◊) and NZ (▪) strains of Holstein–Friesian cattle to intravenous insulin challenges at two stages of lactation (T1 = 32 ± 0.48 (mean ± s.e.) days in milk; T2 = 137 ± 2.44 days in milk). Cows were infused with 1.0 μg/kg BW of bovine pancreatic insulin, administered via the jugular catheter. Areas under the response curve and statistical analysis are outlined in Table 6.

Effect of cow strain on responses to intravenous insulin tolerance tests in early and mid-lactation

NA = North American Holstein–Friesian; NZ = New Zealand Holstein–Friesian; S = strain, T = time period; NEFA=non-esterified fatty acid.
1T1 = 32 ± 0.48 (mean ± s.e.) days in milk; T2 = 137 ± 2.44 days in milk.
2AUC = area under the response curve. Expressed in units of Mmol min/l.
3 t½ = insulin half-life (min).
4CR = clearance rate (%/min).
5FRC = fractional rate of change in glucose between 0 and 20 min after insulin administration. Values represent the slope of the natural logarithm of glucose concentrations (Mmol/l).
ABabMeans having different upper case superscripts differ significantly within strain across time period (P < 0.05). Means having different lower case superscripts differ significantly within time period across strain (P < 0.05).
The FRC in glucose in response to the insulin challenge was similar for both strains at T1 (P = 0.77) and T2 (P = 0.45) (Table 6 and Figure 4). Glucose response to the insulin challenge was also measured as AUC. The NA cows tended to have a greater (P = 0.11) glucose response area at T1, whereas NZ cows tended to have a greater (P = 0.13) response area at T2 (Table 6). This resulted in a significant strain × time interaction for glucose AUC in response to the insulin challenge (P = 0.04). The baseline value for glucose was greater for NA cows compared to NZ cows at T1 (2.94 v. 2.58 Mmol/l; P = 0.04), whereas both strains had similar baseline plasma glucose concentrations at T2 (3.38 v. 3.55 Mmol/l; P = 0.30), resulting in a significant strain × time interaction for baseline glucose concentrations during the insulin challenges (P = 0.04).
Fractional rate of change (FRC) in glucose in response to intravenous insulin for the NA (♦) and NZ (▪) strains of Holstein–Friesian cattle at two stages of lactation (T1 = 32 ± 0.48 (mean ± s.e.) days in milk; T2 = 137 ± 2.44 days in milk). FRC in glucose was calculated as the slope of the natural logarithm of glucose concentration over the initial declining phase (0 to 20 min) plotted v. time. Results are detailed in Table 6. The standard error of mean FRC was 0.002.

The half-life of insulin following insulin administration did not differ between strains at T1 (P = 0.52) or at T2 (P = 0.15). The CR of insulin was similar for both strains at both T1 (P = 0.66) and T2 (P = 0.22). The CR of insulin tended to be greater (P = 0.08) in both strains at T1 compared to T2.
Discussion
The NA and NZ strains of HF cattle differ considerably in their nutrient partitioning and BCS profiles when managed in a pasture-based feeding system. Previous reports have indicated that these two strains have a comparable rate of BCS loss during early lactation; however, NZ cows maintain a higher BCS throughout lactation and have a greater rate of BCS gain post-nadir (Horan et al., Reference Horan, Dillon, Faverdin, Delaby, Buckley and Rath2005; McCarthy et al., Reference McCarthy, Berry, Dillon, Rath and Horan2007), indicating that NA cows maintain preferential partitioning of nutrients to milk production for a greater duration post partum. In the current study, a series of metabolic challenges were carried out to investigate whether strain differences in nutrient partitioning were associated with alterations in tissue responsiveness to homeostatic stimuli. The challenges were carried out during weeks 4 to 5 of lactation, and again during weeks 19 to 20 of lactation, to determine whether the responses of the strains to the challenges varied according to the stage of lactation and EB status.
Calculated EB was more negative for both strains at T1 compared to T2 as expected, though differences in EB between the strains were minor during both time periods. Daily milk yield was greater for NA cows at both time periods, whereas SCM production was similar for both strains at T1 and greater for the NA strain at T2. The NZ cows had higher milk fat concentration, consistent with previous reports from strain comparison studies (Kolver et al., Reference Kolver, Roche, DeVeth, Thorne and Napper2002; Horan et al., Reference Horan, Dillon, Faverdin, Delaby, Buckley and Rath2005). Differences in BCS profiles between the strains were less pronounced in the current study than previously documented (Harris and Kolver, Reference Harris and Kolver2001; Horan et al., Reference Horan, Dillon, Faverdin, Delaby, Buckley and Rath2005). In the current study, both strains had comparable BCS loss during early lactation (T1), and had similar BCS in mid-lactation (T2); however, the NZ cows accumulated significantly more body reserves from T2 to the end of lactation (Patton et al., Reference Patton, Murphy, O’Mara and Butler2008).
Intravenous infusion of glucose resulted in an acute increase in plasma insulin concentrations. The insulin response was similar for both strains at each time period, though both strains had a greater insulin response at T2 compared to T1. This observation is likely a reflection of the superior EB and reduced mammary glucose demand at T2 compared to T1. In support of this, pancreatic insulin secretion in response to glucose and propionate infusions is greater in non-lactating cows than in lactating cows (Lomax et al., Reference Lomax, Baird, Mallinson and Symonds1979). Similarly, Sano et al. (Reference Sano, Narahara, Kondo, Takahashi and Terashima1993) used a hyperglycemic clamp to demonstrate that the increase in circulating insulin concentrations in response to glucose infusion is reduced in lactating compared to non-lactating cows. Staufenbiel et al. (Reference Staufenbiel, Rischk, Schumacher and Becker1992) concluded that flow of metabolites to the mammary gland in early lactation was supported by both reduced pancreatic response to insulinotropic stimuli and decreased responsiveness of peripheral cells to insulin. In any case, there was no evidence of differences in insulin response to an insulinotropic stimulus between the strains in the present study. Chagas et al. (Reference Chagas, Clark, Rhodes, Blache, Kolver and Verkerk2003) showed that NZ Friesian cows had a greater insulin response to a glucose challenge than NA Holstein cows when fed a total mixed ration (TMR) diet, but the opposite occurred on a pasture-only diet. Strain differences in the insulin response to a glucose challenge therefore appear to be dependent on the basal diet (i.e. environment effect).
It is well documented that peripheral tissue responses to insulin are attenuated during early lactation. These tissue-specific adaptations are collectively described as ‘insulin resistance’, and include reduced stimulation of lipogenesis in adipose tissue and whole-body oxidation of glucose (Bauman, Reference Bauman2000). The net effect is to increase the availability of glucose in support of mammary glucose requirements. Insulin resistance occurs whenever normal concentrations of insulin produce a less than normal biologic response. This may be due to a decrease in sensitivity to insulin (i.e. a shift in the dose–response curve to the right), a decrease in maximal response to insulin or a combination of both (Kahn, Reference Kahn1978). Glucose response to the glucose challenge was measured as AUC, half-life (t½) and CR. While no strain differences were apparent for measures of glucose response at T1, it was found that glucose had a greater CR and shorter t½ in NZ cows at T2. This indicates greater insulin responsiveness in the NZ cows compared to NA cows in mid-lactation, as insulin resistance is associated with slower CR, longer t½ and a greater AUC for glucose at similar insulin concentrations (Mertz, Reference Mertz1993). Greater insulin responsiveness in the NZ cows in mid-lactation is consistent with the accumulation of more body reserves from mid-lactation to the end of lactation (Patton et al., Reference Patton, Murphy, O’Mara and Butler2008).
Insulin regulates adipose tissue metabolism by suppressing lipid mobilization and increasing rates of re-esterification (Brockman and Laarveld, Reference Brockman and Laarveld1986). Sechen et al. (Reference Sechen, McCutcheon and Bauman1989) reported that bST-treated cows entered negative EB and had increased basal NEFA concentrations compared to control cows, presumably as part of the coordinated responses necessary to support greater milk production. During glucose and insulin challenges, bST-treated cows had greater decreases in plasma NEFA, indicating that bST-treated cows were more sensitive to the antilipolytic effects of insulin (Sechen et al., Reference Sechen, McCutcheon and Bauman1989). Intravenous infusion of glucose resulted in an acute increase in plasma insulin and a decline in plasma NEFA concentration in the current study, the magnitude of which did not vary between strains or time periods. In contrast to the glucose challenge, the NEFA response to insulin administration varied with both genetic strain and time period. Basal concentrations of NEFA were greater at T1 compared to T2, explaining the greater NEFA AUC responses at T1 compared to T2. The higher basal NEFA concentration at T1 compared to T2 is in agreement with the observed differences in EB between the time periods. This is also consistent with the reduced NEFA response to the insulin challenge at T2, where basal NEFA concentrations were lower. Following insulin administration at T1, NEFA was reduced to a similar concentration at 30 min post infusion in both strains, indicating that the higher basal NEFA concentration in the NA strain was not due to diminished adipose tissue responsiveness to the antilipolytic actions of insulin.
There were significant interactions between strain and time period for glucose AUC in response to the insulin challenge, and also for basal glucose concentration during the insulin challenge. The strain with the greater basal glucose concentration had the greater AUC in response to insulin at both time periods, indicating that the magnitude of the response to insulin was dependent on basal concentration. The fractional rate of change (FRC) in glucose measures the response of insulin-sensitive tissues. No differences were observed in FRC between the strains at either stage of lactation in this study. Mammary tissue utilizes 60% to 90% of circulating glucose during lactation, and mammary tissue is insulin-insensitive (Bell and Bauman, Reference Bell and Bauman1997). Potential strain differences in glucose utilization by insulin-sensitive tissues only affect a small proportion of the total circulating glucose pool, and consequently are difficult to detect. Differences in FRC may be more apparent in later lactation, when cows are in a more positive EB and have a relatively larger proportion of glucose available for tissue accretion (Sechen et al., Reference Sechen, Dunshea and Bauman1990). In the current study, the mean daily EB of the NA and NZ strains were similar; both were in mild NEB at T1 and both were close to neutral EB at T2.
Norepinephrine is a neurotransmitter that stimulates lipolysis and NEFA release in adipose tissue of ruminants and other species (Himms-Hagen, Reference Himms-Hagen1972), and this effect is simulated by epinephrine administration. The effect of epinephrine treatment on adipose tissue mobilization may be determined from the plasma NEFA response profile. Epinephrine binds to both the β- and α2-adrenergic receptors on adipocytes. The elevated concentrations of plasma NEFA after an epinephrine challenge represent the mobilization of fatty acids, the net effect of β-adrenergic-induced lipolysis minus fatty acid re-esterification. Sechen et al. (Reference Sechen, McCutcheon and Bauman1989) reported a 2.2-fold increase in NEFA response to epinephrine when lactating Holstein cows were treated with bST, demonstrating that adipose tissue mobilization in response to lipolytic stimuli was enhanced by bST treatment. In the current study, NEFA response (i.e. mobilization) to the epinephrine challenges was not affected by strain or stage of lactation. Similarly, Kolver et al. (Reference Kolver, Roche, DeVeth, Thorne and Napper2001) reported no difference in plasma NEFA response to an epinephrine challenge between NA HF and NZ HF cows, either in a TMR or in a pasture-feeding scenario. Their study also reported a trend towards a strain × diet interaction for glycerol response to epinephrine, with pasture-fed NA cows and TMR-fed NZ cows having a greater response. These groups had lower EB than their strain counterparts on opposite diets, which suggested that the degree of lipolytic response to epinephrine, but not NEFA mobilization, was influenced by differences in energy status. The EB of the NA and NZ strains was similar within experimental period in the present study. The NEFA AUC of the strains did not differ between time periods however, indicating that energy status did not influence the NEFA mobilization response to epinephrine.
Epinephrine stimulated an acute increase in circulating glucose concentrations, presumably reflecting increased hepatic glycogenolysis and reduced glycogenesis in both strains. The glucose response to epinephrine infusion was greater in NA cows compared to NZ cows in the current study. In contrast, Kolver et al. (Reference Kolver, Roche, DeVeth, Thorne and Napper2001) found no difference in glucose response to epinephrine between the NA HF and NZ HF strains; however, cows fed a TMR had a greater response to epinephrine than pasture-fed cows. Sechen et al. (Reference Sechen, McCutcheon and Bauman1989) also observed an acute increase in plasma glucose after administration of epinephrine, but no difference in response due to bST treatment. As in the current study, Sechen et al. (Reference Sechen, McCutcheon and Bauman1989) observed that plasma insulin concentration was acutely elevated in response to epinephrine. This insulin response counter-regulates the effects of epinephrine on plasma glucose concentration; the degree of insulin response is determined by the magnitude of glucose increase.
Conclusions
The NA and NZ strains of HF cows exhibited some different responses to acute metabolic challenges that varied with the stage of lactation. The greater glucose response to epinephrine of the NA strain indicates enhanced hepatic glycogenolysis and/or reduced glycogenesis. The NA cows also had a greater reduction in plasma NEFA in response to insulin compared to NZ cows in early lactation, due to a higher basal NEFA concentration for NA cows at that time. The NZ cows had a greater glucose CR and shorter half-life than the NA cows in mid-lactation when infused with glucose, indicating that the NA cows may have a greater degree of insulin resistance at that stage of lactation. It is plausible that this plays a key role in the continued preferential partitioning of nutrients to the mammary gland at the expense of body reserve repletion during mid- to late-lactation in the NA cows, whereas NZ cows accumulate body reserves during this period on grass-based diets.
Acknowledgments
The authors would like to thank Mr. J. P. Murphy, Mr. J. Kenneally and the Moorepark farm staff for management and care of the animals. The technical assistance of Mr. T. Condon, Ms. N. Galvin and Ms. N. Hynes is also appreciated. National Development Plan funding is gratefully acknowledged.