Introduction
The concept that depression is accompanied by a dysfunctional reward system has become central to some research programmes investigating models of depression in experimental animals (Nestler & Carlezon, Reference Nestler and Carlezon2006) and has been used to account for symptoms of depression, including an inability to experience reward (anhedonia) and negative automatic thoughts, rumination and negative beliefs. More formal conceptions of depression emphasize either a reduction in the efficacy of positive reinforcement (Costello, Reference Costello1972; Watson et al. Reference Watson, Clark and Carey1988) or an increase in the efficacy of punishment (Chiu & Deldin, Reference Chiu and Deldin2007). Clinical observations suggest that depressed patients have a tendency to focus on negative rather than positive aspects of their lives, and can show facilitated recall of negative experiences or reinforcement (Lloyd & Lishman, Reference Lloyd and Lishman1975; Nelson & Craighead, Reference Nelson and Craighead1977). One consequence of an asymmetric influence on reinforcement learning of negative mood, or individual differences in the predisposition to depression, could be the acquisition of the dysfunctional beliefs that accompany depressive illness (Beck, Reference Beck1967).
Several laboratories have investigated the behavioural consequences of reinforcement, both positive and negative, in depression. For example, Sahakian and colleagues have demonstrated that patients have an abnormal response to negative feedback, by examining the effects of negative feedback on subsequent performance on tests of executive function or recognition memory (Beats et al. Reference Beats, Sahakian and Levy1996; Elliott et al. Reference Elliott, Sahakian, Herrod, Robbins and Paykel1997, Reference Elliott, Sahakian, Michael, Paykel and Dolan1998). Another way to test this hypothesis is to examine whether subjects adapt their responding faster following negative feedback (Murphy et al. Reference Murphy, Michael, Robbins and Sahakian2003; Taylor Tavares et al. Reference Taylor Tavares, Clark, Furey, Williams, Sahakian and Drevets2008). Murphy et al. (Reference Murphy, Michael, Robbins and Sahakian2003) showed that depressed patients were more likely to reverse a learned stimulus–response relationship following misleading negative feedback than were controls. This effect contrasts with ‘perseveration’ on the reversal task, where subjects continue to respond on a previously rewarded but now incorrect stimulus. Perseveration has been modelled as reduced sensitivity to negative feedback (Frank, Reference Frank2005). The abnormal response to negative feedback may lead to the faster learning of associations between stimuli and negative feedback, and hence allow faster behavioural adaptation following negative feedback.
Frank et al. (Reference Frank, Seeberger and O'Reilly2004) used a novel probabilistic learning task (probabilistic selection task) that allowed them to determine separate learning rates accompanying negative and positive feedback. The task consists of a training phase, in which subjects learn three concurrent discriminations (stimulus pairs AB, CD and EF), rewarded with schedules of 80%/20%, 70%/30% and 60%/40% respectively. There is then a test phase, in which all stimuli are recombined, and the subject must select the stimulus they think most likely to be correct. No feedback is given at this stage. This task was administered to medicated Parkinson's disease (PD) patients, unmedicated PD patients and healthy, age-matched controls. The authors found that medicated PD patients were more likely successfully to select stimuli associated with positive feedback (stimulus A) than were able successfully to avoid stimuli learned by negative feedback (stimulus B). This suggested the medicated PD patients learned more about positive feedback than both unmedicated PD patients and controls. By contrast, unmedicated PD patients showed the opposite pattern, learning more about negative feedback than both medicated PD patients and controls. Similarly, during the training phase, unmedicated PD patients were more likely to change the stimulus they selected of a pair following negative feedback.
These findings have implications for the theories of depression. First, PD is often accompanied by depressive symptoms, which can be influenced by dopaminergic medication (Black et al. Reference Black, Hershey, Hartlein, Carl and Perlmutter2005). Second, there may be alterations in dopaminergic function in depressed patients (Tremblay et al. Reference Tremblay, Naranjo, Cardenas, Herrmann and Busto2002, Reference Tremblay, Naranjo, Graham, Herrmann, Mayberg, Hevenor and Busto2005). Third, l-dopa causes a pattern of responding on the probabilistic learning task that contrasts with that observed in depressed patients; that is, medicated PD patients are slower to alter responding following negative feedback during contingency reversal (Swainson et al. Reference Swainson, Rogers, Sahakian, Summers, Polkey and Robbins2000; Cools et al. Reference Cools, Barker, Sahakian and Robbins2001, Reference Cools, Altamirano and D'Esposito2006). Together, these data support the prediction that depressed patients should show an asymmetric bias on the probabilistic selection task, being better at avoiding B than selecting A at the test phase of the task.
In a more recent study, Frank et al. (Reference Frank, Moustafa, Haughey, Curran and Hutchison2007) used two separate Q-learning models to describe the choice data obtained from the training and test phases. Each model contained three free parameters: one controlling the amount of updating of Q-values following positive feedback (positive learning rate), another controlling updating following negative feedback (negative learning rate), and the exploration/exploitation parameter, which controls the relationship between Q-value and choice. The test phase learning rate parameters are those that result in Q-values for each stimulus that best describe choice behaviour on the test phase, given the feedback received during the training phase (as there is no feedback during the test phase). The authors found that three different genotypes, all influencing dopaminergic neurotransmission, independently influenced learning rate parameters: DARPP-32 and DRD2 polymorphisms influenced test phase performance (select A/positive learning rates and avoid B/negative learning rates respectively). Finally, the Val158Met polymorphism of the catechol-O-methyl transferase (COMT) gene influenced training phase performance: subjects who were Val/Val homozygotes seemed to be less sensitive to recent negative feedback, as compared to the Val/Met and Met/Met groups, in that they were less likely to switch following negative feedback. Best-fitting model parameters revealed that Val/Val had a lower training phase negative learning rate than the other two groups.
Steele et al. (Reference Steele, Kumar and Ebmeier2007) used a prediction error learning algorithm to model behavioural performance in depressed patients. They examined changes in reaction time (RT) following wins and losses during a decision-making task. Controls showed robust speeding of RT following wins and slowing following losses. These changes in RT were significantly smaller in depressed patients than in controls. In addition, self-reported anhedonia, as measured by the Snaith–Hamilton Pleasure Scale (SHAPS), correlated with this feedback-related speeding/slowing effect: in both the control and patient groups, increases in anhedonia led to a reduction in the magnitude of the effect. These findings of Steele et al. (Reference Steele, Kumar and Ebmeier2007) might be contrasted with other data showing a reduction in depressed patients' response bias during rewarding contingencies but a similar adaptation to punishment contingencies (Henriques et al. Reference Henriques, Glowacki and Davidson1994; Pizzagalli et al. Reference Pizzagalli, Jahn and O'Shea2005). Hence, there is a tension in the literature between studies demonstrating a negative bias, in which positive feedback has a smaller influence on behaviour than negative feedback, and studies demonstrating a blunting effect, or a reduction in the effect of either kind of feedback on behaviour.
We examined the predictions that followed from these studies of reward function in depression using the probabilistic selection task (Frank et al. Reference Frank, Seeberger and O'Reilly2004, Reference Frank, Moustafa, Haughey, Curran and Hutchison2007). Specifically, evidence of asymmetry would be reflected in a group×valence interaction, where superior avoidance responses, manifest in a negative learning rate compared to a positive learning rate, were anticipated. Alternatively, evidence for blunting would be supported by the presence of a main effect of group, specifically where depressed patients' performance was worse or learning rates were lower, compared to controls, irrespective of positive or negative feedback. To evaluate these hypotheses, we analysed the ability of patients and controls to select stimulus A versus avoid stimulus B. We also determined best-fitting positive and negative learning rate parameters for the training and test phase, and investigated whether group or SHAPS scores would influence these variables, as Steele and colleagues had suggested.
Method
Participants
Twenty-three out-patients (13 males) with a DSM-IV (APA, 1994) diagnosis of major depressive disorder of recent onset participated in this study. Patients with other DSM-IV Axis I disorders and those with neurological or general medical disorders likely to affect cognition were excluded and those who had had electroconvulsive therapy (ECT) in the previous year were also excluded. Of the 23 patients, three were not on antidepressants (two were not medicated at all), 14 patients received a single antidepressant, and six took two or more in combination. Twelve patients took selective serotonin reuptake inhibitors, three took selective serotonin and noradrenaline reuptake inhibitors, five took tricyclic antidepressants, five took trazodone and one took bupropion. Six patients were also on mood stabilizers, two on propranolol, and four were taking opiate analgesics. The medication was continued unchanged during the study.
Twenty-three healthy matched controls (12 males), without a history of psychiatric or neurological disease, were recruited from the local community. Controls were group matched to the patient group for age and gender. The National Adult Reading Test (NART; Nelson & Willison, Reference Nelson and Willison1991) was administered to all subjects as a measure of (pre-morbid) intellectual functioning. All subjects provided informed consent approved by the Suffolk Research Ethics Committee/Charing Cross Hospital Research Ethics Committee/Cambridgeshire 2 National Health Service (NHS) Trust Local Research Ethics Committee, and were paid for their participation.
See Supplementary material (available online) for further information about questionnaire measures.
Probabilistic selection task procedure (Frank et al. Reference Frank, Seeberger and O'Reilly2004)
The task was administered on a portable PC with a touchscreen. Three different stimulus pairs (AB, CD, EF) were presented in random order and were reinforced with the following probabilities (A, 80%; B, 20%; C, 70%; D, 60%; E, 60%; F, 40%). Positive feedback was signalled by the word ‘correct’ and a high-pitched beep; negative feedback was signalled by the word ‘incorrect’ and a low-pitched beep. Subjects had 4000 ms to select one of the pair: failure to respond led to feedback encouraging the subject to respond faster on the next trial. Hiragana characters were randomly assigned to represent stimuli A–F for each subject. Subjects performed the training phase until they had reached a performance criterion that was evaluated after every block of 60 trials, up to a maximum of 10 blocks.
A different criterion was used for each pair of stimuli (65% A in AB, 60% C in CD, 50% E in EF). After reaching this criterion, participants were tested with the same training pairs and all novel combinations of stimuli. Each test pair was presented six times and no feedback was provided. If a subject did not select A in an AB pair during the test phase four times out of six, the subject's test data were excluded.
Data analysis
One-way analysis of variance (ANOVA) for age and NART IQ were conducted to ensure adequate matching across groups. Behavioural performance was analysed using ANOVA with group as a two×two level between-subjects variable (controls, patients; male, female). Three aspects of behavioural performance were examined with repeated-measures ANOVA: test phase avoid B versus select A performance (two levels), percentage correct during task acquisition, and RTs. Percentage correct scores during acquisition were split in terms of each stimulus pair (three levels). RTs during acquisition were split by stimulus pair (three levels) and whether the subject was reinforced or punished on the previous presentation of a given stimulus pair (two levels). A second RT analysis (two levels) was performed in which RTs from the test phase were split in terms of whether the trial required the subject to select between two stimuli associated with positive feedback (A, C, E) or between two stimuli associated with negative feedback (B, D, F). Learning rate and exploration/exploitation parameters were derived from a Q-learning algorithm (see online Supplementary information for more detail). Analyses of these data were performed by inserting the positive and negative learning rates (two levels) from the training phase and test phase into separate ANOVA models. Group (depressed/controls) was inserted as a between-subjects variable in all ANOVAs. Exploration/exploitation parameters were analysed for each phase in separate univariate ANOVAs.
The effect of depression severity and personality variables on performance was investigated. We were particularly interested in the SHAPS questionnaire given prior data (Steele et al. Reference Steele, Kumar and Ebmeier2007), and hence we inserted this variable as a covariate in ANCOVAs evaluating Q-learning learning rates, modelling the effect of group, SHAPS and the group×SHAPS interaction. Follow-up Pearson correlation coefficients were calculated for the associations between performance and score on the questionnaire measure where appropriate.
The Greenhouse–Geisser correction was applied when the homogeneity of variances was violated. An α-level of 0.05 was used in all planned statistical comparisons. χ2 analysis was performed to test for differences in reaching the acquisition phase criterion. Several subjects did not reach the criterion imposed by the task, or found the task frustrating and quit.
Results
Task completions and acquisition errors
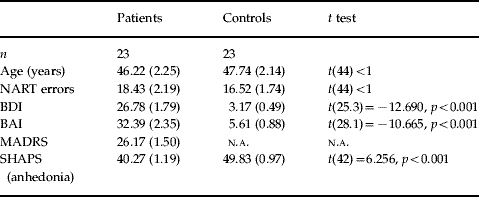
Twenty-three subjects in each group attempted the task. Six controls and five patients either voluntarily quit the task or did not reach AB criterion on the test phase. Considering only the subjects who reached the criterion, a repeated-measures ANOVA on percentage correct scores for each stimulus pair (AB, CD, EF) was performed. There was an effect of stimulus pair [F(2, 66)=12.371, p<0.001]: performance was worse on less reliable stimulus pairs (e.g. EF) than on more reliable stimulus pairs (e.g. AB). The main effect of group was not significant [F(1, 33)<1], neither was the group×stimulus interaction [F(2, 66)=1.411, p=0.251]: both patients and controls acquired the task in a similar manner. The patient and control groups who reached the criterion were matched for age and NART IQ (see Table 1 for demographic information for all participants).
Demographic variables and performance of patients and controls on the probabilistic selection task (mean/standard error of the mean). Two patients' SHAPS scores were missing (n=21)

SHAPS, Snaith–Hamilton Pleasure Scale; NART, National Adult Reading Test; BDI, Beck Depression Inventory; BAI, Beck Anxiety Inventory; MADRS, Montgomery–Åsberg Depression Rating Scale; n.a., not available.
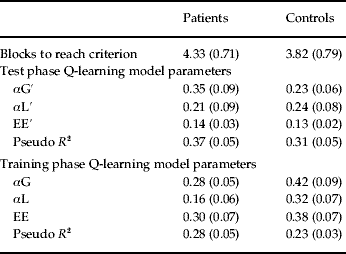
Learning rate parameters for the Q-learning model that best fit the training phase data (αG and αL; see Table 2) were compared at the group level. The main effect of parameter type approached significance [F(1, 33)=3.514, p=0.07], with the positive learning rate parameter being larger than the negative learning rate parameter [a similar pattern of results is reported in Supplementary information Table 2 of Frank et al. Reference Frank, Moustafa, Haughey, Curran and Hutchison2007]. The parameter type×group interaction was not significant [F(1, 33)<1] but the main effect of group approached significance [F(1, 33)=3.493, p=0.071, partial η2=0.092), with patients having numerically lower parameter values than controls for both positive and negative learning rates. A t test revealed that the training phase exploration/exploitation parameter did not differ between the groups [t(33)<1; see Table 2 for all training phase parameter values].
Dependent measures obtained from the probabilistic selection task. Pseudo R2 reflects how much of the variance in subjects' performance the model accounts for

Test phase performance
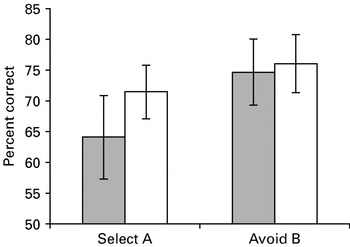
There was no main effect of selection type [avoid B or select A: F(1, 33)=2.072, p=0.159], no group×error type interaction [F(1, 33)=0.322, p=0.574] and no main effect of group [F(1, 33)<1; see Fig. 1]. Learning rate (positive and negative) and exploration/exploitation parameters for each subject were obtained by fitting the Q-learning model to test phase choice performance (see Table 2). Consistent with the analyses above, no main effects of learning rate valence or group were observed [F(1, 33)<1 for each], nor was a group×learning rate interaction observed [F(1, 33)=1.052, p=0.313]. Likewise, no effects of group on the exploration/exploitation parameter were observed [t(33)<1; see Table 2 for test phase parameter values].
Select A and Avoid B (test phase) performance for patients (□) and controls ( ) who had passed the criterion on the training phase.

RTs
Training phase RTs were split by stimulus pair (AB, CD, EF) and by whether the response was preceded by a win or loss on that pair. There was a main effect of win/loss [F(1, 33)=12.391, p=0.001]: subjects were slower following a loss than a gain. There was no group×win/loss interaction [F(1, 33)=2.040, p=0.163] but there was a main effect of group [F(1, 33)=5.757, p=0.022], where patients were significantly slower than controls. There was no main effect of stimulus pair, and none of the other interaction terms were significant.
RTs during the test phase were split depending on whether the subject had to choose between two stimuli associated with positive feedback (A, C, E) or between two stimuli associated with negative feedback (B, D, F). A main effect of decision type was observed [F(1, 33)=25.846, p<0.001], but the group×type interaction was not significant [F(1, 33)<1]. The main effect of group was not significant during this phase [F(1, 33)=2.295, p=0.139].
Questionnaire variable: SHAPS
Following Steele et al. (Reference Steele, Kumar and Ebmeier2007), we examined the relationship between trial-by-trial adaptation during the training phase and SHAPS scores, by inserting the positive and negative learning rate parameters into an ANCOVA. There was a main effect of SHAPS score [F(1, 29)=12.954, p=0.001, partial η2=0.31] but no effect of group or group×SHAPS score interaction, nor were any of the parameter type×group or SHAPS score interactions significant [F(1, 29)<1 in all cases]. A similar effect was observed with the test phase learning rate parameters: the main effect of SHAPS score was significant [F(1, 29)=5.695, p=0.024] but none of the other main effects or interactions were significant [F(1, 29)<1 in all cases].
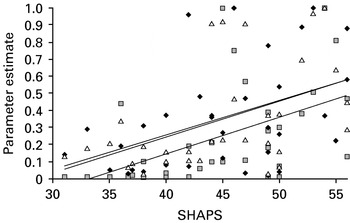
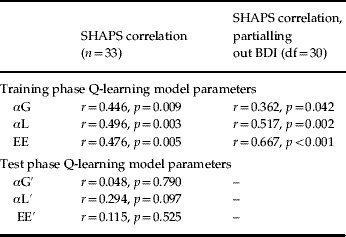
There were significant correlations between SHAPS scores and Q-learning model parameters selected to fit training phase performance, for all subjects (see Table 3). Decreasing SHAPS scores (greater anhedonia) led to lower parameter values (see Fig. 2). Although SHAPS scores were smaller in the depressed group (see Table 1) and SHAPS scores correlated with those on the Beck Depression Inventory (BDI) (r=−0.777, n=33, p<0.001), the correlations between model parameters and SHAPS scores remained significant if the BDI was partialled out. The equivalent correlations with the test phase data were not significant. There was no evidence of an effect of SHAPS scores on win/loss modulation of RTs (r=−0.004, n=33, p=0.984).
Effect of anhedonia symptoms [Snaith–Hamilton Pleasure Scale (SHAPS) scores] on training phase Q-learning model parameters: αG (◆; positive learning rate); αL (; negative learning rate); EE (▵; exploration/exploitation parameter). Decreasing SHAPS scores reflect greater anhedonia symptoms.

Table of correlations between Q-learning model parameters and SHAPS and the same relationship, correcting for BDI (training phase data only)

SHAPS, Snaith–Hamilton Pleasure Scale; BDI, Beck Depression Inventory; df, degrees of freedom.
Summary
We found no evidence for an asymmetric effect of depression on positive or negative learning rates during the test phase, and hence no support for our hypothesis that depressed patients learn faster about the causes of negative events than positive events. However, we did observe that anhedonia was associated with smaller learning rates on the training phase and test phase. Patients were slower to respond during the training phase but showed a similar modulation of RT as controls, depending on whether the previous presentation of a stimulus pair was reinforced or not.
Discussion
In this study the performance of depressed patients and matched never-depressed controls was evaluated on a probabilistic learning task designed by Frank et al. (Reference Frank, Seeberger and O'Reilly2004). This paradigm allows independent assessment of learning rates following negative feedback and positive feedback. Contrary to our predictions, depressed patients did not show a test phase learning rate asymmetry in that they were no better at avoiding the stimulus associated most reliably with negative feedback (stimulus B) than they were at selecting a stimulus associated most reliably with positive feedback (stimulus A). Neither patients nor controls showed such a bias, nor did a bias correlate with symptom severity or with measures of reward sensitivity or anhedonia.
Although the majority of patients were medicated, we would also not necessarily have expected patients' medication to mask the presence of negative bias – although clearly it might. The patients studied in both the study by Murphy et al. (Reference Murphy, Michael, Robbins and Sahakian2003) and the present study were medicated, and it is possible that such medication contributes to the faster reversal observed on the probabilistic reversal learning task (Chamberlain et al. Reference Chamberlain, Muller, Blackwell, Clark, Robbins and Sahakian2006; but see Taylor Tavares et al. Reference Taylor Tavares, Clark, Furey, Williams, Sahakian and Drevets2008). Clearly, however, this pattern of findings contrasts with our null findings on the probabilistic selection task. Our finding of the absence of the predicted asymmetric effect of depression on the test phase of the task finds further support in the observation that dysphoric students also showed a marginally significant bias in the opposite direction (positive >negative; Cavanagh, Frank and Allen, unpublished observations).
However, we did observe that the severity of self-reported anhedonia, as assessed by the SHAPS, correlated negatively with learning rate parameters determined during the training phase, such that trial-by-trial adaptation of behaviour was associated with increasing anhedonia. This finding is consistent with the study by Steele et al. (Reference Steele, Kumar and Ebmeier2007), in which trial-by-trial changes in RT resulting from reward and punishment were modelled using a prediction error learning algorithm. This group also showed a reduction in the magnitude of these parameters with increasing anhedonia, and together these data support the notion that anhedonia, as measured by SHAPS, is related to blunting, or the inability of reinforcement to alter behaviour. A key aspect of the results was that the diagnosis group (depression versus control) accounted for considerably less of the variance in blunting than individual differences in anhedonia, and the effect of depression on blunting was very small if anhedonia was factored out. The pattern of these results is consistent with the statistical modelling of Leventhal et al. (Reference Leventhal, Chasson, Tapia, Miller and Pettit2006), who considered hedonic capacity as a distinct (but statistically associated) entity from depression per se. This perspective provides a parsimonious account of the pattern of our data; depression is associated with a reduction in hedonic capacity, which predicts the degree of blunting.
However, there are several differences between our data and those of Steele et al. (Reference Steele, Kumar and Ebmeier2007). First, Steele et al. used their model to capture individual differences in RTs whereas we attempted to model choice behaviour. We observed a main effect of RT, such that depressed patients were slower than controls during the training phase. This is commonly observed (Azorin et al. Reference Azorin, Benhaim, Hasbroucq and Possamai1995), although not by Steele et al. (Reference Steele, Kumar and Ebmeier2007). However, although we observed a modulation of RT following reward and punishment during the training phase, this was not affected by group or by anhedonia. There are several differences between the probabilistic selection task and the Steele et al. (Reference Steele, Kumar and Ebmeier2007) paradigm; notably, the latter enforced a more stringent response window (2.5 s compared to 5 s) and there was no contingency to learn (subjects had an equal chance of being correct or incorrect, regardless of how they responded). It may be that the RT measure from the probabilistic selection task reflects a variety of processes, including the retrieval of associations and hypothesis testing, for which time does not allow in the Steele et al. paradigm.
Kumar et al. (Reference Kumar, Waiter, Ahearn, Milders, Reid and Steele2008) observed a reduction in neural activation correlating with temporal difference prediction error learning signals in depressed patients, including the ventral striatum and the dorsal anterior cingulate, and reduced deactivation in the rostral anterior cingulate, retrosplenial cortex and hippocampus. The activation in the majority of these regions was also modulated by a dose of medication given to control participants. However, increasing depression severity increased activation in the ventral tegmental area (VTA) whereas increasing anhedonia (as measured by SHAPS) increased activation in the amygdala. Further work should determine how the activity of these regions is orchestrated to influence learning rate and anhedonia.
Although we failed to see a negative bias on the test phase of the paradigm, a study of Luu et al. (Reference Luu, Collins and Tucker2000) contributes an alternative principle that might account for the discrepant data from different paradigms. These authors observed a larger error-related negativity (ERN), an event-related potential thought to be related to negative prediction errors (see Holroyd & Coles, Reference Holroyd and Coles2002), in a high- compared to a low-negative affect group. However, this was only observed in the first block of the task. Later in the task, ERN amplitude became smaller in the high-negative affect group than in the low-negative affect group. Effects such as attentional disengagement might account for these findings, and could suggest that a negative bias might only be detected if the paradigm is sufficiently short or straightforward. These principles might explain the efficacy of the probabilistic reversal task for demonstrating the abnormal response to negative feedback in depression (Murphy et al. Reference Murphy, Michael, Robbins and Sahakian2003; Taylor Tavares et al. Reference Taylor Tavares, Clark, Furey, Williams, Sahakian and Drevets2008). As regards the wider implications for the empirical basis of the negative bias in depression, we would argue that experimental details of the paradigms used are likely to be significant. These include task dimensions such as the stimulus materials (e.g. the nature of feedback stimuli), the behavioural measure (e.g. RT modulation, behavioural choice or subjective rating) and the task contingencies used (e.g. probabilistic reinforcement contingencies).
Summary
In this study we investigated whether depressed patients showed improved avoidance behaviour for stimuli associated with negative feedback, compared to approach behaviour for stimuli associated with positive feedback, using a novel procedure designed by Frank et al. (Reference Frank, Seeberger and O'Reilly2004). Such a result is predicted by some existing literature (Henriques et al. Reference Henriques, Glowacki and Davidson1994; Murphy et al. Reference Murphy, Michael, Robbins and Sahakian2003; Pizzagalli et al. Reference Pizzagalli, Jahn and O'Shea2005; Chiu & Deldin, Reference Chiu and Deldin2007) and is suggested by psychological accounts of depression (Beck, Reference Beck1967). However, our data were better described by a different construct, namely a ‘blunted response’ to reinforcement as a consequence of anhedonia (Steele et al. Reference Steele, Kumar and Ebmeier2007). We observed a reduction in the learning rate of associating stimuli with both positive and negative feedback with increasing symptoms of anhedonia, on both the test and training phases of the task.
Acknowledgements
This work was funded by a Wellcome Trust Programme Grant (to T.W.R., B.J.S., B. J. Everitt and A. C. Roberts) and completed within the University of Cambridge Behavioural and Clinical Neuroscience Institute, supported by a consortium award from the Medical Research Council (MRC), UK and the Wellcome Trust. H.W.C. was supported by a 3-year MRC studentship while this work was carried out.
Declaration of Interest
T.W.R. and B.J.S. consult for Cambridge Cognition.
Note
Supplementary material accompanies this paper on the Journal's website (http://journals.cambridge.org/psm).