Introduction
Copper sulfide has been a material of interest for photovoltaic applications for several years.[Reference Das, Vankar, Nath and Chopra1] Among its advantageous properties is the fact that it is composed of inexpensive and abundant elements. When present in the chalcocite phase (Cu2S), it has an optical band gap of 1.2 eV[Reference Das, Vankar, Nath and Chopra1] and a relatively high extinction coefficient, so that submicron films are sufficient for photovoltaic device fabrication.[Reference Grozdanov and Najdoski2] Among its disadvantages, is the fact that it can be found in a broad range of stoichiometry, from Cu2S (chalcocite) to CuS (covellite). Growth of multiple phases leads to films with poor electronic properties, so that phase control is critical for achieving high efficiency devices. Copper sulfide-based solar cells use a cadmium sulfide window layer, and processing of the junction at high temperature leads to copper diffusion into the window layer, which results in efficiency loss. Various growth techniques have been investigated with the goal of overcoming these limitations. Spray pyrolysis has been used for the direct growth of thin films starting from, for instance, dispersions of copper chloride and thiourea in water or water–ethanol solutions.[Reference Isac, Duta, Kriza, Manolache and Nanu3, Reference Krunks, Mellikov and Bijakina4] Another approach that has attracted significant attention is the nucleation and growth of copper sulfide nanocrystals. This strategy is compatible with the development of printable inks, which would enable the deposition of active layers using low-cost, roll-to-roll techniques. In Ref. Reference Larsen, Sigman, Ghezelbash, Doty and Korgel5 thermolysis of a copper thiolate complex leads to the formation of chalcocite nanorods. In Ref. Reference Wu, Wadia, Ma, Sadtler and Alivisatos6 nearly monodispersed 5 nm chalcocite crystals are obtained via a liquid phase, batch reaction of copper acetylacetonate in a mixture of dodecanethiol, oleic acid, and ammonium diethyldithiocarbamate. The authors demonstrate a working solar cell with an efficiency of 1.6% by printing CdS and Cu2S nanocrystal layers without any additional annealing.
Most of the techniques for the growth of copper sulfide nanocrystals are based on batch reactions. In this paper, we propose a continuous, gas-phase approach based on aerosol spray pyrolysis reaction. We choose copper diethyldithiocarbamate [Cu(dedc)2] as a precursor. This molecule decomposes into copper sulfide between 200 and 250 °C.[Reference Jen-La Plante, Zeid, Yang and Mokari7–Reference Sceney, Smith, Hill and Magee9] A similar combination of an aerosol pyrolysis system and a metal alkyldithiocarbamate precursor has been recently proposed by Liu et al. [Reference Liu, Zhang and Swihart10] for the production of ZnS nanocrystals. Zinc, copper, and tin alkyldithiocarbamates have also been successfully used for the nucleation and growth of copper–zinc–tin–sulfide (CZTS) nanocrystals.[Reference Khare, Wills, Ammerman, Norris and Aydil11] In this paper we aerosolize a solution of Cu(dedc)2 in toluene and flow the aerosol through a tube furnace. The droplets dry and the precursor is converted into metal sulfide nanocrystals, which are then easily collected at the exit of the furnace via filtering.
Experimental details
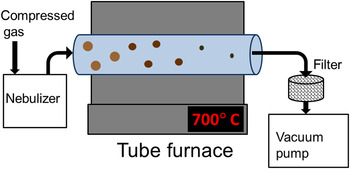
A schematic of the experimental apparatus is shown in Fig. 1. The system is composed of a tube furnace, a vacuum pump, and a nebulizer. We have tested several different approaches to generate an aerosol, with qualitatively identical results. We have tested an ultrasonic nebulizer from Sonaer Ultrasonics (Farmingdale, NY), a single jet collison-type atomizer from BGI (Waltham, MA), and an Iwata Eclipse (Kohoku-ku, Yokohama, Japan). HP-BCS airbrush spray system typically used for spray painting. The carrier gas is nitrogen for all cases. Typical flow rates are in the range of 10–15 scfh. The ultrasonic and the jet nebulizer generate aerosols with an average droplet size of 2.2 µm, based on the products specifications. The airbrush generates larger droplets (5–10 µm, as reported in Ref. Reference Girotto, Rand, Genoe and Heremans12), and is capable of larger throughput. The precursor concentration in toluene is typically 4–6 mg/mL. When the airbrush is used, the solution is aerosolized at a rate of ~4 mL/min. The reactor is composed of a 1″ diameter quartz tube. The high-temperature region has a length of 12″. The system is run at a typical pressure of 200 Torr, and the residence time in the hot region of the furnace is ~500 ms based on the flow velocity. Cu(dedc)2 is synthesized by reacting copper (II) chloride with sodium diethyldithicarbamate, following the procedure described in Ref. Reference Khare, Wills, Ammerman, Norris and Aydil11. The reactants are purchased from Sigma Aldrich (St. Louis, MO). The reaction temperature is varied between 500 and 800 °C. The samples are analyzed by collecting the powder downstream of the hot reaction zone onto a stainless-steel filter. Transmission electron microscopy (TEM) grids are prepared by placing the grids directly onto the filter, and by exposing the grid to the flow for 1 min. The powder can also be mechanically removed from the filter and placed onto a zero-background substrate for x-ray diffraction (XRD), or dispersed in organic solvents such as chloroform for optical absorption measurements.
Schematic of the experimental apparatus.

Results and discussion
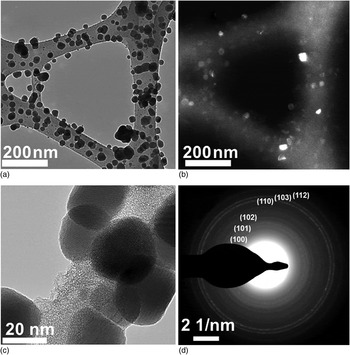
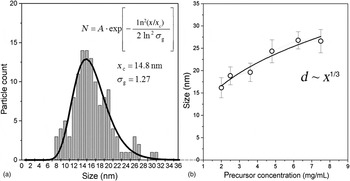
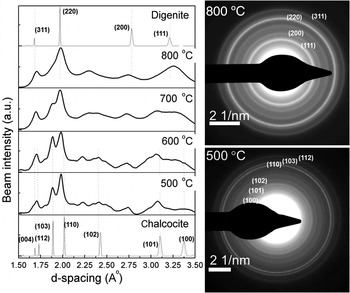
In Fig. 2 we show a series of TEM micrographs for powder produced at a furnace temperature of 500 °C. Nanoparticles have a size of approximately 20 nm [Fig. 2(a)]. The corresponding dark field image [Fig. 2(b)] shows a variation in contrast that is typical of a sample composed of crystalline nanoparticles. A higher magnification image [Fig. 2(c)] clearly shows lattice fringes, confirming that the particles have a crystalline structure. Finally, Fig. 2(d) shows the selected area diffraction pattern generated from a large area that includes hundreds of crystalline particles. Based on the diffraction pattern, we identify the material's phase as chalcocite (Cu2S). The phase identification is based on standard diffraction patterns available via the Inorganic Crystal Structure Database (ICSD, FIZ Karlsruhe). A representative particle size distribution is shown in Fig. 3(a). This was generated by analyzing several TEM micrographs and by using the image software analysis ImageJ. The size distribution is well fitted by a log-normal function with an average size of 14.8 nm and a geometric standard deviation of 1.28. This value is close to 1.355, which is the asymptotic geometric standard deviation for neutral aerosols undergoing Brownian coagulation,[Reference Lee, Chen and Gieseke13] suggesting that significant growth by agglomeration occurs in this system. Nevertheless, the particle size can be easily controlled by varying the precursor concentration in solution. In Fig. 3(b), we show the dependence of the average size on the concentration, and we notice that the size varies approximately with an ~x 1/3 correlation, where x is the precursor concentration. This implies that the particle volume varies linearly with the precursor concentration. We should point out that the spray pyrolysis system is more efficient at converting the precursor into powder at increasing temperatures. Under such a condition, particles with a digenite (Cu1.8S) structure are produced. In the supplementary document we show the XRD spectrum for powder produced at 800 °C, which can be easily identified as digenite (Cu1.8S). Using the airbrush as a nebulizer and a solution concentration of 5.7 mg/mL, we have measured a production rate of 1 mg/min at 500 °C and of 3 mg/min at 800 °C. The production decreases again below 1 mg/min at 900 °C, most likely because of the increased diffusional losses to the reactor wall. Given the precursor concentration and the rate with which it is nebulized and processed (3 mL/min), we calculate that ~79% of the precursor is converted into powder at a temperature of 800 °C. Selected area diffraction patterns for samples produced between 500 and 800 °C are shown in Fig. 4. Using the image software analysis ImageJ we have radially integrated the profiles and converted the data as diffraction beam intensity as a function of d-spacing. The standards for chalcocite (Cu2S) and digenite (Cu1.8S), as obtained from the ICSD database, are also shown in Fig. 4. The variation in the diffraction pattern is consistent with transition from a chalcocite phase at low temperature (500 °C) to a digenite phase at higher temperature (800 °C). The capability of smoothly adjusting the phase of the produced material is particularly important for the case of copper sulfide, since phase purity determines the quality of the absorber layer for photovoltaic applications. In the supplementary document we also show the results of optical absorption analysis on powder produced at 800 °C. This is performed by dispersing the powder in chloroform. This spectrum is typical of digenite.[Reference Grozdanov and Najdoski2]
TEM analysis of copper sulfide nanocrystals produced at a furnace temperature of 500 °C. (a) and (b) are a bright field and the corresponding dark field micrographs. A higher magnification image is shown in (c). In (d) we show the selected area diffraction pattern for this sample. The selected area is sufficiently large to include hundreds of nanocrystals, resulting in polycrystalline ring formation. The pattern is indexed based on the high-chalcocite standard from the ICSD (FIZ Karlsruhe).

(a) Typical particle size distribution for the sample shown in Fig. 2. (b) Dependence of particle size with the precursor concentration. The error bar corresponds to the size distribution standard deviation.

Variation in the selected area diffraction pattern with furnace temperature. The standards for digenite and chalcocite are also shown.

Summary
We have shown that a spray pyrolysis approach is a feasible candidate for production of copper sulfide nanocrystals. Good production rate and good control over the phase of the material have been achieved by using a single precursor, copper diethyldithiocarbamate.
Supplementary materials
For supplementary material for this article, please visit http://dx.doi.org/10.1557/mrc.2013.10
Acknowledgments
This material is based upon work supported by the National Science Foundation under Grant 1125660 (BRIGE Award).