The last remaining gap in the twentieth-century national accounts of Russia and its successor state, the Soviet Union, runs from 1913 to 1928. This gap is crowded with momentous events including Russia's Great War (1914 to 1917), the Bolshevik Revolution of 1917, the Civil War (1918 to 1921), and the years of postwar recovery that turned out to be the prelude to Stalin's revolution from above.
These events raise many questions. How effectively did alternative government policies and economic systems mobilize the economy in time of war? After seven years of international and civil conflict, how great and how persistent were the damage and losses? Did the mixed economy of the 1920s provide an effective framework for sustained recovery? Did Stalin's five-year plans take a fully recovered economy as their starting point, or was there still a backlog of unexploited potential? All of these questions are made more difficult to answer by the lack of continuous and consistent national income data.
In this article, we provide new estimates of the real national income of Russia and the Soviet Union for the missing years and we apply them to these questions. In addition, the missing years have significance beyond Russia. The horrors of war and civil war in Russia were not unique. By filling the gap, we also aim to place Russia more precisely in the spectrum of national experiences of conflict in the nineteenth and twentieth centuries.
We are not the first to labor in this vineyard. Scholars and government agencies inside and outside Russia have provided important studies of sectoral activity and economic aggregates in particular subperiods and on varying definitions.Footnote 1 These are our starting points, but they also present a range of difficulties including incomplete coverage of time and space, and conceptual inconsistency with national income measures of earlier and later periods and other countries. As we discuss below, nearly all estimates of Soviet output follow, intentionally or by default, a material-product concept that excludes final services. Some estimates take into account only industry and agriculture, while others suffer from significant statistical biases.
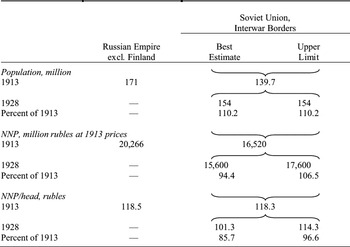
Paul Gregory's estimates of real GDP in 1913 and 1928 on Soviet territory from nominal outlays and expenditure deflators are the most authoritative and consistent of previous studies.Footnote 2 He did not fill in the gap of the intervening years, but he built a glass bridge across them. As Table 1 shows, Gregory found that in 1928 real national income exceeded its 1913 level (within the same borders) by at most 6.5 percent. Because the population on that territory had increased by about 10 percent, average incomes must have declined.
We go beyond Gregory by filling in all the years of this turbulent period. Our estimates are independent of his, being based on production rather than expenditure. We go beyond others by applying the framework of the UN System of National Accounts.Footnote 3 In this framework, GDP is supposed to cover the production of goods and services for final demand. Previous estimates of national income and surveys of aggregate trends over our period (other than Gregory's) have generally counted only material production and transport, to the neglect of services.Footnote 4 This is bad for measurement over the long run, because it would drop much economic growth of Europe and North America out of the picture.Footnote 5 But it can be equally harmful in the short run, for example in the case of a war boom, when the role of military services increases abruptly.
GREGORY'S POPULATION AND NATIONAL INCOME: RUSSIA AND USSR, 1913 AND 1928

Sources:
Russia and Soviet Union, best estimate: Gregory, Russian National Income, p. 113. Soviet Union, upper limit: Gregory, “National Income,” p. 337. As may be judged from Table 2, the 1913 population figure of 171 million is that for the empire within 1913 borders, including Poland but not Finland.
Robert Higgs has argued that defense should be omitted from wartime GDP, not because defense is a service, but because defense is not a final service. It is an intermediate use of resources, he suggests, or a cost of maintaining society.Footnote 6 In this view, only civilian goods and services contribute to social welfare. On a consumer welfare standard, a war boom is not a real boom, just a time when everyone has to run faster to stand still—if they are lucky.
This argument has some merit. We do not fully adopt it for two reasons. First, as Abram Bergson argued, GDP as conventionally measured does at least represent an observation of society's productive possibilities, or the potential to deliver social welfare under alternative conditions—for example, the absence of war.Footnote 7 Second, there is virtue in conforming to a measure of national income that is internationally recognized and comparable with measures of other periods and other countries. For these reasons, we follow convention to produce orthodox measures of national income. At the same time, we will offer parallel measures that make explicit some of the consumption and welfare implications of warfare.
TERRITORY AND POPULATION
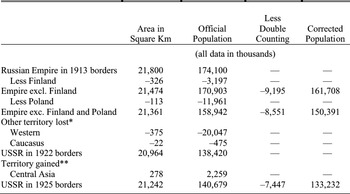
In 1917 the Russian Empire disintegrated. The Soviet Union was formed in 1922 from the empire's rubble, without Finland, Estonia, Latvia, Lithuania, Poland, and parts of the Ukraine and Belorussia. The Central Asian territories of Khiva and Bukhara were formally incorporated in 1925.Footnote 8Table 2 lists the effects of these changes on the territory and population of the Russian Empire and the Soviet Union. The net effect on territory was small; the land surface under Moscow's dominion in the 1920s was still 97 percent of that under St. Petersburg in 1913. In contrast, the effect on population was dramatic because the areas lost were densely settled: by 1922 one-fifth of the official residents of the empire of 1913 had escaped from Moscow's control.
The profusion of border changes raises the question of what national entity and associated territory we should take for our 1913 baseline. We can start with the Russian Empire, excluding Poland and Finland. We can follow what happened on this territory through 1917, but no further. Hence we prefer to take the territory of the Soviet state within the frontiers of 1925 to 1939 (“interwar borders”) as our main benchmark. What happened on this territory can be tracked back to 1913, by deducting the western regions from the empire.
As shown in Table 2, the population of the Russian empire (excluding Poland and Finland) in 1913 was officially some 159 million; based on the same official figures, the number of people living on the territory of the future Soviet state in the same year, was 138 million. These figures require correction. The only census of the imperial population was held in 1897. Over the years that followed, in the rural localities of European Russia, the authorities correctly registered births and deaths but failed to count the out-migration of peasants to cities or to Siberia. At the same time, these newcomers were counted at their new places of residence. As a result, they appeared twice in the demographic statistics. This double counting continued for two decades; thus official figures increasingly overstate the real population in each successive year. Working forward from the 1897 census on the basis of births, deaths, and net migration in each year, Roza Sifman proposed to subtract 5.38 percent from the 1914 population, and we follow her lead.Footnote 9
FROM RUSSIA TO THE USSR: TERRITORIES AND POPULATIONS OF JANUARY 1, 1913

Notes:
* West: The provinces of Bessarabia, Vilno, Vitebsk (33 percent), Volyn (50 percent), Grodno, Kovno, Kurliand, Lifliand, Minsk (33 percent), Podolsk, Pskov (10 percent), Kholm, Estliand, and insigificant parts of Arkhangel and Petrograd. Caucasus: the provinces of Kars, Batumi (50 percent), and insignificant parts of Erivan.
** Central Asia: Khiva and Bukhara.
Sources:
Area: Figures in square versts given by Anfimov and Korelin, Rossiia, pp. 11–15, converted at 1.0668 km per verst. Population: as Appendix Tables A7 and A8.
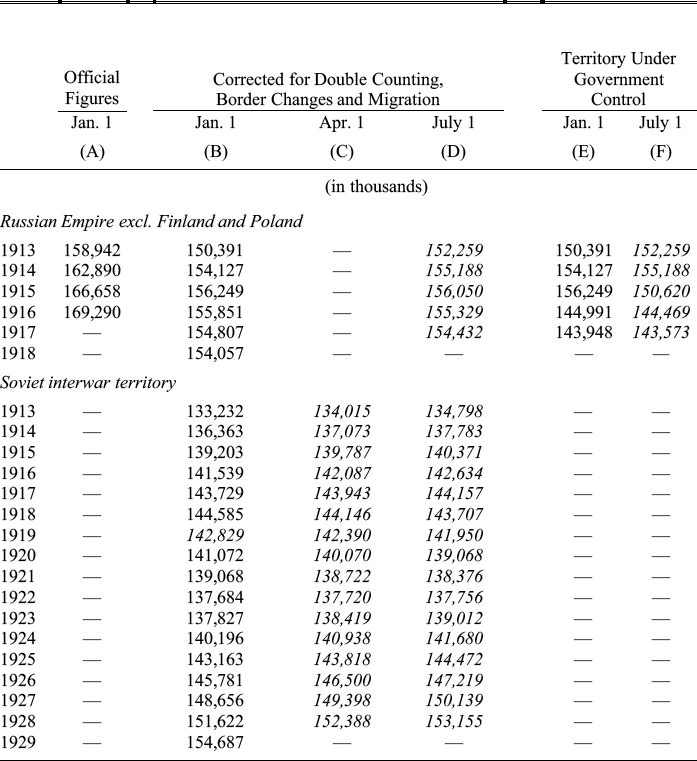
Table 2 shows the corrected population of the Russian Empire at the beginning of 1913 (excluding Poland and Finland) as 150 million. Correspondingly, about 133 million people lived on the future Soviet territory in the same year. By 1928 the Soviet population had grown to 152 million—a relatively safe figure, based on the first Soviet census of 1926. Between 1913 and 1926 three demographic catastrophes overlapped: the Great War, the Civil War, and a postwar famine. Apportioning deaths among them is a hazardous and unfinished business.Footnote 10 We divide the period into 1913 to 1918 and 1920 to 1928. In the first period, we start from a corrected 1914 population figure. For 1913 and 1915 to 1918 we apply annual birth and death rates together with estimates of war losses and net migration, forced and voluntary, from various sources. From the first USSR population census (1926) back to the closing stage of the Civil War (1920), we rely on a widely accepted reconstruction carried out at the end of the Soviet era. That leaves 1919, for which we average 1918 and 1920.
Table 3 presents the results of our reconstruction. Series for Soviet interwar territory and the Russian Empire both show an increase in the population during the first years of the Great War. After 1915 trends diverge. On the empire territory, population then fell continuously until the data come to an end. The main factors were a jump in mortality and a smaller drop in fertility. On Soviet territory, in contrast, the population continued to grow until 1918. Indeed, the interior regions of the empire that would later form the Soviet Union received waves of refugees from the war-torn and soon-to-be-independent western territories. Until 1917 the influx onto Soviet territory more than offset the indigenous population's decline. From the start of the Civil War, however, the Soviet population fell for several years because of high death rates associated with combat, infectious diseases, and famine. At the same time, the earlier inward migration was partly reversed as some wartime refugees left Soviet territory and returned home, and some indigenous inhabitants emigrated. Only after 1923 did population growth resume at the rate of 2.5 million per year on average.
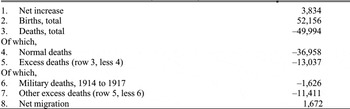
Over the turbulent decade from the first day of 1914 to the last of 1923, the population on Soviet territory grew by a small amount. We account for the components of this increase in Table 4.Footnote 11 The most vivid number in this table is the 13 million “excess” deaths attributed to civil and military conflict. Excess deaths are not the exact number that were killed or died prematurely as a direct result of the Great War and Civil War, for this number is not knowable. Rather, it is the least number that must have been killed or died prematurely because of warfare, given the peacetime probability that some would have died anyway. Our figure falls midway between the 12 million proposed in 1948 by A. Ia. Boiarskii and the 13.8 million found more recently by Sergei Maksudov.Footnote 12
Notably, only one in eight of these premature deaths took place on the battlefields of the Great War. The rest arose from famine, disease, and military actions of the Civil War period. Despite excess mortality on this terrifying scale, the total population increased. The main factor was high fertility, but the collapse of the empire also contributed in the form of net immigration.
POPULATION OF RUSSIA AND THE USSR, 1913 TO 1929
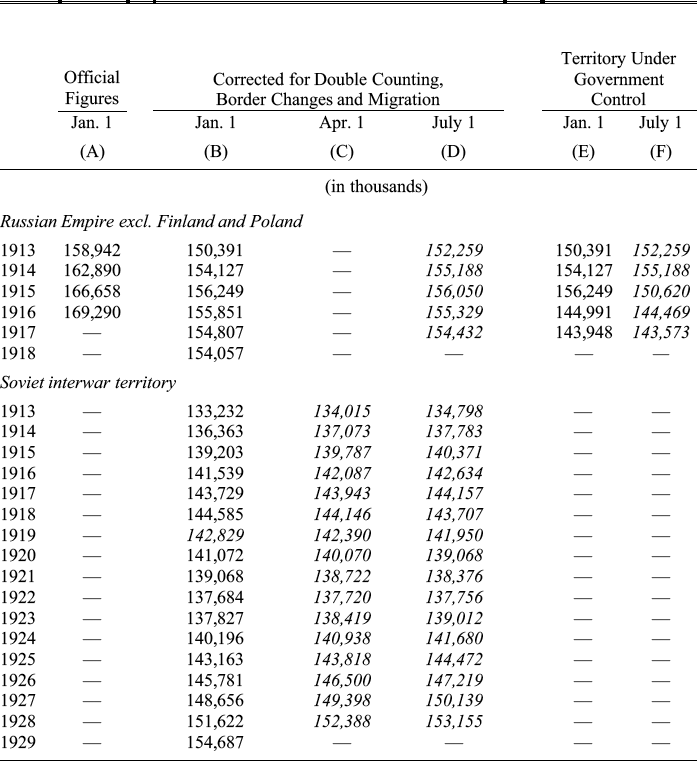
Note:
In this and following tables, numbers that are interpolated or extrapolated are shown in italics.
Sources: A and B: Figures for 1913 to 1918, official and after adjustment, are from Appendix Tables A7, column H, and A8, columns H and K. Figures for 1920 to 1928 are from Andreev, Darskii, and Khar'kova, Naseleniia, p. 119, using their high-mortality series for 1920 through 1922. For discussion and our own corrections, see the Appendix. C and D: The July 1 figure, which we use for the calendar year average, is found as the average of the January 1 figures for the current and following years. The April 1 figure, used for the economic year (October to September) average, is the average of the January and July figures for the current year. E and F: Figures are adjusted for territory held by the imperial government.
POPULATION CHANGES: SOVIET INTERWAR TERRITORY, JAN. 1, 1914 TO DEC. 31, 1923 (in thousands)

Source:
Appendix Table A9. For discussion of our estimation procedure, see the Appendix. Net migration is calculated as the residual.
REAL NATIONAL INCOME
Scholars have had to take care with volume indices since Alexander Gerschenkron identified the gap that arises between alternative measures when price and quantity changes are negatively correlated.Footnote 13 We calculate the real national income of Russia and the Soviet Union in 1913 rubles. In 1913 Russia had a relatively free and open market economy; it participated extensively in world trade, with market prices responding to supply and demand. Thus, valuing 1928 national income at 1913 prices is meaningful. By contrast, 1913 national income valued at the prices of 1928 is not. By 1928 the Soviet economy had been cut off from the world by a state monopoly of foreign trade. Domestic prices were intentionally distorted by controls and subsidies.Footnote 14 This is why we do not revalue national income in the prices of 1928.
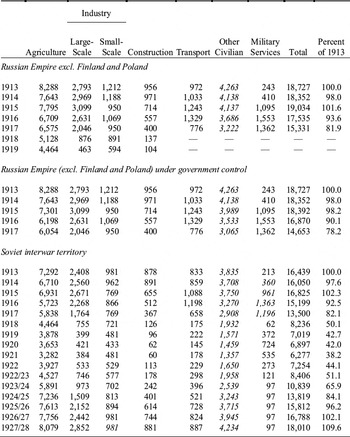
In Table 5, we estimate the real national income of the Russian Empire and the Soviet Union by sector of origin. We start from net value added in 1913 by branch on the territories of the Russian Empire (excluding Finland) and the USSR within interwar borders.Footnote 15 We use these to weight annual series of production by branch, rolling national income of the two territories forward in parallel, year on year to 1917.Footnote 16 In each year of the overlap, the transition from Russian to Soviet territory is found by subtracting activity on the lost territories (agriculture and transport); or by interpolating the trend in one territory on the trend in the other (industry, construction, and other civilian sectors); or by assuming a common trend and scaling from one territory to the other on the basis of relative populations (military services).
NET NATIONAL INCOME OF RUSSIA AND USSR: MILLION RUBLES AT 1913 MARKET PRICES AND PERCENT

Sources:
For 1913 the starting point for national income and value added by sector of origin on both Russian and Soviet territory is Appendix Table A10, but the empire territory here includes Poland, which we deduct from national income as a whole in proportion to its population (Table 2) multiplied by the relative income coefficient of 1.0852. We assume that Poland was at least as wealthy, relative to the rest of the empire, as all western provinces were, relative to the provinces at formed the Soviet Union. Comparing the two territories shown in Table A10, it is easily found that, in the western provinces of the empire in 1913, average incomes were 132.3 rubles, compared with 122.0 rubles on Soviet territory. Thus, average incomes of the western provinces exceeded those on Soviet territory by a factor of 1.0852. Value added by other civilian sectors (forestry, fishing and hunting, communications, trade, and other civilian services) in 1913 is found as the residual after value added by agriculture, large and small industry, construction, transport, and military services is deducted from national income. Figures for subsequent years are then interpolated on aggregate index numbers or other series tabulated in the Appendix as follows: agriculture, Table A11 (total); large-scale industry, Table A13 (total); small-scale industry, Table A14 (column D); construction, Table A16 (total); transport, Table A17 (rail and waterways, total); and military services, Table A20 (column D). An exception is the 1927/28 figure for small industry, missing from the source; we assume that, in the deteriorating conditions of the late 1920s, small industry ceased to grow. For years after 1913, other civilian sectors are interpolated on the sum of agriculture, large and small industry, construction, and transport.
Underlying these calculations is a large body of production data that were collected contemporaneously and published then or soon after, including nine agricultural products, sixty industrial products, and a variety of measures of activity in other sectors.Footnote 17 The quality of the data is U-shaped over time; all years of the Civil War are poorly documented, but 1918 (the first year of the new order) is the worst. Large-scale industry and rail and river transport were observed more fully than agriculture and small industry; we have no usable data on civilian services and road transport. Data on agriculture and small industry suffer from a range of known biases and omissions. Livestock and field crops are known to have been undercounted under the old regime by varying amounts. In the 1920s the downward bias in crop measurement became a political issue; scholars and specialists risked their liberties and lives when they took the wrong side.Footnote 18 In our Appendix, we give further detail and explain the corrections that we apply.
RUSSIAN AND SOVIET REAL NATIONAL INCOME, 1913 TO 1928: NEW AND OLD ESTIMATES, PERCENT OF 1913

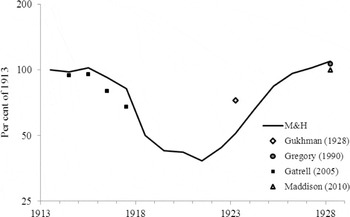
Table 5 shows that, within given borders, Russia's national income fell below 1913 by nearly one-fifth in 1917, and more than three-fifths by 1921. Based on Table 5, Figure 1 compares our aggregate figures for national income with previous estimates for comparable years, setting both Russia and USSR to 100 percent in the base year (1913 or thereabouts). Compared with Peter Gatrell's, our view of the Great War is more positive; the main reason for this is that our national income includes the contribution of military services. Our view of 1923 falls far below B. A. Gukhman's, based on his attempt to deflate nominal output to constant prices at a time of hyperinflation. Most notably, our observation of 1928, with national income above 1913 by just under 10 percent, closely matches that of Gregory. Our national income concept is the same, while our sources and methods are entirely independent. Thus, our study and Gregory's cross-validate each other.
REAL NATIONAL INCOME PRODUCED IN INDUSTRY AND AGRICULTURE ON SOVIET INTERWAR TERRITORY, 1913 TO 1928: NEW AND OLD ESTIMATES, PERCENT OF 1913

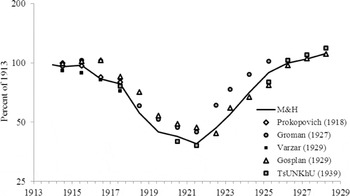
Some previous estimates have provided relatively complete series for industry and agriculture combined, and Figure 2 compares these with our estimates for industry and agriculture alone. From 1916 onwards our series track the lower edge of the envelope; this shows that we are relatively pessimistic about the main production sectors in the Civil War. The reason is to be found not in different original sources, but in the correction factors that we apply to the low-quality wartime data—particularly to grains.
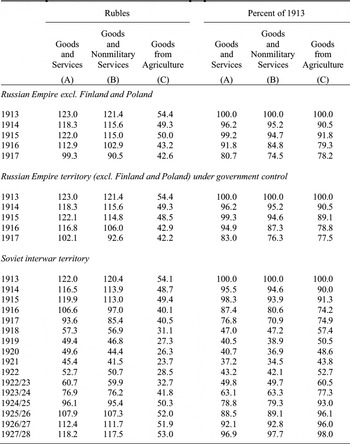
Table 6 compares output with population to find income per capita. While aggregate real output was almost 10 percent greater in 1928 than in 1913, average incomes did not fully recover. The reason is that the population increased by about 14 percent within the same boundaries. As a result, Soviet national income per head in 1928 fell short of the prewar benchmark by around 3 percent.
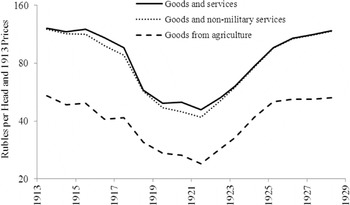
Figure 3 contrasts the trend of national income (“goods and services”) per head with two other measures of the average level of existence of Russian and Soviet citizens. “Goods and nonmilitary services” aims to capture the availability of resources for civilian use. In the spirit of Robert Higgs, it should exclude defense from national income as an intermediate rather than final use of resources. We can subtract the labor services provided to defense; ideally, we would also take away the value of capital services and material consumption in the defense budget, but there are no measures on which we could base such a series. So the data we have give only an upper bound on the desired measure of civilian welfare. As the figure makes clear, resources for civilian use fell more rapidly than total output during the Great War, and again during the Civil War. The real burden of the Imperial Army reached around 9 percent of national income at its peak in 1916 and 1917. Although the Red Army never achieved the absolute numbers of the Imperial Army, overall resources were so shrunken that the proportional burden it represented rose to more than 10 percent in 1920.

REAL NATIONAL INCOME AND CONSUMPTION PER HEAD, 1913 TO 1927/28: SOVIET TERRITORY AND VARIOUS MEASURES IN RUBLES AND 1913 PRICES

Finally, “Goods from agriculture” aims to capture the trend in food availability per head. Throughout the period, there was less real volatility in agriculture than other sectors. The figure shows that agriculture did not benefit from early mobilization for the Great War, and subsequently did not collapse to the extent of industry and transport. The figure does not reflect the elimination of the prewar export of grains (about one-tenth of the 1913 harvest), which then became available for home consumption. Despite these considerations, a 50-percent-plus reduction in food availability per head had disastrous consequences. The decline in availability was highly uneven. There was urban, then regional famine. The February 1917 Revolution, which ended the monarchy, was sparked by urban food shortages. In October 1917 the Bolsheviks inherited a public and private distribution system in collapse.Footnote 19 Despite falling harvests, procurement brigades stripped the grain producing regions of food.Footnote 20 Those who stayed in the towns were forced into a “crisis mode of consumption.”Footnote 21 In Petrograd in the spring of 1919, an average worker's daily calorie intake was below 1,600, less than half the level of four years later.Footnote 22 By the end of the war, money wages were apparently 4 percent of their prewar level in real terms, with workers surviving on public and private inventories and barter.Footnote 23
Although average incomes were not fully restored in 1927/28, the composition of national income by sector of origin was almost the same as it had been 1913. This is found by comparing the first and last rows of Table 5. One small but significant difference was the halved share of military activities. This peace dividend for the civilian economy and consumption caused military and political leaders intense anxiety given Soviet Russia's state of military encirclement, real and imagined, in the late 1920s.Footnote 24 This concern became an important stimulus to Stalin's Great Leap Forward.
The year-on-year pattern of change in real national income per head is revealing in various ways. As Figure 1 suggests, our results give Russia fuller credit for the military mobilization of 1914 through 1916 than previous estimates, and revise the pessimistic view of Russia's Great War that is well established in the literature.Footnote 25 The economy held up through 1915, which was blessed by a good grain harvest. By 1916 it was in decline, but was still less than 10 percent below the peacetime benchmark of 1913. We will show that this was not out of line with the wartime performance of much richer European economies.
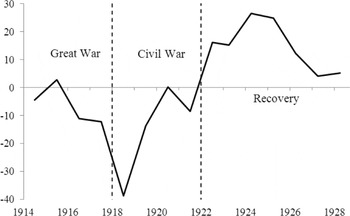
By the same token, the economic decline through the Revolution and Civil War appears sharper than in previous accounts. Comparing 1917 with 1913, output per head fell by one-fifth in four years. Over the two years that followed, from 1917 to 1919, output per head halved. Figure 4 charts the year-on-year decline on Soviet territory. Notably, output fell most precipitously before 1919, when the Red and White armies clashed most fiercely. The decline was concentrated in the sectors subject to nationalization; half of the decline in large-scale industry over the entire period took place in 1918 alone. This suggests strongly that the confrontational policies of “war communism,” with widespread state confiscation of property and rule by decree, caused greater disruption than the fighting. Moreover, as the fighting died away, the economy stabilized at around 40 percent of prewar output but did not at first recover. By 1920 with a command economy in place, the Bolsheviks were able to return large-scale state industry to a path of modest growth. But agriculture continued to struggle, because the policy of surplus confiscation under war communism gave peasants no reason to produce food above subsistence.Footnote 26 A deadly game ensued between the farmers and the authorities over the true level of food reserves in the countryside. This game ended in the catastrophic famine of 1921.
REAL NATIONAL INCOME PER HEAD, 1913 TO 1927/28: YEAR-ON-YEAR PERCENT CHANGE ON SOVIET TERRITORY AND AT 1913 PRICES

A notable feature of our results is that the famine of 1921 did not come out of the blue; it followed a run of disastrous harvests. Cormac Ó Gráda has shown that famine is much more likely after two consecutive harvest failures, when the countryside has exhausted its reserves.Footnote 27 As Table 5 and Figure 3 reveal, 1921 was the third and worst year in a series of catastrophic grain harvests. The factors underlying poor harvests have not been disentangled, but combined wartime disruptions with confiscatory disincentives to plant and adverse weather conditions that lowered yields.Footnote 28 Consistently with this, new research on the famine suggests that it actually began in the summer of 1920, and in some regions as early as 1919.Footnote 29
Postwar recovery began only in 1922, following the revolutionary government's decision to restore market relations and the private sector in small industry and urban-rural trade. The “New Economic Policy” (NEP) was announced in March 1921 under crisis conditions of accelerating hyperinflation and famine; recovery was marked only in the following year. The main mechanism of recovery was the exploitation of spare capacity, which continued until 1929/30.Footnote 30Figure 4 charts the year-on-year growth of Soviet GDP per head up to 1927/28. Strong at first, the recovery soon slowed to a single-digit pace. In April 1929, when the Bolsheviks officially endorsed the “optimal” variant of the first Five-Year Plan, average incomes were still below the prewar level. In fact, Soviet GDP per head did not significantly exceed this benchmark until 1934.
The prewar benchmark is an intuitive focal point for comparison, but is it the right one? Inspired by Ferenc Jánossy, the comparative literature on trend growth, war, and postwar catch-up suggests that productive potential does not stand still when war breaks out.Footnote 31 From this point of view, the prewar benchmark is an excessively low bar. By 1928 fifteen years had passed since the outbreak of the Great War. If in the intervening period Russia's potential GDP per head had risen along its modest pre-1913 log-linear trend of 1.74 percent per year, then at the end of the 1920s the actual still fell short of the potential by about one- quarter.
While the period under scrutiny is short, our figures do not support the view that NEP provided effective institutions and policies for long- term Soviet economic development. Once widely held, this view has been updated recently. Specifically, Robert C. Allen has argued that the best development strategy for the Soviet economy in the 1930s would have been industrialization with a soft budget constraint on industrial producers and without collectivizing agriculture, in other words, under the New Economic Policy as it was implemented in the mid-1920s.Footnote 32 This assessment is hard for us to swallow. The evidence is in our figures: from 1925 onwards, while the investment mobilization intensified, agriculture and small industry stagnated. This is the main factor that stalled the recovery, with average incomes still short of the prewar level.
Specifically, a soft budget constraint lets managers override profit-maximizing limits on output. Using a simulation model, Allen finds that softening the budget constraint on Soviet large-scale industry led to a static output gain. But higher static output was not the only consequence of the soft budget constraint. Another was the spreading shortages in the urban-rural market. Allen accepts that these deterred the peasant farmers from participation in the urban-rural market and contributed to the demise of NEP.Footnote 33 In fact, the soft budget constraint in industry and the market relationship with the peasantry were compatible only for a brief period. As shortages became widespread, the Bolsheviks faced a choice: use the price mechanism to resolve them, or use force.Footnote 34 The NEP came to an end when Stalin tipped the balance in favor of a violent outcome.
RUSSIA IN COMPARISON
In this section, we compare Russia's economic experience of world war, civil war, and recovery with that of other countries. Previous research has suggested that national success in wartime mobilization varied inversely with the prewar level of economic development, controlling for contingent factors such as distance from the war and the time to mobilize.Footnote 35 But this relationship is found on the basis of a limited sample, largely by contrasting the richer maritime powers with poorer continental economies. It is also sensitive to the revision of individual data points such as Russia's. According to previous estimates, Russia's economic performance in the Great War up to 1917 was far below that of most other continental countries that entered the war. On our figures, Russia's shortfall disappears.
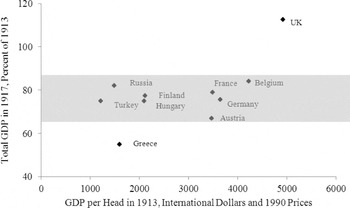
WARTIME MOBILIZATION: THE GDPS OF SELECTED EURASIAN COUNTRIES IN 1917, PERCENT OF 1913

Figure 5 plots changes in real GDP of ten Eurasian countries from 1913 to 1917 against their prewar level of economic development, represented by GDP per head in 1913, and incorporating revised data for Russia. In addition to Russia itself, we observe eight other continental powers (Belgium, Germany, France, Austria, Finland, Hungary, Greece, and Turkey), and one offshore power (the United Kingdom). There is a positive slope to the relationship, but this slope relies on two observations, the richest country (the United Kingdom, the only offshore power) and the third poorest (Greece). If we exclude these two, the relationship is flat. The average GDP decline for the continental powers was 23 percent, while Russia's GDP was distinctly above the average, falling by only 18 percent.Footnote 36
Underlying this was a continental Eurasian pattern of wartime economic decline. The pattern reflected a common story, based on the burden of subsistence agriculture.Footnote 37 Across the continent from Russia through Germany, Austria, Hungary, and the Balkans to the Ottoman Empire, military mobilization deprived peasant farmers of men and horses, which initiated a production decline. But the supply effect was secondary compared with the market disruption caused by the mobilization of domestic industry; this squeezed the availability of all those things for which peasants were willing to trade their food surpluses. Peasants withdrew from the market, cutting flows of food from country to town to a trickle. Interventions to ration food at low prices to urban consumers generally increased the market disequilibrium that already existed.
In 1917 Russia descended into revolution, then civil war. This vastly magnified the economic disintegration. In principle the causes and consequences of civil war in Russia may be compared with those elsewhere. Quantitative studies using cross-country data have been limited to the period after 1945. They seem intrinsically unlikely to throw much light on the causes of civil war in Russia in 1917. Russia shows three markers that have had predictive value for the onset of civil war: a scattered population, a weakened central government, and several years of declining output.Footnote 38 But these do not seem to be sufficient causes; as Alec Nove remarked, “Other powers too suffered from defeats and from food shortages.”Footnote 39 We have seen that the economic decline up to 1917 was not more severe in Russia than elsewhere. In short, we will probably not be able to explain why Russia was the first to descend into revolution and civil war without reference to historical factors that were unique to that country and period.
The consequences of Russia's civil war were very severe in international comparison. In Russia, output fell by more than one-half; this is much more than the average effects found for civil wars since 1945.Footnote 40 We look to earlier periods to find devastation on a similar scale. On the losing Confederate side of the American Civil War of 1861 to 1865, production fell by half and real wages collapsed to 11 percent of their prewar level.Footnote 41 What happened in the Russian Civil War was similar or worse. A clear difference is that it happened to the winners, not the losers.
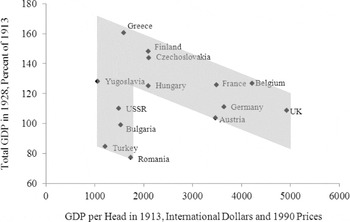
POSTWAR RECOVERY: THE GDPS OF SELECTED EURASIAN COUNTRIES IN 1928, PERCENT OF 1913

The economic outcomes of the Russian Civil War also appear to have been more severe than those of civil war in Spain from 1936 to 1939. There, GDP fell by more than one-quarter and consumption by more than one-third between 1935 and 1938.Footnote 42 In addition, there was excess mortality of more than half a million up to 1942, or around 2 percent of Spain's prewar population.Footnote 43
No production figures are available for China during its Civil War, fought intermittently from 1927 to 1949. As in the Russian case, it is impossible to disentangle the premature deaths in the Civil War from those of the World War, but the total up to 1945 exceeded 35 million.Footnote 44 In proportion to China's prewar population, around 500 million in the early 1930s, Russia's losses were similar or worse.
Finally, we turn to recovery. Russia's recovery from its Great War and Civil War is placed in Eurasian context in Figure 6. This figure shows two principal moments in the pattern of postwar performance. One group of countries is ranged along a downward sloping convergence frontier from Greece on the left to the United Kingdom on the right. To the left, a second group of countries from Yugoslavia to Romania, all relatively poor at the outset, and more or less badly performing over the period, falls below the frontier.Footnote 45 The Soviet economy is found in the midst of the second group. This confirms our pessimistic evaluation of Soviet economic performance under NEP.
RUSSIA AND THE SOVIET UNION: REAL NATIONAL INCOME PER HEAD, PERCENT OF 1913

THE LONG RUN
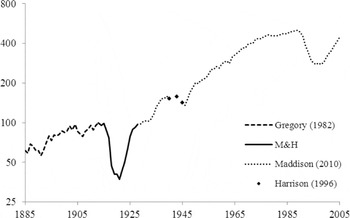
Figure 7 sets our new estimates in the context of established long-run real growth series for Russia and the Soviet Union from 1885 to 2006. It turns out that the Great War and Civil War induced the deepest crisis that Russia experienced in more than a century of modern economic growth.
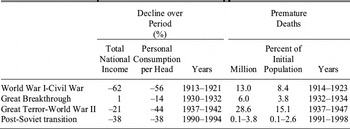
Table 7 provides a more detailed comparison with other major shocks to Russia in its troubled twentieth century. Taken together, these comprise just about every disaster that can befall modern societies, including foreign wars, internal wars, famines, and state collapses. In the table, we combine income and consumption measures with estimates of the accompanying demographic losses. Few of the figures in the table will ever command a scholarly consensus in precise terms, but they are broadly instructive. We briefly narrate the stories behind them.
Stalin's Great Breakthrough refers to the events following the adoption of the first Five-Year Plan in April 1929. Consumption was repressed; capital was created in industry and labor and food were moved out of agriculture. Since productivity in both sectors declined, there was at first no gain in total output. The average figure for the consumption decline hides wide variation between regions and especially within the countryside. The struggle to control food distribution stripped the countryside of grains and spread famine through the Ukraine, the Volga region, the North Caucasus, and Kazakhstan. Famine in the early 1930s contributed 5.5 to 6.5 million premature deaths.
Only in the mid-1930s did living standards begin to recover, peaking in 1937. Allen has argued with some justice that traditional index number concepts employed, for example, by Bergson, somewhat understated the underlying welfare gain of up to 30 percent by 1937, compared with 1928 to 1937.Footnote 46 However, Allen's own estimates for farm income in 1937 are probably too high; they rely too heavily on inferences from production statistics, and make no allowance for market disequilibrium.Footnote 47 And it should not be forgotten that millions of citizens who ought to have been alive to enjoy the unexpectedly good harvest of 1937 had starved to death in the interim. Presumably, their absence helped to lift the average consumption of the survivors.
It is notable from Figure 7 that Soviet average real incomes reached an interwar peak around 1939. Let us compare this peak with an earlier one, not 1913 but 1904, the eve of the 1905 Revolution, when incomes were already almost at the level of 1913. Over the 35 years from 1904 to 1939, incomes rose by about 75 percent. But in most intervening years, there was no net growth at all. In fact, three-quarters of the net growth that took place from peak to peak was achieved in just five years, from 1933 to 1937. By that year, the Soviet economy had just about struggled back to the pre-1913 trend.Footnote 48 This suggests that all Stalin had brought about by World War II was recovery from the 1905 Revolution, World War I, the Bolshevik Revolution, the Civil War, and his own policy of collectivization.
RUSSIAN AND SOVIET ECONOMIC AND DEMOGRAPHIC LOSSES IN FOUR CRISES

Sources:
Economic losses
1913–1921: Table 6 national income per head at 1913 prices and, for the change in consumption, national income per head from agriculture.
1930–1932: National income per head at 1990 “international” dollars is by Angus Maddison at http://www.ggdc.net/maddison. Consumption per head is from Allen, Farm to Factory, p. 147.
1937–1943: Total real GDP, percent of 1937, is given by Harrison, Accounting, p. 93, for government-controlled territory only, which was enlarged by annexations in 1939/40 and then reduced (by much more) by invasion and occupation in 1941 and 1942. Household consumption combines the decline estimated for 1937 to 1940 by Bergson, Real National Income, p. 252, with that estimated for 1940 to 1943 by Harrison, Accounting, p. 104, both at 1937 prices. The wartime low point for household consumption was most likely 1942, but we have no population figure for that year, so we use 1943 instead.
1990–1994: National income per head at 1990 “international” dollars is by Maddison at http://www.ggdc.net/maddison/. Consumption change is for “average money incomes” deflated by consumer prices in Russian Federation, Rossiiskii statisticheskii ezhegodnik (1995), p. 77. Demographic losses
1914–1923: For sources and methods, see the Appendix and Table A9.
1932–1934: The mid-point of the 5.5 to 6.5 million range given by Davies and Wheatcroft, Years of Hunger, p. 401.
1937–1947: The official figure for excess war deaths in 1941 to 1945 is now 26.6 million (Andreev, Darskii, and Khar'kova, “Otsenka”). Ellman and Maksudov, “Soviet Deaths,” have pointed out that this may (or more likely may not) include roughly 2.7 million wartime emigrants. To the 26.6 million, we add 950,000 as a lower limit on deaths in the Great Terror of 1937/38 (Ellman, “Soviet Repression Statistics,” p. 1154), plus one million for the lower limit on deaths from famine in 1946/47 (Ellman, “1947 Soviet Famine,” p. 616).
1990–1998: Our lower limit is the 100,000 violent deaths in regional wars and ethnic conflicts, cited by Ellman, “Social Costs.” The upper limit is found by adding 3.7 million excess deaths attributed to transitional reforms by UNICEF, Desiat' let, p. 51. We motivate the upper and lower limits further as follows. As is well known, the Russian transition was associated with a significant spike in male mortality. In a pessimistic overview, Ellman, “Social Costs,” associates the excess mortality and morbidity with transition policies. Stuckler, King, and McKee, “Mass Privatization,” specifically attribute the increase in male mortality to mass privatization and the associated actual or expected unemployment. A potentially confounding factor is that male life expectancy in the Soviet Union was on a steadily downward trend from the 1960s, but this trend was temporarily reversed in the mid-1980s by higher alcohol prices and supply restrictions. On this basis, male mortality on the eve of transition was abnormally low and could have been expected to rebound (Demoscope, “Smertnost’”). Brainerd and Cutler, “Autopsy,” find that the relative cheapening of alcohol under transition explains up to a quarter of the increased mortality of the period. Earle, “Mass Privatisation,” Earle and Gehlbach, “Did Mass Privatisation?” Gerry, Mickiewicz, and Nikoloski, “Did Mass Privatisation?” and Brown, Earle, and Telegdy, “Employment,” have challenged the link from transition to mortality in other ways, including the specific channel from privatization to mortality via unemployment. For their reply, see Stuckler, King, and McKee, “Did Mass Privatisation?” In this crisis, unlike others, Russia received substantial net immigration of more than 13 million by the year 2000, including many from the “near abroad” (UN, International Migration Report, p. 3).
The central event of the decade from 1937 to 1947 was World War II. Linked to it are preparations for war in the preceding years and a food crisis that followed the end of the war. Under war preparations, we include both large-scale rearmament against the foreign enemy and the Great Terror of 1937/38, in which Stalin waged preemptive war against his “potential enemies” at home.Footnote 49 The world war itself added more than 26 million excess deaths in combat, and from disease, famine, and repression on both sides of the front line. With the German invasion, Soviet-controlled territory shrank, but Stalin's policies successfully managed the war economy. The loss of agricultural land and the intense mobilization of resources into defense put living standards into a deadly squeeze, however. Coming on top of a prewar decline induced by rearmament pressures, consumption per head fell by up to one-half. At the end of the war, a regional food crisis struck the Ukraine, southwestern Russia, and Soviet Moldavia and carried off more lives.
Finally, the collapse of the Soviet Union led to economic and demographic upheaval for post-Soviet Russia. The transition from socialism is the only crisis in which mass violence did not take the lead. In fact, it was associated with economic losses on the scale of a major war, but with only minor wars taking place. Official figures suggest that up to 1998 average incomes and consumption fell by around two fifths. Such figures overstate the decline in welfare, however, because they neglect the contemporaneous gain to consumers as the retail market evolved from severe shortage to equilibrium; this gain may have been substantial.Footnote 50
While economic aspects are debated, assessments of the demographic costs of transition are extremely polarized. In Table 7, we give upper and lower limits. Our lower limit is set by the 100,000 deaths arising from small-scale ethnic clashes and regional conflicts. Our upper limit includes the mortality spike of the early 1990s, largely consisting of deaths among men of working age across Russia from alcoholic-related causes including violence and diseases. The causes of this increased mortality are bitterly disputed, as discussed in a note to the table. Some attribute the additional deaths to transition processes and policies. Others see the mortality bulge as unrelated to transition; it had been stored up by pre-transition trends and policies and would have happened anyway. These views of transitional mortality are uncompromisingly opposed to each other, and cannot be averaged.
Table 7 confirms that the Great War and Civil War rank first among Russia's economic disasters of the last century. National income per head fell by more than three-fifths from 1913 to 1921. We approximate the consumption loss from agricultural production per head, which fell by more than one-half. The overall burden of excess deaths was around 9 percent of the prewar population. Normalized by the prewar population, the demographic burden fell not far short of that of World War II. Hunger-related causes were the most important factor in excess mortality, followed by fighting and terror in the Civil War.
A wider lesson from Table 7 may be the importance of the state in the history of modern Russia. In the Great Breakthrough and World War II, the state remained intact. Production was maintained in the midst of disasters that killed millions of people. In particular, the state retained its ability to transfer food from people of secondary status such as peasants and forced laborers, who then died, to soldiers and industrial workers, who then lived. In contrast, the state failures of 1917 and 1991 were associated with huge losses of output as well as of consumption and lives. In each case, the scale of deaths depended heavily on the presence of open violence; this is exemplified by the comparison of two transitions.
Russia's political establishment believes that today's answer for Russia is to shore up the “power vertical” of the state at all costs.Footnote 51 In this view, no outcome is worse than a failed state. Russia's twentieth century shows that a failed state could be associated with terrible misery, but it also associates grim suffering with a state powerful enough to starve and kill without restraint. Whether the answer for Russia is confined to state consolidation, or includes building an economy that is more deeply rooted in civil society and private enterprise and more resilient in the face of political action, is another story.
CONCLUSIONS
Our work fills the last remaining gap in the record of Russian and Soviet national income in the twentieth century. This gap, starting in 1914 and finishing in 1928, is full of historic and traumatic events: Russia's Great War, the Bolshevik Revolution and Civil War, and postwar reconstruction under the New Economic Policy, which set the stage for Stalin's Great Breakthrough to forced industrialization.
In comparison with previous interpretations, our findings give a more favorable picture of Russia's economic mobilization for the Great War. Correspondingly, we show the economic catastrophe of the Civil War in a harsher light. Our results confirm that by 1928 economic recovery, measured by national income per head, was most likely still incomplete. We draw negative inferences concerning both the quality of Soviet economic institutions and policies in the 1920s and the economic achievements of the 1930s.
Wars and revolutions have the capacity to wreak havoc on modern societies. Nesting one inside the other, Russia's Great War and Civil War led to economic disaster and demographic tragedy. The scale of losses can be measured against both Russian and global standards. In Russian terms, it was the worst economic disaster of the twentieth century. Only World War II resulted in a greater loss of Russian lives. International comparisons also rank the Russian experience of warfare between 1914 and 1921 highly in the damage done to life and living standards.