





Introduction
Glacier sliding plays a prominent role in the sculpting of landscapes and the mass loss that is contributing to diminished freshwater resources and rising sea levels. Appreciable sliding takes place only where basal ice is separated from bed materials (i.e. bedrock, till) by liquid water (e.g. Cuffey and Paterson, Reference Cuffey and Paterson2010). Recognition that water pressures strongly influence sliding mechanics (e.g. Kamb and others, Reference Kamb1985; Iken and Bindschadler, Reference Iken and Bindschadler1986; Iverson, Reference Iverson2010) has helped motivate research into the controls on a variety of macroscopic subglacial conduits (hereafter referred to collectively as conduits), which include R-channels (Röthlisberger, Reference Röthlisberger1972), N-channels (Nye, Reference Nye1976), canals (Walder and Fowler, Reference Walder and Fowler1994), linked cavities (Lliboutry, Reference Lliboutry1976; Kamb, Reference Kamb1987) and subglacial water sheets (Creyts and Schoof, Reference Creyts and Schoof2009). Modern treatments of subglacial drainage are designed to capture the distribution of basal water pressures (e.g. Werder and others, Reference Werder, Hewitt, Schoof and Flowers2013; Hoffman and Price, Reference Hoffman and Price2014; Sommers and others, Reference Sommers, Rajaram and Morlighem2018) with a view toward implementing ‘sliding laws’ that couple model outputs with treatments of ice flow to generate more accurate descriptions of glacier and ice-sheet dynamics. Conduit networks dominate the basal water flux and hence are most well-represented in model predictions of subglacial water pressures, which typically fluctuate at levels slightly lower than the glacier overburden pressure (i.e. offset by up to a few MPa), while conduit dimensions and water fluxes commonly (though not always) imply turbulent flow.
The portion of the overburden that is not supported by conduit water pressures is instead borne by elevated normal stresses that are exerted over the remainder of the sliding surface, which is separated from bed materials by very thin liquid films. These films are sometimes contorted around entrained debris and enable small quantities of locally derived melt to flow at low Reynolds numbers into conduit networks. Film regions overlie porous tills and bedrock surfaces that are often marked by frictional wear evidenced in striations and glacial polish. While the sliding resistance between clean glacier ice and the underlying bed can be traced to the high compressive normal stresses that ice exerts against the upstream sides of bed obstacles (e.g. Schoof, Reference Schoof2005), the frictional resistance and geomorphic work contributed by the relative motion between entrained debris and underlying bed materials depend additionally on local film water pressures, which can differ significantly from both the water pressures in nearby conduits and local ice–bed normal stresses. Here, we examine the controls on film water pressures to delineate between conditions under which (i) they approach the conduit pressures predicted by drainage models, (ii) they instead approach the ice–bed normal stresses captured in treatments of glacier flow or (iii) they take on intermediate values between these lower and upper limits.
In addition to the potential for water pressures to influence sliding mechanics, since local thermodynamic equilibrium is expected to prevail along the ice–liquid phase boundary itself, water pressures also influence variations in basal temperature along the sliding surface. To satisfy force equilibrium, a common constraint that all conduits share is the requirement that water pressures  $P$ along their ice-walled surfaces must match opposing ice normal stresses
 $\sigma_n$ (see Fig. 1a). This ties equilibrium temperatures to local water pressures
 $P$ through the standard Clapeyron equation that describes how the bulk melting temperature changes by approximately 0.08
 $^\circ$C for each MPa change in
 $P=\sigma_n$ (e.g. Cuffey and Paterson, Reference Cuffey and Paterson2010). Away from the conduits, bulk melting conditions can prevail with
 $P=\sigma_n$ (see Fig. 1b), but it is also possible for
 $P$ to be lower than
 $\sigma_n$ if locations exist where water films are thin enough for intermolecular forces to transmit appreciable stresses across them between the ice and bed, thereby generating nonzero thermomolecular pressures
 $P_T=\sigma_n-P$ that cause the equilibrium temperature to be reduced from the bulk melting value (see Fig. 1c), as described by Eqn (1). While the distribution of
 $\sigma_n$ in film regions is controlled by bed geometry and the mechanics of ice flow, the distribution of
 $P$ must satisfy the fluid mechanical constraints posed by the need to transport minor quantities of locally derived melt (i.e. produced by geothermal heating and mechanical dissipation) to nearby conduits. Hence, an examination of these film transport requirements can be used to discriminate between circumstances under which bulk melting conditions prevail and the distribution of water pressures is sufficient to support the entire glacier overburden, from those in which film water pressures
 $P \lt \sigma_n$, implying premelting conditions with nonzero
 $P_T$ compensating for the overburden that cannot be buoyed by
 $P$.
Schematic diagrams of the conduit/film subglacial drainage system. a) Cross-section through a subglacial conduit that is supplied by lateral film flow with melt generated at rate  $\dot m$. Film flow can be confined to the film itself if the bed is impermeable, as shown on the right, but permeable bed materials can accommodate flow as well, as illustrated with the dashed line on the left. Conduit water pressure
 $P_\phi$ and ice normal stress
 $\sigma_n$ are balanced. b) A portion of film that is sufficiently thick (
 $h_f\ge 0.1\,\unicode{x03BC}$m) for bulk melting conditions with
 $P=\sigma_n$. c) A portion of film that is sufficiently thin (
 $h_f\ll 0.1\,\unicode{x03BC}$m) for premelting conditions with the thermomolecular pressure
 $P_T$ contributing to force equilibrium and allowing lower liquid pressures
 $P=\sigma_n-P_T$. d) Plan view of a basal conduit network with intervening film areas that are idealized in the treatment of film flow provided here as approximately circular, with horizontally projected area
 $A_f$, fractional area
 $1-\phi$, and uniform bounding conduit water pressure
 $P_\phi$.

Figure 1 Long description
The schematic consists of four parts illustrating the subglacial drainage system. In section a, a cross-section of a subglacial conduit is shown, supplied by lateral film flow. The conduit is depicted with a curved shape beneath the ice, where the ice normal stress equals the conduit water pressure, labeled as sigma subscript n equals P subscript phi. Melt generation is indicated by a symbol on the left and film flow is directed towards the right along the bed. Section b illustrates bulk melting conditions with a film thickness greater than or equal to 0.1 micrometer, where the ice normal stress equals the water pressure, labeled as sigma subscript n equals P. Section c shows premelting conditions with a film thickness much less than 0.1 micrometer, where the ice normal stress equals the sum of water pressure and thermomolecular pressure, labeled as sigma subscript n equals P plus P subscript T. The thermomolecular pressure is indicated as contributing to force equilibrium, allowing lower liquid pressures. Section d presents a plan view of a basal conduit network with intervening film areas. The film regions are idealized as approximately circular, with a horizontally projected area labeled as A subscript f. The conduit water pressure is uniformly labeled as P subscript phi and flow direction is marked along the conduits.
Premelting—the equilibrium coexistence of a solid (i.e. ice) with its melt (i.e. water) at temperatures below the bulk melting temperature (e.g. Dash and others, Reference Dash, Rempel and Wettlaufer2006)—is widely recognized in subaerial contexts for its role in enabling the water transport that causes frost weathering (e.g. Walder and Hallet, Reference Walder and Hallet1986; Rempel and others, Reference Rempel, Marshall and Roering2016) and heave (e.g. Dash, Reference Dash1989; Rempel, Reference Rempel2010). Interfacial premelting is a consequence of wetting behavior, specifically that ice is wetted preferentially by liquid water rather than mineral surfaces, implying that the interfacial free energy is minimized at subzero temperatures when very thin water films intervene between the ice and bed. Effectively, the energy penalty associated with having liquid present at temperatures below the bulk melting temperature is compensated for by the reduction in free energy associated with separating ice and bed surfaces. A net repulsive pressure  $P_T=\sigma_n-P\ge 0$ acts between the ice and bed across premelted films;
 $P_T$ becomes vanishingly small as the bulk melting temperature is approached with the ice–water interface sufficiently distant from bed surfaces (i.e.
 $\gg$10 nm, vastly exceeding the
 $\sim0.2\,$nm size of a water molecule) to render intermolecular forces between them negligible, but stronger net ice–bed interactions produce increasing
 $P_T$ as the temperature drops and intervening liquid films become thinner. The generalized Clapeyron equation that describes deviations in the equilibrium temperature
 $T_\mathrm{eq}$ from a reference absolute bulk melting temperature
 $T_0$ (defined so that
 $T_\mathrm{eq}=T_0$ when
 $P_T=0$ and
 $P=P_0$; in the presence of dissolved solutes
 $T_0$ should be interpreted as the local liquidus temperature) can be written as (e.g. Style and others, Reference Style, Gerber, Rempel and Dufresne2023)
 \begin{equation}
T_\mathrm{eq}-T_0 = T_0\frac{\rho_\mathrm{i}-\rho_\mathrm{l}}{\rho_\mathrm{l}\rho_\mathrm{i}\mathcal L}\left(P-P_0+\frac{\rho_\mathrm{l}}{\rho_\mathrm{l}-\rho_\mathrm{i}}P_T\right)\;,
\end{equation}
where  $\rho_\mathrm{i}$ is ice density,
 $\rho_\mathrm{l}$ is liquid water density and
 $\mathcal L$ is the latent heat of fusion (Table 1 contains a list of symbols, physical constants and nominal parameter values). Notably, since Eqn (1) predicts that changes in
 $P_T$ induce changes in
 $T_\mathrm{eq}$ of approximately 0.9
 $^\circ$C/MPa (i.e. roughly
 $\rho_\mathrm{l}/(\rho_\mathrm{l}-\rho_\mathrm{i})\approx 12$ times the sensitivity to changes in
 $P$ when
 $P=\sigma_n$ so that
 $P_T=0$), the transient changes in normal stress induced by MPa-level conduit pressure changes that have been measured by borehole instruments with accompanying relatively minor conduit temperature responses (e.g. Huss and others, Reference Huss, Bauder, Werder, Funk and Hock2007; Andrews and others, Reference Andrews2014) have the potential to produce
 $^\circ$C-level changes in the basal temperatures of premelting film regions.
List of symbols, in alphabetical order, with Greek letters below (value of physical constant in parentheses).

Table 1 Long description
Alphabetized list mapping each symbol used in a glacier and subglacial hydrology model to its meaning, mixing geometric terms, material properties, stresses, pressures, temperatures, and flow or melt variables. Geometry and scale entries include flaw size, ice grain size, conduit spacing, glacier thickness, average glacier thickness, basal area, and depth coordinate. Water and ice properties include ice density about 9.2 times 10 to the 2 kilograms per cubic meter, water density 1 times 10 to the 3 kilograms per cubic meter, water viscosity 1.8 times 10 to the minus 3 pascal seconds, and ice–water surface energy 0.029 joules per square meter. Listed nominal or reference constants include gravity 9.8 meters per second squared, latent heat of fusion 3.3 times 10 to the 5 joules per kilogram, friction coefficient 0.6, thermomolecular pressure threshold 1 kilopascal, critical stress intensity factor 1.5 times 10 to the 5 pascal times square root of meter, and basal material buoyancy 8 times 10 to the 2 kilograms per cubic meter. Pressure and stress terms distinguish water pressure, reference pressure, pressure on conduit boundaries, pressure differences, normal stress, minimum compressive stress, effective stress, and thermomolecular pressure, with several entries defined elsewhere in the source by numbered equations. Transport terms include hydraulic conductivity and multiple transmissivities for basal films, bulk melting, basal materials, and an englacial vein network, plus conduit area fraction and vein radius of curvature. Because several definitions depend on external equations, the list functions as a symbol glossary rather than providing standalone computable relationships.
Premelting has been ascribed a central role in a wide variety of glacial sliding phenomena including enabling slip at subzero temperatures (Shreve, Reference Shreve1984; Cuffey and others, Reference Cuffey, Conway, Hallet, Gades and Raymond1999; McCarthy and others, Reference McCarthy, Savage and Nettles2017; Hank and others, Reference Hank, Tarasov and Mantelli2023; Mann and others, Reference Mann, Meyer, Robel and Mantelli2025), enhancing the rate of regelation past small permeable obstacles (Rempel and Meyer, Reference Rempel and Meyer2019), facilitating incorporation of the concentrated basal sediment sequences known as ‘frozen fringes’ (Rempel, Reference Rempel2008; Meyer and others, Reference Meyer, Schoof and Rempel2023) that have been associated with stick-slip behavior (Lipovsky and others, Reference Lipovsky2019) and may have contributed toward the formation of Heinrich layers (Meyer and others, Reference Meyer, Robel and Rempel2019), causing freeze-on of thin diffuse sediment sequences during slip over cavities (Rempel and others, Reference Rempel, Meyer and Riverman2021), imposing limits on bed strength during sliding (Meyer and others, Reference Meyer, Downey and Rempel2018) and contributing toward the dynamical controls on the oscillations of marine ice streams (Haseloff and others, Reference Haseloff, Hewitt and Katz2025). Nevertheless, the prevalence of premelting conditions beneath sliding glaciers has not previously been assessed and bulk melting conditions on sliding interfaces have often been assumed to prevail instead. Indeed, venerable theories describing the mechanics of sliding on idealized impermeable beds (e.g. Weertman, Reference Weertman1957; Lliboutry, Reference Lliboutry1968; Nye, Reference Nye1969; Kamb, Reference Kamb1970) proceed from the implicit assumption that  $P=\sigma_n$ so that
 $P_T=0$ and Eqn (1) reduces to the standard textbook description of how the bulk melting temperature changes with
 $P$ alone. In film regions, such conditions are viable if the film thickness can adjust and control the hydrodynamic resistance so that the melt supply-rate is balanced by the rate of water transport to adjacent conduits down the hydrodynamic pressure gradient associated with a distribution of
 $\sigma_n=P$ that is consistent with glacier mechanics. When either the bed or the overlying ice is sufficiently permeable, however, water transport is expected to be dominated by porous (or fracture) flow rather than flow in the thin films that line the ice–bed interface and the hydrodynamic resistance to evacuating melt from film regions has much less capacity to adjust in response to changes in
 $\sigma_n$ that must commonly accompany conduit pressure transients. To achieve a balance between the rate of melt supply to film regions and its evacuation to adjacent conduits, the hydrodynamic pressure gradient must adjust instead, causing differences between
 $\sigma_n$ and
 $P$ that produce the finite
 $P_T \gt 0$ conditions characteristic of premelting.
The connections between conduit pressures and the distribution of  $\sigma_n$ required over film regions, along with the control of phase equilibrium behavior on the manner in which
 $\sigma_n$ and
 $P$ are related, motivate an obvious question: how common are premelting conditions along subglacial beds? To proceed, we formulate an idealized treatment of melt transport from film regions to conduits in terms of a transmissivity
 $\mathcal T$ that gauges the ease of flow and hence is inversely related to the pressure gradient required to drive liquid fluxes. A particular transmissivity
 $\mathcal T_b$ emerges from this simple analysis to distinguish between: (i) low and readily varied transmissivity cases in which the bed can be regarded as effectively ‘undrained’ so that
 $P=\sigma_n$ and bulk melting conditions prevail, and (ii) high and more inflexible transmissivity cases in which the bed is ‘well drained’ so that
 $P \lt \sigma_n$ and premelting takes place. An assessment of basal melt production beneath the Greenland Ice Sheet (Karlsson and others, Reference Karlsson2021) enables order-of-magnitude estimates for
 $\mathcal T_b$ to be mapped for assumed nominal film-region areas and conduit effective-stress conditions. Calculated values are sufficiently low over vast warm-based regions that well-drained premelting conditions can be anticipated wherever meter-scale thicknesses of bed materials are present with hydraulic conductivities within the range commonly reported for glacial tills and fractured bedrock; we show that film water pressures often can be well-approximated by nearby conduit water pressures in such cases. Bulk melting conditions are expected in cases where the bed and basal ice are both effectively impermeable so that water transport can take place only through the thin films themselves; based on hydraulic considerations, we argue that these films are much thicker than the typical distances over which intermolecular forces can produce significant ice–bed stress transfers and hence
 $P\approx \sigma_n$. However, recent measurements of water transport through laboratory and natural glacier ice (Fowler and Iverson, Reference Fowler and Iverson2023, Reference Fowler and Iverson2025) suggest that residual fluid pathways along the veins that line crystal edges may short-circuit flow through basal films. Accordingly, we discuss the potential for englacial water transport to cause
 $P$ to drop below
 $\sigma_n$ even when the underlying bedrock is idealized as completely impermeable. Before concluding, we briefly highlight a few of the more important potential complications and implications of how premelting and bulk melting conditions are distributed along basal sliding surfaces. We also revisit high-resolution temperature data from the Kangerlussuaq sector of Greenland that appears to provide empirical evidence for a mixture of premelting and bulk melting conditions on a hard bed with overlying basal crevasses (McDowell and others, Reference McDowell, Humphrey, Harper and Meierbachtol2021).
Film drainage
The relative prevalence of premelting and bulk melting conditions depends critically on whether the liquid pressures  $P$ in the thin films that line the glacial bed outside conduits match the normal stresses exerted by the overlying ice
 $\sigma_n$. Noting that both
 $\sigma_n$ and
 $P$ are expected to vary spatially, the vertical force balance over a basal area
 $\mathcal A$ upon which the glacier weight is supported locally (i.e. the net contribution from shear stresses over the boundaries of
 $\mathcal A$ is negligible) can be written as
 \begin{equation}
\rho_{\mathrm{i}} g\int_{\mathcal{A}} H \, \mathrm{d} A =\int_{\mathcal{A}}\sigma_{n}\mathrm{d} A= \int_{\mathcal{A}}\left(P + P_{T}\right) \,\mathrm{d} A,\end{equation}
where  $\rho_\mathrm{i} g$ is the weight density of ice,
 $H$ is glacier thickness, the local thermomolecular pressure is defined as
 $P_T=\sigma_n-P\ge 0$, and the area element
 $\mathrm{d} A$ can be interpreted as the horizontal projection of the (generally rough) bed surface. (For clarity and simplicity, here the bed is treated as predominantly horizontal, but the arguments are easily extended to cases with sloped beds.) As noted above, when
 $P=\sigma_n$, thermodynamic equilibrium implies bulk melting conditions on the ice–liquid interface, whereas premelting is characterized by
 $P_T \gt 0$. Following glaciological convention, the effective stress
 $N$ is defined here as the difference between the average overburden stress and the local liquid pressure so that
 \begin{equation}
N = \frac{\rho_{\mathrm{i}}g}{\mathcal A}\int_{\mathcal{A}} H\, \mathrm{d} A - P = \rho_{\mathrm{i}}{\rm g} \bar H-P,
\end{equation}
where  $\bar H$ is the average ice thickness over
 $\mathcal A$. Note that
 $N$ emerges as an important output of drainage models because creep closure of conduits is driven by stress gradients in the ice that are commonly idealized as proportional to the difference between the average overburden stress and the stress on conduit walls.
The bed can be divided into regions spanned by conduits with horizontally projected fractional area  $\phi$ and film regions that make up the rest of
 $\mathcal A$ (depicted schematically for an ‘inefficient’ conduit network in Fig. 1d). Denoting the spatial average of the effective stress over conduits as
 \begin{equation}
\bar N_\phi=\frac{1}{\phi \mathcal A}\int_{\phi\mathcal A} N\,\mathrm{d} A\;,\end{equation}
Eqns (2) and (3) can be combined to write the vertical force balance as
 \begin{equation}
\phi\bar{N}_\phi =\left(1-\phi\right)\left(\bar P_\mathrm{T} + \bar P_\mathrm{f} - \rho_\mathrm{i} g \bar H\right)\;,\end{equation}
where  $\bar P_\mathrm{T}$ and
 $\bar P_\mathrm{f}$ are defined as spatial averages of the thermomolecular and water pressures over the film regions alone so that
 \begin{equation}
\bar P_\mathrm{T} = \frac{1}{\left(1-\phi\right)\mathcal A} \int_{\left(1-\phi\right)\mathcal A} P_\mathrm{T}\,\mathrm{d}A\;,
\end{equation}
 \begin{equation}
\mbox{and }
\bar P_\mathrm{f} = \frac{1}{\left(1-\phi\right)\mathcal A }\int_{\left(1-\phi\right)\mathcal A} P\,\mathrm{d} A\;.
\end{equation}
In the important limiting case where the film water is at its bulk melting temperature,  $P_\mathrm{T}=0=\bar P_\mathrm{T}$ and the average film pressure from Eqn (5) is
 \begin{equation}
\bar P_\mathrm{f} = \rho_\mathrm{i} g \bar H + \frac{\phi}{1-\phi} \bar N_\phi\;.
\end{equation}
The spatially averaged effective stress over conduits  $\bar N_\phi$ is expected to be often reflected in values inferred from borehole observations—at least when hot-water drilling procedures lead to abrupt borehole drainage as the basal interface is penetrated, signaling hydraulic connection with nearby conduits (e.g. Iken and Bindschadler, Reference Iken and Bindschadler1986; Kavanaugh and Clarke, Reference Kavanaugh and Clarke2000; Huss and others, Reference Huss, Bauder, Werder, Funk and Hock2007; Bartholomaus and others, Reference Bartholomaus, Anderson and Anderson2011; Meierbachtol and others, Reference Meierbachtol, Harper and Humphrey2013; Andrews and others, Reference Andrews2014; Rada and Schoof, Reference Rada and Schoof2018). Importantly, for the film water to be maintained at bulk equilibrium with
 $\bar P_\mathrm{T}=0$, the rapid changes that commonly characterize inferred fluctuations in
 $\bar N_\phi$ are expected to require commensurate adjustments to the average film pressure
 $\bar P_\mathrm{f}$ (potentially offset in part by changes in conduit area fraction
 $\phi$) to maintain the vertical force balance described by Eqn (8). Also, since
 $\bar N_\phi \gt 0$ typically, Eqn (8) implies that
 $\bar P_f$ exceeds the average overburden pressure and the straightforward application of published treatments (e.g. van der Veen, Reference van der Veen1998) suggests that one might expect bulk melting conditions over film regions to be favorable for the formation of basal crevasses; we return to consider this possibility further in the ‘Discussion’ section.
In the following, we restrict our attention to situations in which  $\bar N_\phi \gt 0$ so that conduits act as sinks for meltwater generated by geothermal heating and mechanical dissipation in film regions, and we assume that changes in total film-region water volume are insignificant on the time scale for melt transport into conduits. For clarity and simplicity, we also neglect the influence of basal elevation changes on the hydrodynamic potential (the Appendix discusses approximate criteria under which this neglect is valid) and assume that the transport pathways that drain film regions are much thinner than their horizontal extent so that water flow is well-approximated as parallel to the bed at a flux that is proportional to bed-parallel pressure gradients
 $\nabla P$ (appropriate for expected low Reynolds number conditions) according to the local value of transmissivity
 $\mathcal T$. Over time periods during which the rate of basal melting
 $\dot m$ and the total film water content can be regarded as unchanging, mass conservation requires that the pressure distribution in film regions is described by
 \begin{equation}
\nabla \cdot \left({\mathcal T}\nabla P\right) + \rho_\mathrm{i} g\dot m = 0\;.
\end{equation}
The water pressure is constrained to be continuous, so that with the effective stress in the conduits surrounding a given film region treated as approximately uniform at  $\bar N_\phi$, the pressure attains a value of
 $P=P_\phi=\rho_\mathrm{i} g \bar H - \bar N_\phi$ on film boundaries. The areal footprints, or shapes, of film regions are expected to be highly variable, but independent of such details, since
 $\bar P_f \gt P_\phi$ and discontinuities in water pressure are not allowed,
 $P$ must reach a maximum somewhere in the film interior where
 $\nabla P=0$.
The idealized case of a circular film region of area  $A_f$ with a flow divide (i.e.
 $\nabla P=0$) at its center provides a useful, straightforward illustration (see Fig. 1d), with Eqn (9) subject to the boundary conditions just described leading to
 \begin{equation}
\bar P_\mathrm{f}=\frac{1}{A_\mathrm{f}}\int_{A_\mathrm{f}} P\,\mathrm d A=\rho_\mathrm{i} g \bar H - \bar N_\phi +\frac{\rho_\mathrm{i} g \dot m A_\mathrm{f}}{8\pi \mathcal T}\;,\end{equation}
where the melt rate and transmissivity have both been treated as uniform. When  $\bar P_T=0$, the vertical force balance condition from Eqn (8) gives a second constraint on
 $\bar P_\mathrm{f}$. Combining these results, the transmissivity
 $\mathcal T$ needed for bulk equilibrium conditions to be met is
 \begin{equation}
\mathcal T_\mathrm{b}= \frac{\rho_\mathrm{i} g\dot m A_\mathrm{f}\left(1-\phi\right)}{8\pi \bar N_\phi}\;,
\end{equation}
which is directly proportional to the integrated film melt supply  $\dot m A_\mathrm{f}$ and inversely proportional to the hydrostatic column height, or scaled conduit head, needed to offset the load that film regions must support to compensate for the average effective stress over conduits
 $\bar N_\phi/[\rho_\mathrm{i} g(1-\phi)]$. For finite rates of melting and positive conduit effective stress,
 $\mathcal T_\mathrm{b}$ represents the minimum film-region transmissivity that can satisfy both the vertical force balance and the film-region water balance constraints.
In cases with  $\mathcal T \gt \mathcal T_\mathrm{b}$, water pressures are too low to support the glacier weight on their own and the average thermomolecular pressure needed to satisfy the vertical force balance from Eqn (5) is
 \begin{equation}
\bar P_\mathrm{T} = \frac{\bar N_\phi}{1-\phi}-\frac{\rho_\mathrm{i} g \dot m A_\mathrm{f}}{8 \pi \mathcal T} = \frac{\bar N_\phi}{1-\phi}\left(1-\frac{\mathcal T_\mathrm{b}}{\mathcal T}\right)\;.\end{equation}
In important limiting cases where  $\mathcal T\gg \mathcal T_\mathrm{b}$, Eqn (10) implies that
 $\bar P_\mathrm{f}$ approaches the conduit water pressure
 $P_\phi$ and Eqn (12) indicates that
 $\bar P_\mathrm{T}\approx \bar N_\phi/(1-\phi)$.
The details of water transport beneath film regions with noncircular geometries are expected to differ, but dimensional arguments and the linearity of Eqn (9) governing flow suggest that the direct dependence of  $\mathcal T_\mathrm{b}$ [units of (length)
 $^2$(time)
 $^{-1}$] on the ratio between melt supply
 $\dot m A_\mathrm{f}$ [(length)
 $^3$(time)
 $^{-1}$] and conduit head
 $\bar N_\phi/[\rho_\mathrm{i} g(1-\phi)]$ [length] can be expected to hold more generally—albeit with different numerical prefactors. For example, analysis of melt transport from film regions into a series of parallel conduits that are separated by distance
 $2D$ (Rempel, Reference Rempel2009, see table 1B) leads to a characteristic transmissivity
 $\mathcal T_\mathrm{b}$ of the same form as Eqn (11), with the factor of
 $A_\mathrm{f}/8\pi$ replaced by
 $D^2/3$. More involved complications are anticipated when basal topography exerts a strong influence on film flow or when heterogeneities in the effective stress within drainage elements are significant enough that the water pressure cannot be approximated as uniform on the boundaries of adjacent film regions. Given the limited state of knowledge for how transmissivity, melt rate, the areas of film regions, and effective stress vary in the basal environment, an order-of-magnitude estimate for
 $\mathcal T_\mathrm{b}$ is considered sufficient for the current goal of providing a metric to discriminate between locations where bulk melting with
 $P=\sigma_n$ and premelting conditions with
 $P \lt \sigma_n$ often approaching
 $P_\phi$ are most likely to characterize subglacial film regions.
When a water film disjoins impermeable glacier ice from an impermeable bed, lubrication theory relates the transmissivity to the film thickness  $h_f$ through (e.g. Batchelor, Reference Batchelor2000, p. 220)
 \begin{equation}
\mathcal T_\mathrm{f} = \frac{\rho_\mathrm{l} g h_\mathrm{f}^3}{12\mu}\;,
\end{equation}
where  $\rho_\mathrm{l} g$ is the weight density of liquid water and
 $\mu$ is its viscosity. Assuming bulk equilibrium conditions, this is easily combined with Eqn (11) to make predictions for how
 $h_\mathrm{f}$ varies in response to changes in
 $\bar N_\phi$, recognizing that borehole observations suggest variations in
 $\bar N_\phi$ with wide ranges in amplitude and duration that would be difficult to balance by commensurate changes in melt supply
 $\dot m A_\mathrm{f}$ or fractional drainage area
 $\phi$ so that although these parameters almost certainly change as well they could reasonably be treated as constant for the purposes of approximating changes in
 $h_\mathrm{f}$. When premelting takes place, the film thickness
 $h_\mathrm{f}$ is tied to the local value of the disjoining pressure
 $P_\mathrm{T}$ because the strength of intermolecular interactions between the molecules of ice and bed materials and the liquid water that separates them depends on
 $h_\mathrm{f}$ (e.g. Israelachvili, Reference Israelachvili2011). These intermolecular forces are sensitive to surface and aqueous chemistry and many other microphysical parameters, causing laboratory measurements to exhibit a range of thickness variations in different experimental systems, with a notable dependence as well on the sensitivities of the particular probe used to infer thickness values (e.g. Sadtchenko and Ewing, Reference Sadtchenko and Ewing2002; Dash and others, Reference Dash, Rempel and Wettlaufer2006). With these complications acknowledged, a distinction can nevertheless be drawn between film thicknesses that are consistent with bulk melting conditions (i.e.
 $P_\mathrm{T}\rightarrow 0$) and those that are sufficiently thin to require appreciable values of
 $P_\mathrm{T} \gt 0$. In premelting ice–water systems with
 $P\approx P_0$, film thicknesses inferred from a variety of methods (including proton backscattering, atomic force microscopy, optical ellipsometry, grazing angle x-ray diffraction, photoelectron spectroscopy, molecular dynamics calculations, optical reflection, infrared spectroscopy, neutron scattering, helium-atom scattering, wire regelation, particle rejection during freezing and ice lens growth) typically range between 10 and 1 nm when
 $T_0-T_\mathrm{eq}$ from Eqn (1) is between 0.1 and 1
 $^\circ$C, corresponding with
 $P_\mathrm{T}$ between 0.1 and 1 MPa (e.g. Saruya and others, Reference Saruya, Kurita and Rempel2014, see their fig. 3). Hence, when
 $h_\mathrm{f}$ is inferred to greatly exceed 10 nm (
 $0.01\,\unicode{x03BC}$m), it is reasonable to conclude that
 $P_\mathrm{T}$ is negligible, indicating that bulk melting conditions are met. For intuition, Eqn (13) yields
 $\mathcal T_\mathrm{f}\approx 5\times 10^{-16}\,$m
 $^2$ s
 $^{-1}$ when
 $h_f=0.1\,\unicode{x03BC}$m, so when
 $\mathcal T_\mathrm{b}$ is of this scale or greater and both the ice and the bed are completely impermeable, bulk melting conditions are anticipated.
When a glacier bed is comprised of granular or highly fractured material, water flow toward conduits is no longer constrained to take place solely within the basal film. The transmissivity of a permeable bed that extends over a depth range  $\xi$ is defined by its depth-integrated hydraulic conductivity
 $K$ as
 \begin{equation}
\mathcal T_\mathrm{p} = \int_\xi K\,\mathrm{d}z\;.
\end{equation}
Even when the thickness of the permeable material is less than a meter, its influence on the distribution of water pressures can easily dominate over the role played by films. With water flow idealized as completely bed-parallel, the combination of flow through films and permeable bed materials leads to effective transmissivity
 \begin{equation}
\mathcal T = \mathcal T_\mathrm{f} + \mathcal T_\mathrm{p}\;.
\end{equation}
Poroelastic effects can cause the hydraulic conductivity of bed materials to respond diffusively to variations in liquid pressure (e.g. Tulaczyk and others, Reference Tulaczyk, Kamb and Engelhardt2000), but the resulting proportional changes in  $\mathcal T_\mathrm{p}$ are expected to be relatively small and certainly less amenable to rapid and large amplitude changes than the cubic sensitivity to an adjustable film thickness enables
 $\mathcal T_\mathrm{f}$ to respond. This suggests that when bed materials are sufficiently extensive and permeable that
 $\mathcal T_\mathrm{p}\gg \mathcal T_\mathrm{f}$ so that Eqn (15) reduces to
 $\mathcal T\approx \mathcal T_\mathrm{p}$, the transmissivity that characterizes bulk melting conditions cannot generally be met. Put another way, since
 $\mathcal T_\mathrm{b}$ is controlled by melt transport requirements that are expected to often be strongly influenced by transient changes in conduit effective stress, whereas these hydraulic considerations have a relatively minor influence on the geometry of the interconnected pore networks that give rise to
 $\mathcal T_\mathrm{p}$, it is unreasonable to expect
 $\mathcal T_\mathrm{b}$ and
 $\mathcal T_\mathrm{p}$ to stay balanced.
Englacial liquid networks represent additional potential routes for water transport. Laboratory measurements of flow through intact polycrystalline ice at water volume fractions ranging from 0.1 to 4.4% have yielded permeabilities in the range of  $10^{-15}-10^{-12}\,$m
 $^2$ (Fowler and Iverson, Reference Fowler and Iverson2023); noting that permeability and hydraulic conductivity are related through the ratio
 $\rho_l g/\mu= O(10^7\,\mathrm{m^{-1}s^{-1}})$, these permeability measurements imply hydraulic conductivities of order
 $10^{-8}-10^{-5}\,$m s
 $^{-1}$. Moreover, field evidence has been found for the dynamic participation of basal crevasses in englacial storage and water transport (e.g. Harper and others, Reference Harper, Bradford, Humphrey and Meierbachtol2010; Gajek and others, Reference Gajek, Gräff, Hellmann, Rempel and Walter2021). Distributions of in situ water content in basal ice are not well known and the prevalence of basal crevassing is also largely uncertain. To make progress, in the following section, we first consider the equilibrium state of film regions beneath the Greenland ice sheet under the assumption that basal ice is sufficiently impermeable for englacial water transport to be neglected. In the subsequent section, we consider idealized cases in which englacial flow above film regions is permitted, but the underlying bed is impermeable. Brief further consideration of basal crevassing is reserved for the ‘Discussion’ section.
Premelting potential beneath the Greenland Ice Sheet
The arguments given above suggest that a necessary (but not sufficient) condition for bulk melting to occur over film regions is that the transmissivity of underlying bed materials  $\mathcal T_\mathrm{p}$ is lower than
 $\mathcal T_\mathrm{b}$. With water flow effectively confined to the films alone in such cases, Eqn (15) reduces to
 $\mathcal T\approx \mathcal T_\mathrm{f}$ and adjustments to the film thickness
 $h_\mathrm{f}$ can enable
 $\mathcal T_\mathrm{f}$ to match temporal and spatial changes in
 $\mathcal T_\mathrm{b}$ that accompany changes in the average effective stress of surrounding conduits
 $\bar N_\phi$ and the other controlling variables in Eqn (11). Premelting should be expected when
 $\mathcal T_\mathrm{p} \gt \mathcal T_\mathrm{b}$ since this implies that efficient drainage prohibits maintenance of the elevated water pressures needed to match the distribution of
 $\sigma_n$ over film regions. Discussion of the potential for englacial transport to enable premelting to also occur in film regions with
 $\mathcal T_\mathrm{p} \lt \mathcal T_\mathrm{b}$ is delayed to the subsequent section.
Estimates of basal meltwater production  $\dot m$ beneath the Greenland Ice Sheet by Karlsson and others (Reference Karlsson2021) can be used to generate order-of-magnitude estimates of
 $\mathcal T_\mathrm{b}$ for reasonable values of the remaining input parameters in Eqn (11). Sparse measurements of the effective stress probed in boreholes and moulins reveal highly variable conditions, suggesting that
 $\bar N_\phi$ can span several orders of magnitude, with commonly reported values ranging between
 $10^3$ and
 $10^6$ Pa (e.g. Meierbachtol and others, Reference Meierbachtol, Harper and Humphrey2013; Andrews and others, Reference Andrews2014). In the following, we adopt a nominal value of
 $\bar N_\phi=10^5\,$Pa; for context, the median gravitational driving stress for the Greenland Ice Sheet is approximately
 $7\times 10^4\,$Pa (Meyer and others, Reference Meyer, Downey and Rempel2018), which is comparable to the frictional resistance expected between entrained debris and bedrock when their contacts support a load of
 $10^5\,$Pa. Film areas
 $A_\mathrm{f}$ (or conduit spacings
 $D$) and areal fractions
 $1-\phi$ are poorly constrained at present, though ongoing instrument developments hold promise for improved quantification of these properties in future (e.g. Schroeder and others, Reference Schroeder2026); models of subglacial hydrology support large seasonal and spatial variations in drainage network characteristics, reflecting dependence on the supply of meltwater from the glacier surface, sliding speed,
 $\bar N_\phi$ and detailed basal topography (e.g. Schoof, Reference Schoof2010; Hewitt, Reference Hewitt2013; Werder and others, Reference Werder, Hewitt, Schoof and Flowers2013; Sommers and others, Reference Sommers, Rajaram and Morlighem2018). We make no attempt to account for these complicated factors and instead make an, admittedly arbitrary, nominal choice of
 $A_\mathrm{f}(1-\phi)=10^2\,$m
 $^2$, which contributes to our estimate for the controlling ratio
 $\bar N_\phi/[A_\mathrm{f}(1-\phi)]=10^3\,$Pa m
 $^{-2}$. Taken together with the spatial distribution of frictional and geothermal melt components reported by Karlsson and others (Reference Karlsson2021), we used Eqn (11) to produce the map of
 $\mathcal T_b$ that is shown in Fig. 2.
Map of basal transmissivity (in m $^2$ s
 $^{-1}$ with a base 10 logarithmic scale) required for bulk melting conditions to persist in film regions beneath the Greenland Ice Sheet when
 $\bar N_\phi/[A_\mathrm{f}(1-\phi)]=10^3\,$Pa m
 $^{-2}$. From Eqn (11),
 $\mathcal T_\mathrm{b}$ is inversely proportional to
 $\bar N_\phi/[A_\mathrm{f}(1-\phi)]$ so an increase in this parameter ratio by an order of magnitude would decrease calculated values of
 $\mathcal T_\mathrm{b}$ by an order of magnitude. Note that the darkest blue regions on this map represent locations where evidence suggests that the bed is frozen and
 $\mathcal T_\mathrm{b}$ can be regarded as arbitrarily small since bulk melting is not expected. The red ‘x’ marks the approximate location of borehole temperature measurements reported by McDowell and others (Reference McDowell, Humphrey, Harper and Meierbachtol2021) that are displayed in Fig. 5 (
 $\mathcal T_\mathrm{b}\approx 3\times 10^{-9}\,$m
 $^2$s
 $^{-1}$ in this area). Coastlines are outlined at a very coarse resolution in black.

Figure 2 Long description
Map of Greenland depicting basal transmissivity required for bulk melting conditions beneath the ice sheet. The scale is logarithmic, ranging from -10 to -7.5 m squared s superscript -1. Darkest blue areas coincide with frozen bed conditions, while color gradations towards yellow indicate the increasingly elevated transmissivities required for bulk melting. The map centers on Greenland and shows geographic coordinates. The legend provides the transmissivity scale that is valid when the controlling ratio of N subscript phi over A subsript f times 1 minus phi equals ten thousand Pa per meter squared. Coastal regions generally require higher transmissivities for bulk melting conditions combered to inland areas.
Much of the central region of Greenland and all of the areas shown in the darkest blue shade on Fig. 2 are locations where the bed is believed to be frozen (MacGregor and others, Reference MacGregor2016, Reference MacGregor2022) and the current analysis does not apply. The melt rate is inferred to be positive over the remainder of the bed, with the highest rates taking place beneath coastal outlet glaciers with significant frictional dissipation. In these locations, calculated values of  $\mathcal T_b$ commonly exceed
 $10^{-8}\,$m
 $^2$ s
 $^{-1}$ and reach a maximum of
 $1.1\times 10^{-6}\,$m
 $^2$ s
 $^{-1}$ for the applied nominal parameter ratio
 $\bar N_\phi/[A_\mathrm{f}(1-\phi)]=10^3\,$Pa m
 $^{-2}$. Over most of the remaining warm-based area,
 $\mathcal T_\mathrm{b}$ is closer to
 $10^{-9}\,$m
 $^2$ s
 $^{-1}$, with a mean value over all grid points with positive
 $\dot m$ of
 $1.3\times 10^{-9}\,$m
 $^2$ s
 $^{-1}$ (corresponding with
 $\dot m\approx15\,$mm a
 $^{-1}$) and a median of
 $6.5\times 10^{-10}\,$m
 $^2$ s
 $^{-1}$ (corresponding with
 $\dot m\approx 7.1\,$mm a
 $^{-1}$); where flow is confined to the films alone so that
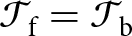 $\mathcal T_\mathrm{f}=\mathcal T_\mathrm{b}$ Eqn (13) yields the median transmissivity when
 $h_\mathrm{f}\approx 11\,\unicode{x03BC}$m (the mean would imply
 $h_\mathrm{f}\approx 14\,\unicode{x03BC}$m). Where conduits are subject to higher
 $\bar N_\phi$ or film regions cover smaller areas
 $A_\mathrm{f}$ or fractional areas
 $1-\phi$, the parameter ratio
 $\bar N_\phi/[A_\mathrm{f}(1-\phi)]$ is higher than the nominal value used to produce Fig. 2 and the estimate of
 $\mathcal T_\mathrm{b}$ should be reduced accordingly. For example, an increase in
 $\bar N_\phi/[A_\mathrm{f}(1-\phi)]$ by three orders of magnitude to
 $10^6\,$Pa m
 $^{-2}$ would reduce the median
 $\mathcal T_b$ calculated for warm-bedded regions of Greenland to
 $6.5\times 10^{-13}\,$m
 $^2\,$s
 $^{-1}$, which would be matched by
 $\mathcal T_f$ where
 $h_f\approx 1.1\,\unicode{x03BC}$m. To lower the median
 $\mathcal T_\mathrm{b}$ to be comparable with the anticipated
 $\mathcal T_\mathrm{f} \approx 5\times 10^{-16}\,$m
 $^2$ s
 $^{-1}$ where
 $h_\mathrm{f}=0.1\, \unicode{x03BC}$m would require yet a further three order of magnitude increase to
 $\bar N_\phi/[A_\mathrm{f}(1-\phi)]\approx 3\times10^9\,$Pa m
 $^{-2}$. Though small film areas with particularly low rates of melt supply could perhaps be found that satisfy
 $\mathcal T_\mathrm{b}=\mathcal T_\mathrm{f}$ when
 $h_f \lt 0.1 \, \unicode{x03BC}$m and thermomolecular pressures between ice and bed materials begin to become important, these simple considerations suggest that such thin films are likely to be rare in regions that are adequately characterized by perfectly impermeable ice sliding over perfectly impermeable bedrock. Bulk melting conditions must prevail in such locations.
The hydraulic conductivities and thicknesses of porous bed materials beneath Greenland are not known in any detail and are undoubtedly heterogeneous (e.g. Walter and others, Reference Walter, Chaput and Lüthi2014; Harper and others, Reference Harper, Humphrey, Meierbachtol, Graly and Fischer2017). Nevertheless, some guidance for what to expect can be gained from standard hydrogeology textbooks, for example, with Freeze and Cherry (Reference Freeze and Cherry1979, see their table 2.2) citing a broad range of values between  $10^{-12}$ and
 $10^{-6}$ m s
 $^{-1}$ for the hydraulic conductivities
 $K$ of glacial tills, so that Eqn (14) would imply values of
 $\mathcal T_p$ ranging from
 $10^{-12}\;\mathrm{to}\;10^{-6}\,$m
 $^2$ s
 $^{-1}$ where the glacier bed is mantled by tills of meter-scale thickness. Our interest is focussed on basal materials found immediately adjacent to sliding glacial ice that is almost completely supported by pressurized meltwater, implying that interparticle stress transfer is limited in granular layers adjacent to basal ice. Recognizing that some of the till samples used to compile the broad
 $K$ range provided by Freeze and Cherry (Reference Freeze and Cherry1979) may have been subject to postdepositional burial and compaction, it is likely that the lower end of the quoted
 $K$ range is less common under in situ subglacial conditions. More refined estimates of
 $K$ can be gained from alternative descriptions of the hydraulic properties of deglaciated landscapes. Fulton (Reference Fulton1993) compiled a map of surficial materials in Canada, including most of the region formerly glaciated by the Laurentide Ice Sheet. Focussing on the exposed land surface west of Greenland on Baffin Island (labeled on Fig. 2), for example, significant areas of exposed bedrock are found, but the majority of that terrain is covered either by a ‘till blanket’ or ‘till veneer’. An approximate analysis of the hydraulic properties of these materials by Marshall and others (Reference Marshall, Clarke, Dyke and Fisher1996, see their table 1) yielded hydraulic conductivities ranging between
 $4\times 10^{-8}$ and
 $1.8\times 10^{-7}\,$m s
 $^{-1}$. These estimates are similar to the median of
 $7.5\times 10^{-8}\,$m s
 $^{-1}$ compiled by Norris (Reference Norris1963) from 37 measurements on till samples from Wisconsinan age sites in Ohio, Illinois and South Dakota (2 samples with
 $K \lt 10^{-9}\,\mathrm{m\,s^{-1}}$, 6 with
 $10^{-9}\,\mathrm{m\,s^{-1}} \lt K \lt 10^{-8}\,\mathrm{m\,s^{-1}}$, 15 with
 $10^{-8}\,\mathrm{m\,s^{-1}} \lt K \lt 10^{-7}\,\mathrm{m\,s^{-1}}$ and the remaining 14 with
 $K \gt 10^{-7}\,\mathrm{m\,s^{-1}}$). Assuming that till layers beneath the Greenland Ice Sheet have similar properties to those that formerly coated much of the bed of the Laurentide Ice Sheet, comparison with the map shown in Fig. 2 suggests that
 $\mathcal T_p\gg \mathcal T_b$ wherever till thicknesses are of meter scale or greater, and perhaps even where till thicknesses are only of decimeter scale, or thinner still. Indeed, the hydraulic conductivities quoted for fractured igneous and metamorphic rocks by Freeze and Cherry (Reference Freeze and Cherry1979), see table 2.2 range between
 $10^{-8}$ and over
 $10^{-4}\,$m s
 $^{-1}$, suggesting that portions of the bed may be sufficiently well drained to prevent bulk melting conditions from being reached and maintained over film regions from which till has been stripped away completely.
Englacial water transport over impermeable beds
The potential for water to flow through the basal ice overlying film regions has been neglected to this point. However, recent laboratory measurements of ice permeability span a range of values (Fowler and Iverson, Reference Fowler and Iverson2023, Reference Fowler and Iverson2025) that might imply effective transmissivities exceeding values of  $\mathcal T_\mathrm{b}$ that characterize warm-based regions beneath the Greenland Ice Sheet (see Fig. 2). The networks of triple junctions, or veins, that host such englacial flow (see Fig. 3) are themselves a separate manifestation of premelting that is caused by the surface energy of curved ice–liquid interfaces along the edges where three ice grains meet. This recognition might be interpreted strictly to imply that since the veins in basal ice are physically connected to the water films beneath glaciers, and both the temperature and pressure fields are continuous, all basal polycrystalline ice must be undergoing some degree of premelting. The less inclusive, more functional distinction between film regions that are described here as governed by premelting conditions and those that are effectively under bulk melting conditions is made on the basis of whether or not the thermomolecular pressure contributes meaningfully to supporting the glacial overburden, resulting in significant differences between
 $\sigma_n$ and
 $P$. Accordingly, we set a conservative threshold of
 $P_t=1\,$kPa as an upper bound on
 $P_T$ for cases in which water pressures alone effectively balance the overburden stress so that bulk melting conditions govern film behavior; this is consistent with the idea pursued earlier of designating
 $h_f=0.1\,\unicode{x03BC}$m as an approximate lower bound on film thickness for bulk melting conditions to be obtained.
The liquid network in polycrystalline ice. (a) Photograph supplied by Heidi Mader of a node connecting four veins, taken during experiments described in Mader (Reference Mader1992). Note the definition of vein radius  $R_v$ emerging from the center of curvature of the vein wall, which is exterior to the vein itself. (b) Schematic three-dimensional diagram of the vein network along the boundaries between ice grains, taken from Nye (Reference Nye1989) and labeled with the approximate ice grain size
 $d$. The liquid volume fraction is approximately
 $0.3(R_\mathrm{v}/d)^2$.

The effect of surface energy on the equilibrium melting temperature in veins (known as the Gibbs–Thomson effect) can be described using Eqn (1) with  $P_\mathrm{T} = \gamma/R_\mathrm{v}$, where the ice–liquid surface energy
 $\gamma\approx 0.029\,$J m
 $^{-2}$ (Hardy, Reference Hardy1977) and
 $R_\mathrm{v}$ is the vein radius of curvature (see Fig. 3a). Nye (Reference Nye1991) argued that the liquid volume fraction in polycrystalline ice is proportional to the squared ratio of
 $R_\mathrm{v}$ to the grain diameter
 $d$, with a constant of proportionality that depends on dihedral angle; observations by Mader (Reference Mader1992) support a value for this constant of proportionality of approximately 0.3. Combining these geometrical considerations and setting
 $P_T=P_t$ suggests that the bulk melting conditions considered here are obtained when the liquid volume fraction exceeds a minimum of
 $0.3[\gamma/(P_\mathrm{t} d)]^2\approx 0.008$ % for
 $d=1.8\,$mm and 0.001 % for
 $d=4.4\,$mm. Fowler and Iverson (Reference Fowler and Iverson2023) tabulate permeability measurements over a range of liquid fractions extending as low as 0.1% by volume for polycrystalline ice with these two grain sizes, seeded by two different methods for the coarser case. Extrapolated power-law fits of their data down to the targeted liquid fractions (see Fig. 4) lead to permeability estimates of
 $2.6\times 10^{-19}\,$m
 $^2$ for the
 $d=1.8\,$mm case,
 $6.0\times 10^{-19}\,$m
 $^2$ for the
 $d=4.4\,$mm case seeded by snow and
 $1.1\times 10^{-18}\,$m
 $^2$ for the
 $d=4.4\,$mm case seeded by ice spheres. Scaled by
 $\rho_l g/\unicode{x03BC}$, the largest of these permeability estimates corresponds with
 $K$ of order
 $10^{-11}\,$m s
 $^{-1}$, which is adopted here as an approximate upper limit for cases in which premelting effects are significant for the basal force balance and equilibrium temperature. Assuming that englacial flow-paths have approximately equant dimensions, the effective thickness of basal ice that participates in melt transport from film regions to conduits should scale with the square root of film area, which implies that for the nominal choice of
 $A_\mathrm{f}\approx 100\,$m
 $^2$ the ice transmissivity
 $\mathcal T_\mathrm{i}$ to water flow over film regions must be lower than
 $ K\sqrt{A_f} \approx 10^{-10}\,$m
 $^2$ s
 $^{-1}$ when
 $P_T \gt P_t$.
Permeability data (x’s) reported by Fowler and Iverson (Reference Fowler and Iverson2023, table 2) for the different labeled crystal sizes and sample preparation methods. Permeability estimates at the lower liquid fractions anticipated when  $P_T=1\,$kPa are marked with filled square symbols at the termination of dashed extrapolations of the power-law fits shown with solid lines.

The median value of  $\mathcal T_\mathrm{b}\approx 6.5\times 10^{-10}\,$m
 $^2$ s
 $^{-1}$ found for warm-based regions beneath the Greenland Ice Sheet, shown in Fig. 2, is similar to the estimated limit on
 $\mathcal T_\mathrm{i}$ just obtained for the ice overlying film regions governed by premelting. This correspondence suggests that, while englacial transport through vein networks may often make significant contributions to water transport in film regions that are governed by bulk melting conditions so that the overlying ice is characterized by higher liquid fractions and permeabilities, circumstances in which such englacial flows represent a significant enough contribution to film-region drainage to enable premelting conditions with
 $P_\mathrm{T} \gt P_\mathrm{t}$ are likely to be more rare. Nevertheless, as noted earlier, values of
 $\mathcal T_\mathrm{b}$ are reduced when the parameter
 $\bar N_\phi/[A_\mathrm{f}(1-\phi)]$ is larger than the nominal value used to obtain Fig. 2. More specifically, since
 $\mathcal T_\mathrm{b}\propto A_\mathrm{f}$, whereas
 $\mathcal T_\mathrm{i}\propto \sqrt{A_\mathrm{f}}$,
 $\mathcal T_\mathrm{b}$ is diminished more quickly than
 $\mathcal T_\mathrm{i}$ as
 $A_\mathrm{f}$ is reduced. For example, with all other parameters unchanged, but
 $A_\mathrm{f}$ decreased to 1 m
 $^2$, as might characterize conduits that are arranged in the style of closely spaced linked cavities, the ice transmissivity when
 $P_\mathrm{T}=P_\mathrm{t}$ is reduced to
 $\mathcal T_\mathrm{i}\approx 10^{-11}\,$m
 $^2$ s
 $^{-1}$, which exceeds the correspondingly shifted median value of
 $\mathcal T_\mathrm{b}\approx 6.5\times 10^{-12}\,$m
 $^2$ s
 $^{-1}$. The implication is that englacial transport above film regions with relatively small areas may reduce liquid pressures enough to produce premelting conditions with
 $P_\mathrm{T} \gt P_\mathrm{t}$, even when the underlying bed is effectively impermeable so that
 $\mathcal T_\mathrm{p}\ll \mathcal T_\mathrm{b}$. Following similar reasoning, during time periods when
 $\bar N_\phi$ is elevated, the associated reduction in
 $\mathcal T_\mathrm{b}$ may also produce conditions in which englacial transport facilitates a transition from bulk melting to premelting conditions. More definitive statements are not justified by the current understanding of basal conditions, but these arguments suggest that further efforts to measure ice permeability at low liquid fractions and model englacial flow over impermeable beds may be illuminating, particularly when combined with predictions of large-scale subglacial drainage models that better constrain film region geometries and
 $\bar N_\phi$.
Discussion
The arguments presented above suggest that melt transport toward conduits requires premelting conditions to be pervasive where water films separate basal ice from permeable (often soft) beds, whereas bulk melting conditions are favored over impermeable (hard) beds where water transport is restricted to the films themselves. The potential for englacial transport through vein networks to reduce film water pressures so that premelting conditions prevail over impermeable beds is equivocal, with such flow paths expected to be more effective in this regard over film regions with smaller areas that drain meltwater to conduits at higher effective stresses. Several implications of these findings deserve brief further mention, including (i) the potential formation of basal crevasses and their role in regulating  $P$, (ii) the controls on the frictional strength of unconsolidated bedforms, (iii) the apparent degree of ‘connectedness’ between nearby boreholes, (iv) the thermal signatures of bed equilibrium states and (v) the contribution of film regions to basal drag.
Basal crevasses
Further consideration of cases with effectively impermeable basal ice sliding over completely impermeable beds suggests a different mechanism that may make it difficult to maintain the water pressures needed to balance the distribution of ice normal stresses (thereby achieving conditions for bulk melting). In particular, the elevated water pressures that are required in film regions governed by bulk melting conditions (c.f. their average in Eqn (8)) may cause fractures to form in the overlying ice that can respond to changes in the basal drainage system (e.g. Harper and others, Reference Harper, Bradford, Humphrey and Meierbachtol2010). Indirect evidence for such behavior has been detected in data from the Rhonegletscher, Switzerland, where Gajek and others (Reference Gajek, Gräff, Hellmann, Rempel and Walter2021) observed diurnal variations in shear-wave anisotropy during the melt season that are interpreted to reflect the dynamic response of englacial fractures to changing meltwater supply. Linear elastic fracture mechanics provides insight into conditions under which the expansion and contraction of basal cracks can regulate water pressures along the film interface. Allowing for the presence of favorably oriented (i.e. perpendicular to the minimum compressive stress  $\sigma_\mathrm{III}$) flaws of size
 $a$, crack propagation is expected when the stress intensity factor matches a critical value
 $K_c$. Adopting the formulation and parameter values from Ultee and others (Reference Ultee, Meyer and Minchew2020, c.f. their equation 29) suggests an upper limit on the difference
 $\Delta P$ between the basal water pressure
 $P$ and
 $\sigma_\mathrm{III}$ of approximately
 \begin{equation}\Delta P \approx \frac{K_\mathrm{c}}{1.12 \sqrt{\pi a}}\;,\end{equation}
where  $K_\mathrm{c}\approx 1.5\times 10^5\,$Pa m
 $^{1/2}$, so that with
 $a\approx 10^{-2}\,$m comparable to a typical basal grain size, this gives
 $\Delta P \approx 0.8\,$MPa. If
 $P$ reaches
 $\sigma_\mathrm{III}+\Delta P$, the length
 $a$ of an incipient crack is expected to grow and form a basal crevasse.
Along the basal interface, the maximum compressive stress might typically be associated with  $\sigma_n$, the average of which over film regions exceeds the ice overburden pressure by
 $\phi\bar N_\phi/(1-\phi)$ (c.f. Eqn (8) for
 $\bar P_\mathrm{f}$ governed by bulk melting). The minimum compressive stress is influenced by the details of the mechanical interactions of the glacier with its rough bed, leading to a high degree of variability, but
 $\sigma_\mathrm{III}$ is expected to be often similar to or even smaller than the ice overburden pressure. Transient MPa-level changes in
 $\bar N_\phi$ that are observed in boreholes and moulins imply changes in water pressure of comparable size under bulk melting conditions when films and conduits occupy similar fractional areas (i.e.
 $\phi/(1-\phi)$ of order unity). Hence, with
 $\Delta P$ for incipient flaws at the ice grain-scale comparable to transient changes in water pressure within films that are under bulk melting conditions, these simple considerations suggest that
 $P$ may undergo excursions that reach
 $\sigma_\mathrm{III}+\Delta P$, thereby extending crack length
 $a$ by hydrofracturing—especially during time periods when
 $\bar N_\phi$ is particularly elevated, and in locations where the drainage network occupies larger fractional areas
 $\phi$. Where such englacial fractures are well-developed, they are expected to dilate and contract in response to dynamic changes in meltwater supply (e.g. Gajek and others, Reference Gajek, Gräff, Hellmann, Rempel and Walter2021). These changes in englacial storage can buffer the basal liquid pressure so that it never exceeds
 $\sigma_\mathrm{III}+\Delta P$, which decreases for extended cracks and approaches
 $\sigma_\mathrm{III}$ when
 $a$ is large, causing
 $\Delta P$ to be negligible. With
 $P$ near extended (i.e. mature) cracks thereby tied to
 $\sigma_\mathrm{III}$, and
 $\sigma_n \gt \sigma_\mathrm{III}$, bulk melting conditions with
 $P=\sigma_n$ cannot be maintained. This suggests the possibility that in some regions bulk melting conditions may prevail during winters when englacial fractures are effectively sealed,
 $\bar N_\phi$ is reduced, and incipient flaws are small enough that
 $\sigma_n \lt \sigma_\mathrm{III}+\Delta P$, whereas changing stress conditions and elevated film-region water pressures that activate the englacial fracture system during the melt season may require a transition to premelting conditions. Note that qualitatively different behavior is expected in film regions characterized by high transmissivities
 $\mathcal T\gg \mathcal T_b$ so that the water pressure approaches values in adjacent conduits; in such locations, higher
 $\bar N_\phi$ corresponds with lower
 $\bar P_f$ so that the likelihood of hydrofracturing is reduced below that expected during low
 $\bar N_\phi$ time periods.
Unconsolidated bedforms
Geomorphological evidence for the prevalence of premelting conditions over soft glacial beds is hinted at by commonplace observations of meter-scale granular glacially sculpted bedforms. Interpretations for the genesis of such bedforms are varied, often complex, and sometimes contradictory, with significant postdepositional reworking common so that it can be difficult to discern the extent to which observed bedforms were actually present in regions that were separated from sliding ice by basal films (e.g. Hambrey and Glasser, Reference Hambrey and Glasser2012; Iverson and others, Reference Iverson2017). Unfortunately, remote sensing observations using radar (e.g. King and others, Reference King, Pritchard and Smith2016; Franke and others, Reference Franke2020) and seismic techniques (e.g. Riverman and others, Reference Riverman2019) are not yet able to reliably resolve and gauge the prevalence of subglacial features at the meter scale. Nevertheless, it is instructive to consider the shear strength that would be expected to characterize them. At the ice–bed interface in film regions that are under bulk melting conditions,  $\sigma_n-P=0$, whereas under premelting conditions
 $\sigma_n-P=P_\mathrm{T} \gt 0$. Neglecting cohesion and assuming liquid-saturated conditions, the frictional strength
 $\tau_f$ of a granular layer of thickness
 $h_g$ beneath the ice–bed contact can be estimated from
 \begin{equation}
\tau_\mathrm{f}\approx f\left(P_\mathrm{T} +\Delta \rho g h_\mathrm{g}\right)\;,\end{equation}
where  $f$ is the friction coefficient, the stress supported by sediment contacts immediately adjacent to the basal interface is identified with
 $P_\mathrm{T}$, and
 $\Delta \rho g$ is the difference between the weight density of the granular layer and the weight density of water; importantly, Eqn (17) treats vertical pore pressure gradients as hydrostatic, as expected for gradual melt rates with the dominant water flow running parallel to the bed. Adopting a nominal friction coefficient of
 $f=0.6$ and taking
 $\Delta \rho g\approx 8\times 10^3\,$Pa m
 $^{-1}$ (appropriate for granular particles with densities similar to common crustal minerals and a nominal porosity of 30%) leads to
 $\tau_f\approx 5\,$kPa when
 $h_\mathrm{g}=1\,$m and bulk melting conditions prevail so that
 $P_\mathrm{T}=0$. Median glacial driving stresses are an order of magnitude larger than this (Gärtner-Roer and others, Reference Gärtner-Roer, Naegeli, Huss, Knecht, Machguth and Zemp2014; Meyer and others, Reference Meyer, Downey and Rempel2018) implying that subglacial bedforms of this scale should be expected to form and persist only when basal drag is concentrated elsewhere (e.g. when granular bedforms are effectively shielded by bedrock obstacles), or when premelting enables
 $P_\mathrm{T} \gt 0$ to enhance granular strength. For example, when
 $\mathcal T\gg \mathcal T_\mathrm{b}$, Eqn (12) predicts that
 $\bar P_\mathrm{T}\approx \bar N_\phi/(1-\phi)$. In fact, more dramatic strengthening than predicted by Eqn (17) might be anticipated once
 $P_\mathrm{T}$ exceeds the threshold for ice to infiltrate the pore space and form a ‘frozen fringe’, with pore ice providing cohesion that can further augment
 $\tau_f$ (e.g. Rempel, Reference Rempel2008; Meyer and others, Reference Meyer, Schoof and Rempel2023). However, even at low melt rates, the ice-clogged pore space in fringes can reduce the effective permeability enough to cause significant deviations from the hydrostatic pressure profile assumed here, sometimes causing substantial internal strength decreases (Hansen and others, Reference Hansen, Warburton, Zoet, Meyer, Rempel and Stubblefield2024). The involvement of fringe thermomechanics in bedform evolution is the subject of ongoing investigation. Leaving such detailed considerations aside, the key point is that the inferred restriction against bulk melting conditions wherever meter-scale granular layers are present appears to be consistent with the mechanical requirements for nonzero
 $P_\mathrm{T}$ in contributing to the preservation of meter-scale granular bedforms.
Borehole connectivity
Borehole observations suggest varying degrees of hydraulic connectivity between different locations at the glacial bed. Sometimes connections are inferred to be very efficient, as liquid pressures in different boreholes track each other closely. However, more puzzling behavior is also seen in which there is essentially no correlation between the liquid pressures that are measured in nearby boreholes (e.g. Hoffman and others, Reference Hoffman2016; Rada and Schoof, Reference Rada and Schoof2018). Some of the differences between these well-connected and disconnected limits of borehole behavior might be traced to the properties of intervening film regions. For example, when the transmissivity at the bed  $\mathcal T\gg \mathcal T_\mathrm{b}$ so that premelting must take place, water pressure gradients in film regions are low. In the perfectly well-drained premelting end-member, the water pressure is effectively uniform so the average film pressure approaches the average conduit pressure at
 $\bar P_\mathrm{f} = \rho_\mathrm{i} g \bar H - \bar N_\phi$, while
 $\bar P_\mathrm{T}= \bar N_\phi/(1-\phi)$. The opposite end-member case, in which
 $\mathcal T=\mathcal T_\mathrm{b}$ and bulk melting conditions prevail, implies
 $\bar P_\mathrm{f} = \rho_\mathrm{i} g \bar H +\phi \bar N_\phi/(1-\phi)$ and
 $\bar P_\mathrm{T}=0$. It is easy to see how the well-drained limit would cause water pressures inferred from different nearby boreholes to track each other, with changing water pressures over film regions mirroring those within conduits because the intervening flow resistance is negligible. In contrast, when bulk melting conditions prevail, water pressures must rise in film regions as they fall in conduits in order to track the changes in normal stress that are necessary to support the glacial overburden without assistance from the direct ice–bed stress transfers that premelting conditions allow (i.e. finite
 $P_\mathrm{T} \gt 0$); anticorrelated pressure signals between film and conduit regions are supported by this dynamic. The idealized treatment considered here, with uniform
 $P_\phi$ on the boundaries of planar, circular film regions with uniform melt rate and transmissivity, is useful for delineating between thermomechanical regimes, but natural basal environments are much more complicated and the relationships between time series of pressure measurements in nearby boreholes display a correspondingly rich variety of behaviors with candidate explanations remaining a fruitful area of ongoing research.
Basal thermal transients
It should be possible to use precise borehole temperature measurements to distinguish between cases in which basal films are subject to premelting and those in which bulk melting conditions prevail. In boreholes that are open to the subglacial drainage network, the phase equilibrium considerations described by Eqn (1) indicate that bulk equilibrium conditions are expected since borehole walls are sufficiently distant from each other that  $P_\mathrm{T}\approx 0$. However, when temperature measurements are made in a collapsed borehole that terminates just above the bed, the local thermal regime should reflect the in situ average basal temperature as the probe is carried by the sliding ice to sample a mixture of film and conduit regions. In cases where bulk melting prevails over the entire basal interface,
 $P_\mathrm{T}=0$ and the average bulk melting temperature can be estimated from Eqn (1) using the weighted sum of the temperature over conduits and the temperature corresponding with the average fluid pressure in films so that with the reference pressure chosen as
 $P_0=\rho_i g \bar H$ one arrives at
 $T_\mathrm{eq}\approx T_0$. In contrast, when premelting takes place along basal films and the transmissivity is sufficiently large that well-drained conditions can be assumed with the liquid pressure spatially uniform, the same weighting procedure leads to
 \begin{equation}
T_\mathrm{eq}\approx T_0\left(1-\frac{\bar N_\phi}{\rho_\mathrm{l}\mathcal L} \right)\;.\end{equation}
The clear implication is that whereas when bulk melting conditions prevail the average basal temperature is expected to depend only on the glacier overburden pressure, when premelting takes place over film regions the average basal temperature is reduced slightly by an amount that depends on the average effective stress in conduits. For intuition, inserting values of  $\rho_\mathrm{l}$ and
 $\mathcal L$ from Table 1, Eqn (18) predicts that the equilibrium temperature is lowered from
 $T_0$ by approximately
 $0.08^\circ$C when
 $\bar N_\phi=10^5\,$Pa.
Measured borehole temperature offsets from local values of the bulk melting temperature  $T_0$ from McDowell and others (Reference McDowell, Humphrey, Harper and Meierbachtol2021) extrapolated to the bed of Issunguata Sermia (red ‘x’ in Fig. 2). Time series are shown with symbols for seven of the nine boreholes. Data from boreholes 14W and 15N were reported as single measurements that are displayed here using short dotted lines toward the right. Median temperature values extracted from the other seven borehole time series are labeled and plotted toward the right as well.

Figure 5 Long description
The scatter plot displays temperature offsets labeled as T subscript eq minus T superscript 0 in degrees Celsius on the vertical axis, ranging from negative 0.5 to positive 0.1. The horizontal axis represents days since January 1, 2014, extending from 600 to 1400 days. Borehole data series are plotted with different symbols and colors, each labeled with medians. Boreholes include 15CB, 14W, 14N, 15S, 15N, 14SA, 15CA, 14SB and 15E. Most series appear as horizontal bands, indicating stable offsets over time, with borehole 15E showing the lowest offset at negative 0.4 degrees Celsius. Despite a few positive values, the highest median, for borehole 15CB is zero celsius and all other medians are negative. Dense clusters are visible around 800 to 1000 days, particularly for boreholes 14SA and 15CA. Symbols and colors are used to differentiate boreholes, with triangles, diamonds and circles representing specific boreholes. The plot illustrates variations in temperature offsets across different boreholes over the specified time period, with some boreholes showing more stability than others.
It is technically challenging to measure temperatures at the required resolution and accuracy to distinguish between bulk melting and premelting conditions, but some relevant field evidence has been reported. Thermal signatures interpreted to represent the healing of basal crevasses were described by McDowell and others (Reference McDowell, Humphrey, Harper and Meierbachtol2021), who collected temperature records at 10 m depth intervals with an estimated resolution of 0.1 $^\circ$C from nine boreholes drilled through a primarily hard-bedded region (Harper and others, Reference Harper, Humphrey, Meierbachtol, Graly and Fischer2017) of Issunguata Sermia, in the Kangerlussuaq sector of Greenland (red ‘x’ in Fig. 2). Our attention is drawn to their bottom-most temperature sensors, all of which were calibrated based on data collected during borehole closure that are interpreted to represent the bulk melting temperature at each sensor’s location. Figure 5 was constructed using the two lowest temperature sensors in each of these boreholes to extrapolate to conditions at the bed; median temperature values obtained from the reported record for each borehole are shown and labeled on the right side of the figure. Five of the nine locations are found to be within 0.2
 $^\circ$C of the bulk melting temperature, which might be considered close enough to the 0.1
 $^\circ$C reported resolution of the temperature records to be consistent with bulk melting conditions. Time series from the remaining four boreholes imply that basal temperatures were nearly constant over the duration of each record, with median values in the different boreholes ranging between 0.2 and 0.4
 $^\circ$C colder than the bulk melting temperature, which is consistent with the offset predicted by Eqn (18) for the well-drained limit if the average effective stress in conduits ranged between approximately 0.2 and 0.4 MPa. Taken together, these thermal signatures appear to reflect a mixture of bulk melting and premelting film regions in a hard-bedded area that is subject to active basal crevassing.
Basal drag
Considerable effort has gone toward developing accurate parameterizations and a more complete understanding of the physical mechanisms that control the relationship between slip rates and basal shear stresses while accounting for the influence of basal water pressures (e.g. Schoof, Reference Schoof2005; Cuffey and Paterson, Reference Cuffey and Paterson2010; Zoet and Iverson, Reference Zoet and Iverson2020; Hansen and others, Reference Hansen, Warburton, Zoet, Meyer, Rempel and Stubblefield2024). As noted earlier, beneath film regions the strength of unconsolidated bedforms is expected to depend on the thermomolecular pressure (c.f. Eqn 17), and hence so does the ability of these obstacles to contribute toward basal drag as ice deforms around them or regelates through them. More generally, water pressures are expected to influence the strength of frictional contacts between entrained debris and underlying bed materials, whether the slip surface is soft or hard. In early work, Boulton (Reference Boulton1974) applied the Terzaghi effective stress principle (Terzaghi, Reference Terzaghi1943) to relate the frictional resistance during sliding with the difference between  $\sigma_n$ and
 $P$. As Terzaghi recognized, abundant experimental and field evidence supports the intuition that in the absence of large vertical liquid pressure gradients, since the net load supported at contacts between sliding materials is given by
 $\sigma_n-P$, the sliding resistance imparted over the debris–bed contact area is
 $f(\sigma_n-P)=f\,P_{\mathrm T}$ for friction coefficient
 $f$. Under well-drained premelting conditions, since
 $\bar P_\mathrm{T}\approx \bar N_\phi/(1-\phi)$ the average frictional strength of debris–bed contacts in film regions is expected to be proportional to the effective stress in surrounding conduits—extending somewhat higher as
 $\phi$ increases and the fraction of bed area covered by film regions shrinks.
When bulk melting takes place in film regions, as is expected to be common over hard beds that are often marked by striations,  $P_\mathrm{T}=\sigma_n-P$ vanishes so the controls on frictional resistance must be reconsidered. Hallet (Reference Hallet1979) argued that debris–bed contact strength is enhanced by the effects of drag around entrained obstacles during the bed-perpendicular ice flow that is necessitated by melting. However, results from recent laboratory experiments (Hansen and Zoet, Reference Hansen and Zoet2019; Thompson and others, Reference Thompson, Iverson and Zoet2020; Brooks and others, Reference Brooks2025) appear to be more consistent with an alternative interpretation in which the drag from ice deformation is not directly implicated. Instead, as bed-perpendicular ice flow encounters water films over entrained debris, elevated water pressures are required to drive meltwater transport around particle surfaces to adjacent basal films, thereby producing large non-hydrostatic pressure gradients that violate the assumptions behind the Terzaghi effective stress principle, and generating the net contact forces that govern friction (Emerson and Rempel, Reference Emerson and Rempel2007). Note that this dynamic implies a dependence between contact forces and sliding speed when glacier flow causes entrained debris to impinge upon bed irregularities, and that local frictional heating may result in significant spatial variations in melt rate, which have been ignored by the idealized treatment of film-region water flow examined here.
A further possibility, that  $P$ can be equated neither with the water pressures in surrounding conduits nor with local ice normal stresses, but instead is regulated by extended basal crevasses and their connection to the minimum compressive stress
 $\sigma_\mathrm{III}$, would be expected to result in frictional resistance that depends on
 $\bar P_\mathrm{T}\approx\sigma_n-\sigma_\mathrm{III}= \rho_\mathrm{i} g \bar H+\phi \bar N_\phi/(1-\phi) - \sigma_\mathrm{III}$. As for the bulk melting case, when local melt rates are sufficient to produce significant bed-perpendicular liquid pressure gradients, the local frictional resistance is expected to be elevated above
 $f\,P_{\mathrm T}$.
Each of these frictional regimes is associated with a particular capacity for melt extraction, with clear implications for film conditions that result, whether well drained and premelting, undrained and bulk melting, or crevasse buffered and premelting. Amongst them, the well-drained premelting case arguably has the most straightforward implications for inclusion in simulations of glacier and ice-sheet dynamics that couple drainage model outputs with ice flow treatments since: (i) even obstacles on soft beds are expected to typically remain stronger than the shear stresses exerted by overriding ice and hence contribute to basal drag, and (ii) the frictional resistance from entrained debris is expected to be approximately proportional to the conduit effective stress that emerges from drainage model treatments. Spatial and temporal transitions away from this regime can be expected to result in changes to the sliding law, however, that deserve further consideration as coupled treatments continue to evolve and improve.
Conclusions
Models of basal drainage are designed to capture water-pressure distributions in the conduit networks that dominate the subglacial flux. Flow of locally generated melt into conduits through thin films that disjoin glacier ice from the remainder of the bed determines the distribution of water pressures over these extensive film regions.
Analysis of film-region transport requirements suggests that well-drained, premelting conditions are likely to be common, for example beneath the Greenland Ice Sheet, wherever till approaches meter-scale thicknesses, enabling seepage flows to operate effectively while water-pressure gradients remain small. As a result, film water pressures are expected to closely track water pressures in nearby conduits, leaving a portion of the overburden stress to be supported by the net thermomolecular pressure  $P_\mathrm{T}$ that results from intermolecular interactions between ice and bed materials across very thin premelted films. The increased thermomolecular pressures that must accompany increases in conduit effective stress are expected to enhance the frictional strength both of granular bed forms, enabling ice deformation around these roughness elements to contribute toward basal drag, and the contacts between entrained clasts and the stationary bed, producing a direct dependence between the contribution to sliding resistance from debris–bed contacts and the conduit effective stresses predicted by drainage models. The relatively large variations in basal temperature (c.f. Eqn (1)) that accompany changes in
 $P_\mathrm{T}$ may play an important role in the incorporation of diffuse debris concentrations that are common in basal ice (e.g. Rempel and others, Reference Rempel, Meyer and Riverman2021).
Over hard-bedded, impermeable regions, where melt transport is constrained to the thin films themselves, an undrained limit is attained in which water pressures must match elevated ice normal stresses so that the overburden stress at the bed is completely supported by pressurized water. This is a hallmark of bulk melting conditions, in which film-region equilibrium temperatures are slightly warmer and much less sensitive to conduit pressure variations than those in premelting regions subject to the same ice normal stresses.
For particularly small film regions over impermeable bed materials that are adjacent to conduits at high effective stress, englacial transport through the networks of veins that line grain edges in polycrystalline ice might sometimes be sufficient to produce well-drained premelting conditions. However, when vein transport over impermeable hard-bedded regions is ineffective, high conduit effective stresses can raise film water pressures enough to drive hydrofracturing and lead to the formation of basal crevasses that subsequently buffer film water pressures at values close to the minimum compressive stress in the overlying ice.
Whether they approach conduit water pressures, match ice-normal stresses or fall somewhere in between, film water pressures are expected to exert significant control on the drag that results from frictional contacts. In circumstances where these debris–bed contacts are responsible for a significant fraction of the overall basal drag, the changes in contact strength that occur with spatial and temporal variations in bed properties, drainage configuration, and conduit effective stress can result in significant changes to the ‘sliding law’ beyond those resulting from the compressive normal stresses that ice exerts against the upstream sides of bed obstacles. These changes are predictable and ultimately deserve consideration in future coupled basal drainage and ice dynamics treatments.
Acknowledgements
An earlier version of this manuscript benefitted from feedback from Christian Helanow, Neal Iverson, Colin Meyer and Luke Zoet, and financial support from NSF-1603907. I am grateful as well to Ian McDowell, who promptly and helpfully answered questions about the high-resolution temperature records he analyzed for his MSc thesis and published in McDowell and others (Reference McDowell, Humphrey, Harper and Meierbachtol2021), a subset of which is reproduced here in Fig. 5. Two anonymous referees and scientific editor, Michelle Koutnik, provided constructive criticism that has improved this presentation.
Appendix
In the idealized treatment of film-region flow used to define  $\mathcal T_\mathrm{b}$ and delineate between the different film-region pressure regimes, the effects of basal topography on the hydraulic potential were neglected. To gauge the validity of this assumption, here we modify the mass conservation condition from Eqn (9) to include the effects of gravity so that
 \begin{equation}
\nabla \cdot \left[\mathcal T \left(\nabla P+\rho_\mathrm{l} g \nabla z_b\right)\right]+\rho_\mathrm{i} g \dot m=0\;,\end{equation}
where  $z_\mathrm{b}$ is the bed elevation. Continuing to treat the transmissivity
 $\mathcal T$ as uniform, the size of the gravitational term can be compared with the size of the melt source term to find that neglect of elevation changes is strictly justified when
 \begin{equation}\left|\rho_\mathrm{l} g\mathcal T \nabla^2 z_\mathrm{b}\right| \ll \left|\rho_\mathrm{i}g\dot m\right|\;.\end{equation}
For example, elevation changes from a constant reference level (without loss of generality taken as zero) along an idealized sinusoidal bed with bumps of amplitude  $z_\mathrm{max}$ separated by wavelength
 $\lambda$ can be represented by
 $z_\mathrm{b}=z_\mathrm{max} \sin(2\pi x/\lambda)$, so that
 $\nabla^2 z_\mathrm{b}=-(4\pi^2 z_\mathrm{max}/\lambda^2)\sin(2\pi x/\lambda)$, which is bounded by
 $|\nabla^2z_\mathrm{b}|\le4\pi^2 z_\mathrm{max}/\lambda^2$. Inserted into Eqn (A.2) and rearranging, in this geometry the gravitational term is strictly negligible for wavelengths of
 \begin{equation}\lambda\gg \lambda_\mathrm{min}=2\pi \sqrt{\frac{\rho_\mathrm{l}\mathcal Tz_\mathrm{max}}{\rho_\mathrm{i}\dot m}}\;.\end{equation}
Our primary interest is in estimating the scale of transmissivity that bed materials must exceed to transition from bulk melting to premelting behaviors. Accordingly, using Eqn (11) to set  $\mathcal T=\mathcal T_\mathrm{b}$ and evaluating the inequality for circumstances in which bulk melting conditions hold, the neglect of gravitational effects on film flow is justified when topographic variations satisfy
 \begin{equation}\lambda \gg \lambda_\mathrm{min}=\sqrt{\frac{\pi\rho_\mathrm{l} g A_\mathrm{f}\left(1-\phi\right)z_\mathrm{max}}{2\bar N_\phi}}\;.\end{equation}
For example, with the nominal parameter choice of  $\bar N_\phi/[A_\mathrm{f}(1-\phi)]=10^3\,$Pa m
 $^{-2}$ and
 $\rho_\mathrm{l} g\approx 10^4\,$Pa m
 $^{-1}$, this reduces to
 $\lambda \gg \sqrt{(5\pi\,\mathrm{m})z_\mathrm{max}}$. Larger values of
 $\bar N_\phi/[A_f(1-\phi)]$ facilitate neglect of topographic changes that have correspondingly shorter wavelengths, as shown in Fig. A1. These simple arguments suggest that basal topography is likely to have a negligible effect on the transmissivity
 $\mathcal T_\mathrm{b}$ that is associated with the transition between bulk melting and premelting behavior as long as the bed roughness is sufficiently muted, as gauged here by the relationship between
 $\lambda_\mathrm{min}$ and
 $z_\mathrm{max}$. Under premelting conditions with
 $\mathcal T\gg \mathcal T_\mathrm{b}$, however, the distribution of film water pressures are more prone to the effects of topography, which should be incorporated into more detailed treatments aimed at evaluating film-region water pressures in specific settings.
Minimum wavelength  $\lambda_\mathrm{min}$ from Eqn (A.4) required to justify neglect of sinusoidal topographic changes of amplitude
 $z_\mathrm{max}$ in affecting film flow when
 $\mathcal T=\mathcal T_\mathrm{b}$ for the values of parameter ratio
 $\bar N_\phi/[A_\mathrm{f}(1-\phi)]$ shown in the legend (the heavy black curve depicts the relationship for the nominal value of
 $10^3\,$Pa m
 $^{-2}$).


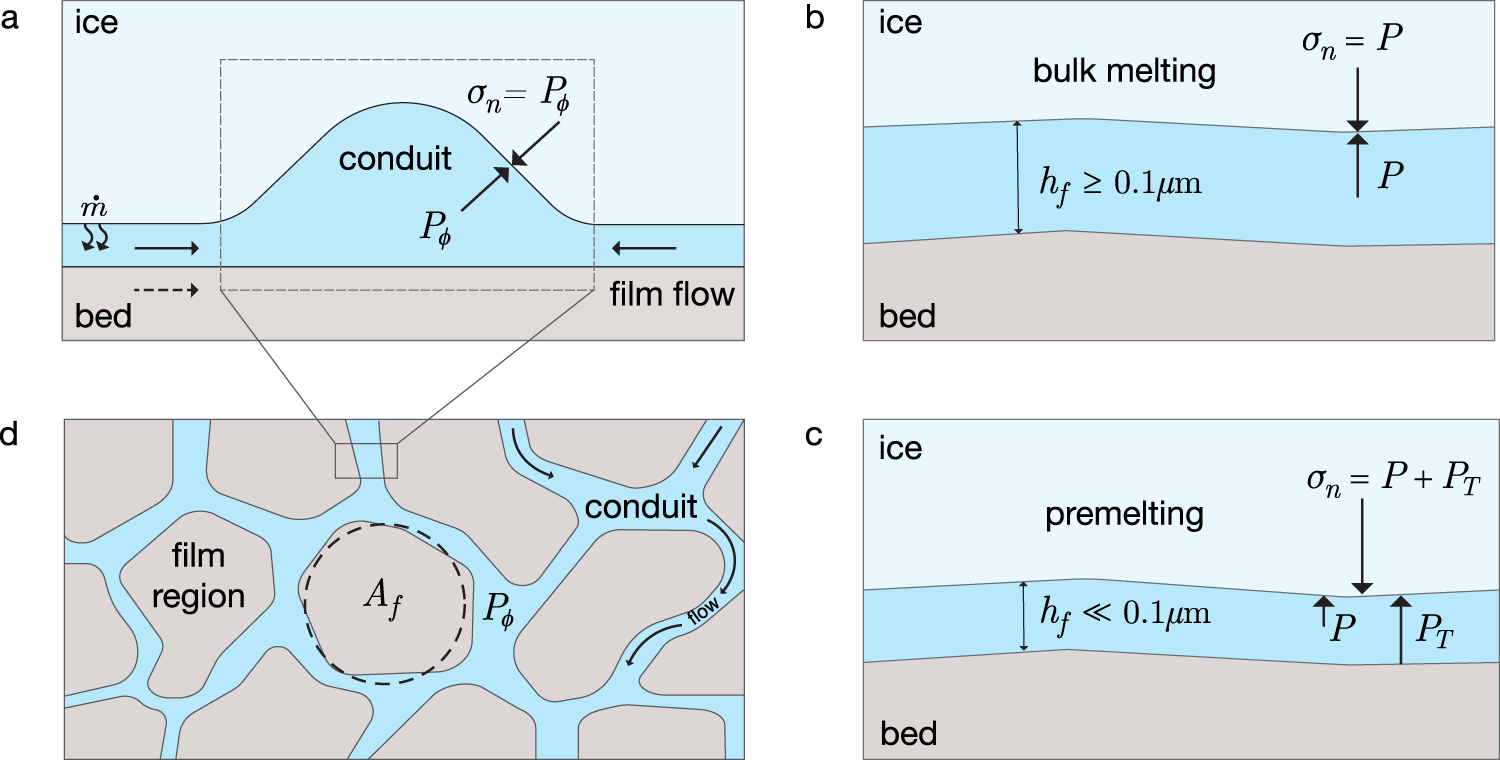


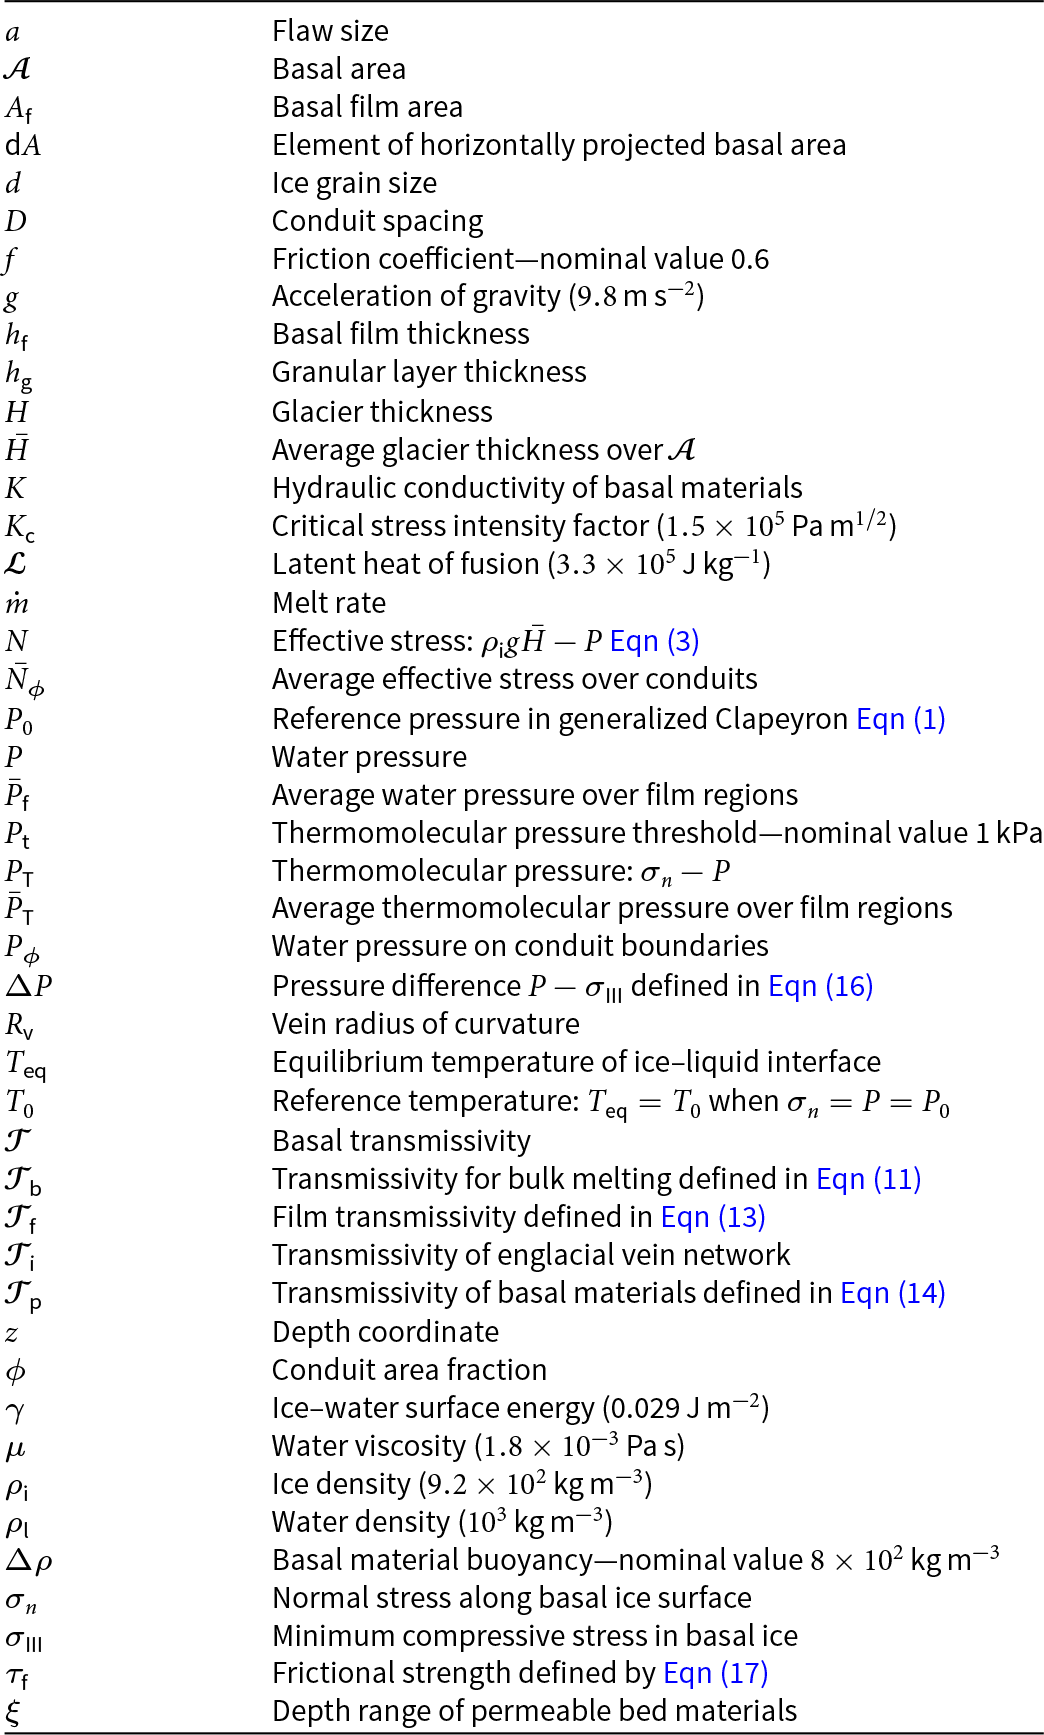
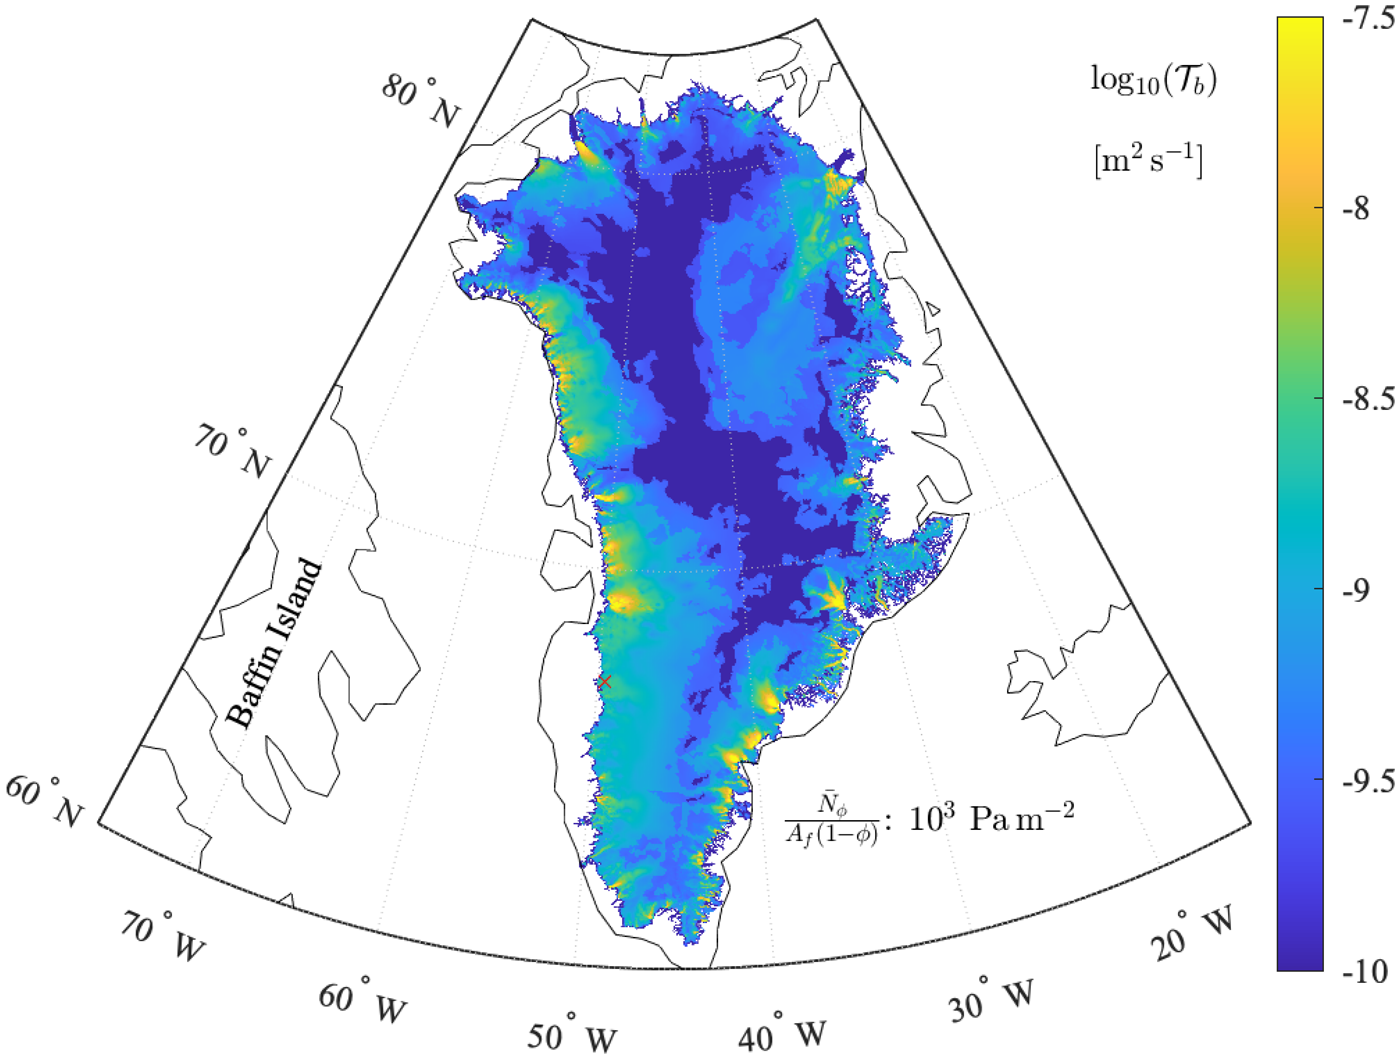


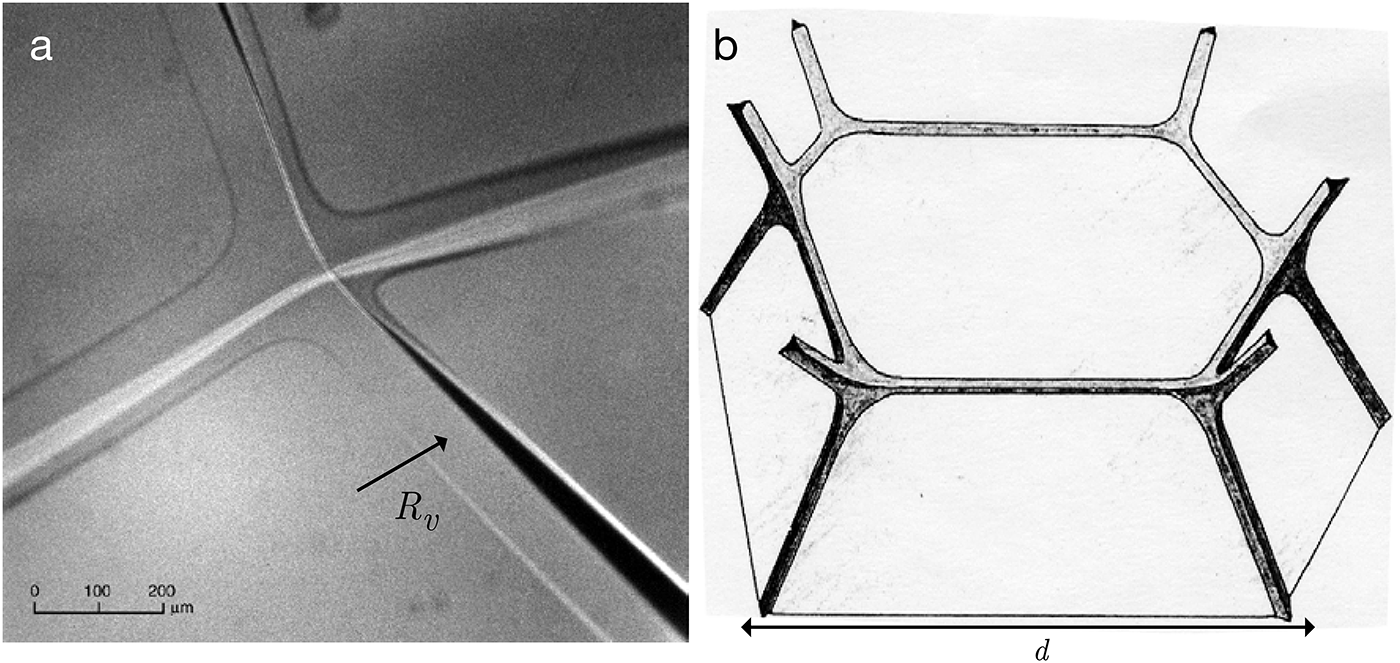


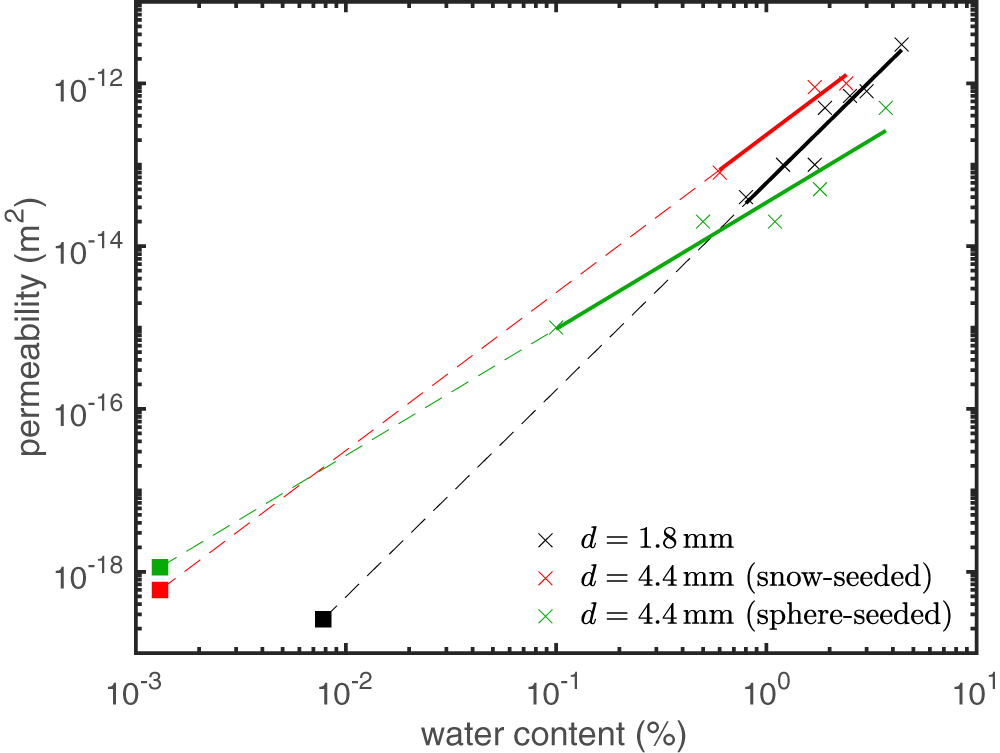

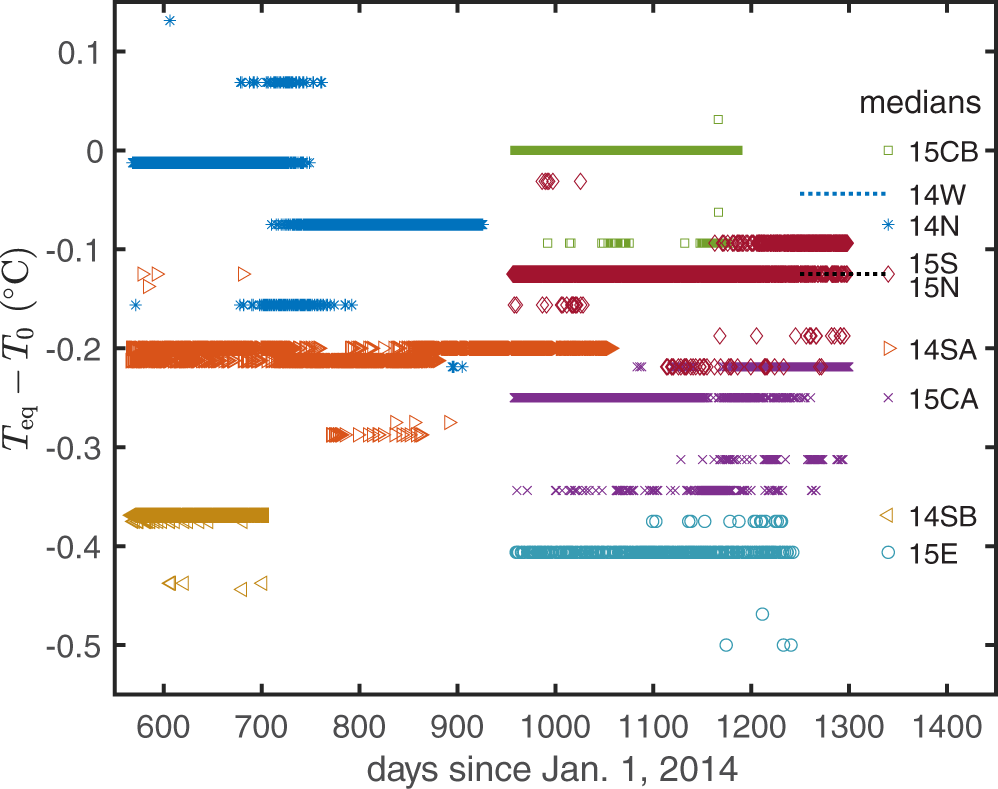


 Open access

