Introduction
Genetic diversity is the raw material on which selection acts. High genetic diversity may allow populations to adapt to changes in the environment (Coyne & Orr, Reference Coyne and Orr2004). Low genetic diversity (e.g. reflecting inbreeding), in contrast, may increase the probability of extinction of local populations in a fluctuating environment (e.g. Saccheri et al., Reference Saccheri, Kuussaari, Kankare, Vikman, Fortelius and Hanski1998 in the case of Glanville fritillary butterflies, Melitaea cinxia L.). The amount of genetic diversity in a population results from the balance between the gain and loss of allelic variants. Increases in the genetic diversity of a population can come from the creation of new alleles by mutation and from immigration of individuals bearing different alleles. In addition, sexual reproduction results in the production of new genotypes through the mixing of existing genotypes and recombination, including crossing-over. Loss of genetic diversity arises from the action of natural selection, random genetic drift and emigration.
Cyclically parthenogenetic organisms represent a special case in which genetic diversity is predicted to follow a seasonal pattern. In these organisms, a single sexual generation alternates with many asexual generations (Simon et al., Reference Simon, Rispe and Sunnucks2002). Asexual females give birth to essentially genetically identical daughters, excepting mutations or rare chromosomal rearrangements (Lushai et al., Reference Lushai, De Barro, David, Sherratt and Maclean1998; Loxdale & Lushai, Reference Loxdale and Lushai2003; Vorwerk & Forneck, Reference Vorwerk and Forneck2007). Thus, in parthenogenetic organisms, the highest genetic diversity is present directly after sexual reproduction. Genetic diversity is predicted to decrease over periods of asexual reproduction due to the action of clonal competition/selection and genetic drift. Clonal competition occurs when genotypes with higher reproductive success out-compete those with lower success, selection when a particular genotype is more or less favoured than another.
Aphids (Hemiptera: Aphididae), which mostly show cyclical parthenogenesis (Blackman Reference Blackman, Blackman, Hewitt and Ashburner1980; Blackman & Eastop, Reference Blackman and Eastop2000; Dixon, Reference Dixon1998; Loxdale & Lushai, Reference Loxdale, Lushai, van Emden and Harrington2007), are essentially terrestrial organisms (except for their aerial dispersal phase) with a single sexual generation per year such that sexual and asexual reproduction are usually clearly separated temporally (except for some asexual overwintering in mild winters or certain obligate asexual species and/or lifecycle morphs; see below and Loxdale & Lushai, Reference Loxdale, Lushai, van Emden and Harrington2007). Sexual reproduction usually takes place in the autumn when there is a short photoperiod and temperatures are low (Dixon, Reference Dixon1998). Diapausing cold hardy eggs (Bale et al., Reference Bale, Ponder, Pritchard, van Emden and Harrington2007) hatch obligatorily in the following year. Thus, genetic diversity in aphids should be highest after egg hatch in spring, and should decrease over the time course of the season, i.e. with the successive number of asexual generations. Field studies have shown that genetic diversity significantly decreased from spring to summer in S. avenae (De Barro et al., Reference De Barro, Sherratt, Carvalho, Nicol, Iyengar and Maclean1994, Reference De Barro, Sherratt, Carvalho, Nicol, Iyengar and Maclean1995a; Sunnucks et al., Reference Sunnucks, De Barro, Lushai, MacLean and Hales1997). Similarly, Fuller et al. (Reference Fuller, Chavigny, Lapchin and Vanlerberghe-Massuti1999) showed that there was a decrease in clonal diversity of greenhouse populations of the obligatorily asexual cotton-melon aphid, Aphis gossypii (Glover), over the course of the season and suggested that the ultimate dominance of a small subset of microsatellite multilocus genotypes (MLGs=‘clones’) was due to clonal competition. Haack et al. (Reference Haack, Simon, Gauthier, Plantegenest and Dedryver2000) showed that, for two consecutive years, two clones of S. avenae (also determined as microsatellite MLGs) were predominant as asexual generalists on maize and suggested that these clones were favoured by agricultural practices.
However, at the spatial level where aphids interact, i.e. the aphid colony, very few studies have investigated within-season temporal changes of genetic diversity of cyclic parthenogens, although several studies have examined temporal changes in predominantly obligate asexual populations of the Peach-potato aphid, Myzus persicae (Sulzer), both in the UK (e.g. Foster et al., Reference Foster, Harrington, Dewar, Denholm and Devonshire2002; Fenton et al., Reference Fenton, Malloch, Woodford, Foster, Anstead, Denholm, King and Pickup2005; Kasprowicz et al., Reference Kasprowicz, Malloch, Pickup and Fenton2008) and in Australia (Vorburger, Reference Vorburger2006). In these studies, weather and host plant factors are considered as possible causative selective agents in observed changes of genotype frequency, including changes of strains resistant to one or more insecticide and in relation to various resistance mechanisms (reviewed by Fenton et al., Reference Fenton, Margaritopoulos, Malloch and Foster2010). Other studies have provided clear evidence for clonal selection in aphids too, especially in cereal aphids of the genus Sitobion Mordvilko (e.g. Loxdale & Brookes, Reference Loxdale and Brookes1990; Sunnucks et al., Reference Sunnucks, Chisholm, Turak and Hales1998; Wilson et al., Reference Wilson, Sunnucks and Hales1999; Llewellyn et al., Reference Llewellyn, Loxdale, Harrington, Clark and Sunnucks2004), as observed using allozyme, microsatellite and chromosomal markers, and again seemingly predominantly related to climatic and host plant factors.
An aphid colony can be defined as a group of individuals feeding together at the same plant location. Often, but not always, all aphids on a plant or, in the case of clonal plants, on a particular ramet (=shoot), are thought to form a single colony. Competition for resources among clonal lineages takes place at this micro-spatial level. In addition, sexual individuals mate within colonies. Thus, the genetic diversity within colonies at the end of the season will have a profound influence on the degree of inbreeding. Because aphids have high rates of reproduction that differ between clonal genotypes (Simon et al., Reference Simon, Dedryver, Pierre, Tanguy and Wegorek1991), a fast decrease in the genetic diversity within colonies over the season is expected. This decrease in diversity can only be counteracted by immigration of genetically distinct individuals from other plants. In aphids, most individuals are wingless and, hence, unable to migrate except over relatively short distances (e.g. Harrington & Taylor, Reference Harrington and Taylor1990; Lombaert et al., Reference Lombaert, Boll and Lapchin2006). Winged individuals are produced in response to a number of environmental cues and are mainly responsible for the colonisation of new plants (Dixon, Reference Dixon1998; Weisser et al., Reference Weisser, Braendle and Minoretti1999). While winged individuals can occur in large numbers at some times during the season, little is known about mixing of genotypes in newly founded colonies or immigration of winged morphs into already existing colonies.
The tansy aphid, Macrosiphoniella tanacetaria (Kaltenbach), is a cyclically parthenogenetic aphid species, monophagous on tansy (Tanacetum vulgare L.), a perennial composite with bright yellow flowers that grows along roadsides and in wastelands, especially along river valleys, seemingly preferring poor, well-drained soils (Heie, Reference Heie1980–95; Wagenitz, Reference Wagenitz1987). Each tansy plant (=genet) exhibits clonal growth producing many ramets. There are often several genets at a given site, and sites tend to be separated from each other by habitat that does not support tansy. Winged sexual males and wingless sexual females (oviparae) of M. tanacetaria are produced in autumn. After mating, sexual females lay overwintering eggs on the decaying tansy or nearby vegetation. In spring, tansy starts to produce new shoots. Aphid eggs hatch and the asexual stem mothers (=the fundatrices (singular=fundatrix) or first asexual individuals in given clonal lineages) feed on the new shoots. These lineages will then continue to reproduce parthenogenetically until the autumn. Population genetic studies of M. tanacetaria using microsatellites have shown that both allelic and genotypic variability is high at the beginning of the season and that the species displays a metapopulation structure (Massonnet et al., Reference Massonnet, Simon and Weisser2002; Massonnet & Weisser, Reference Massonnet and Weisser2004). In spring populations, there was often a deficit of heterozygotes, possibly due to inbreeding in the earlier sexual generation. A preliminary study showed that, when two individuals from the same ramet were analysed, individuals had a different genotype in 82% of the comparisons (N=23: Massonnet et al., Reference Massonnet, Leterme, Simon, Weisser, Simon, Dedryver, Rispe and Hullé2004).
The aim of the present study was to investigate changes of genetic diversity in colonies of M. tanacetaria in one region over a single growing season. Colonies were sampled four times during the season, and several aphids per colony were genotyped using polymorphic microsatellite markers. In addition, the seasonal patterns of aphid colony sizes and the occurrence of winged individuals in the field was investigated. In this study, we specifically addressed the following questions: (i) What are the patterns of dispersal in M. tanacetaria? (ii) Are all individuals in an aphid colony genetically identical at a range of loci at any time of the season? (iii) Is there a decrease in the number of genotypes (MLGs) in colonies throughout the season? (iv) Are winged individuals related to the wingless individuals within a colony? The study was performed over two successive years; a molecular genetic study in one year followed by an ecological study the year following. We begin by first describing the ecological study.
Materials and methods
Field survey
Four sites (D, J, T and V) in an area of ∼15 km2 located near Jena town centre, Germany (N50.92°, E11.59°), where sexual individuals were observed in autumn 2000 were chosen for the field study (fig. 1). We labelled 126 tansy genets and visited them weekly. The study started in the week beginning 25th April–1st May, 2001 (week 1) when the first stem mothers were observed and continued until the last sexual individuals died in the week 29th November–5th December, 2001 (week 27). The sites were surveyed on Wednesday and Thursday each week, except for the period from the beginning of November to the beginning of December when plants were checked only every ten days because the development of aphids was slowed by cooler temperatures.
Sites in Jena for seasonally-collected M. tanacetaria samples. Sites D, J, T, and V – 2001 ecological study; ●, sites for 2000 molecular genetic study and including the four 2001 sites; RL, railways lines; RS, River Saale; other lines, roads; darker grey areas, woodlands.

As the aim of this study was to determine the fate of aphid colonies in a non-invasive approach (Addicott, Reference Addicott1978), no aphids were collected at the field sites. The following data were recorded each week:
(i) Number of aphid colonies on a genet.
(ii) Colony size. A colony is here defined as all individuals on a given ramet. Usually this comprised a dense aggregation of aphids, founded by one or a few fundatrices in the spring (arising from eggs laid the previous autumn) on the new growth (leaves and later flowers) of the developing tansy plant. Aphids were counted without disturbance and the following size classes were distinguished: 1, 2–5, 6–10, 11–20, 21–50, 51–100, 101–200, >201. For some analyses, the data were summarised into three categories: ‘small’ (1–10 aphids), ‘medium’ (11–50), and ‘large’ (>50) colonies.
(iii) Number of winged individuals in the colony. Here, we counted both adults and fourth instar nymphs of winged morphs. Fourth instar nymphs of asexual winged females can be easily identified by eye because of the presence of wing buds. In the sexual generation, only the males are winged and fourth instar males can also be easily recognized. The following classes were distinguished: 0, 1, 2–5, 6–10, 11–15, 16–20, >21 winged individuals.
Mean aphid colony size was calculated in three ways: either by taking the lower class limit, the mean of the lower and upper class limit, or the upper class limit (e.g. for the 21–50 aphids class, the three values were 21, 36 and 50). For the class >201 aphids, the upper limit was set arbitrarily at 400 aphids. For colonies that had winged individuals, we calculated the proportion of these in two ways: a minimum proportion was calculated as the ratio of the lower class limit of the number of winged individuals to the upper class limit of the colony size class. Similarly, a maximum proportion of winged individuals was calculated as the ratio of the upper class limit of the number of winged individual to the lower class limit of the colony size class.
To statistically test for significant differences between cohorts, ANOVA was performed in SPSS 15.0 for Windows.
Aphid colony sampling for genetic analysis
Temporal genetic sampling of aphid colonies was performed in the year preceding the detailed field study described above (i.e. 2000) and was based on the results from preliminary studies of the population dynamics of M. tanacetaria and observations of colonies over the season (Massonnet, Reference Massonnet2002). Sampling of aphid colonies was performed in an area of ∼40 km2 in and around Jena town centre at four different sampling dates: June, a few weeks after egg hatch (14 June, 48 colonies); July, when the number of aphid colonies started to decrease (31 July, 48 colonies); September, when aphid density was low (10 September, 45 colonies); and October, when aphid density increased again and when colonies were mostly composed of sexual individuals (17 October, 46 colonies).
At each sampling date, host plants at 21 sites were visited, including D, J, T and V, and aphid colonies randomly collected from different genets/ramets (fig. 1). For the purpose of the study, we aimed to collect aphid colonies with at least four adult aphids per plant. Aside from this criterion, collection was independent of size. However, in July and September, aphid density was low and for these two sampling dates, colonies with less than four adult aphids were also collected. At a given site, no more than seven aphid colonies were collected and on average 3.3 aphid colonies were collected per site.
Complete colonies were sampled by quickly and gently introducing the plant tissue on which aphids were feeding into a large plastic tube and then cutting the plant stem with scissors. In the laboratory, aphids were gently removed from the plant tissue with a paint brush and preserved in 100% ethanol at ∼4°C prior to DNA extraction.
Total colony size was assessed under the microscope. Winged individuals, adults and fourth instar nymphs were counted separately.
For the October sampling, adults of 37 additional aphid colonies were collected to assess whether adult females were asexual (with embryos) or sexual (with eggs).
DNA analyses
Aphid samples, DNA extraction and microsatellites
Four randomly chosen adult wingless females were genotyped per colony. In some colonies, the number of wingless adults was lower than four; therefore, we included wingless fourth instar nymphs in the analyses whenever possible. The remaining offspring (first to third instar nymphs) were too small for reliable DNA extraction. In addition, four winged adults were genotyped. In case the number of winged adults was lower than four, all available individuals were genotyped. No fourth instar nymphs with wing buds were genotyped since they were likely to be born in the colony in which they were found. Thus, up to eight individuals were genotyped per colony.
In total, DNA was extracted from 477 individual aphids following the salting-out method of Sunnucks & Hales (Reference Sunnucks and Hales1996). Amplifications of three polymorphic microsatellites (Mt-4, Mt-6 and Mt-7) followed the procedure of Massonnet et al. (Reference Massonnet, Leterme, Simon and Weisser2001). Routine genotyping was performed using a Li-Cor 4200 sequencer to detect fluorescently-labelled PCR fragments (MWG Biotech, Germany). Of the samples extracted, 451 were successfully scored for MLGs and analysed for relatedness and deviations from Hardy-Weinberg equilibrium (HWE), etc. at the three chosen loci (see Results). Randomised combination of these particular microsatellites provided about 80% of the total population variance (see fig. 6 in Massonnet et al., Reference Massonnet, Simon and Weisser2002). Moreover, in order to infer the likelihood that two aphids share a given MLG by chance, we simulated 10,000 samples of the 451 MLGs based on observed allele frequencies under the assumption of unlinked loci and panmixia. Under these conditions, only ∼3.5% (i.e. about 16 per 451 drawn) of the individuals are expected to share MLGs by chance alone.
Calculation of genetic parameters including relatedness
The following parameters were assessed using GENEPOP 4.0 (Raymond & Rousset, Reference Raymond and Rousset1995: http://genepop.curtin.edu.au/) and/or ARLEQUIN (http://lgb.unige.ch/arlequin/), essentially as performed earlier (see Massonnet et al., Reference Massonnet, Simon and Weisser2002 for details), viz. per locus and over all loci and/or sampling periods, observed and expected heterozygosity, the probability of deviations from HWE, and genic (allelic) and genotypic differentiation. In addition, F-statistical parameters (F ST and F IS) were calculated per locus and sampling period and over all loci and populations, and F ST alone as pairwise indices, as were also estimates of linkage disequilibrium per pairs of loci. Hierarchical partitioning of genetic variance was performed in ARLEQUIN using analysis of molecular variance (AMOVA) (Excoffier et al., Reference Excoffier, Smouse and Quattro1992; Weir & Cockerham, Reference Weir and Cockerham1984), which accounts for both allelic frequencies and variance in size between pairs of alleles, to provide both within- and among-individual level variances. G/N (genotype/sample number) ratios were also computed for temporal population samples for the four sampling periods (June, July, September and October).
As a measure of relatedness between individuals, the shared allele genetic distance D AS was estimated (Jin & Chakraborty, Reference Jin and Chakraborty1994) using the computer program POPULATIONS, version 1.2.30 (Langella, Reference Langella1999). D AS is calculated as 1-(proportion of shared alleles), where the proportion of shared alleles is the ratio of the total number of alleles that occur in both individuals over twice the number of loci. D AS ranges between zero (i.e. two aphids sharing the same multilocus genotype, highest relatedness) and one (i.e. two aphids with different alleles at all loci, lowest relatedness).
For the June, July and October sampling, when the majority of winged individuals were found, we calculated: (i) the average relatedness among wingless individuals in a colony and (ii) the average relatedness between winged and wingless individuals. To determine the effects of season and ‘wingedness’ (wingless vs. winged) on average relatedness, we analysed a sample of an aphid colony comprising two to four wingless and at least one winged individual, up to a maximum of four winged individuals by fitting a linear mixed-effects model (package nlme 3.1–89) (Pinheiro & Bates, Reference Pinheiro and Bates2000). Season and ‘wingedness’ were treated as fixed effects; colony was modelled as a random effect. To normalise errors and standardise variance, relatedness was arcsine/square root-transformed. Analyses were performed using the R 2.9.1 statistical software (R Development Core Team, 2009).
Following frequency analysis of MLGs using SPSS, calculation of Shannon diversity values were performed in Microsoft Excel, not only to assess the number of MLGs present in the seasonal samples, but also the evenness of their relative abundances (Vanoverbeke & De Meester, Reference Vanoverbeke and De Meester1997).
Results
Field survey
The proportions of ramets and genets occupied by aphids are shown elsewhere (Massonnet et al., Reference Massonnet, Simon and Weisser2002). The total number of aphid colonies increased from week 1 to week 8 and then decreased (fig. 2a). Most colonies were small or medium in size, whereas the number of large colonies never exceeded 18% (fig. 2a). The mean number of aphids per colony increased from week 1 to 6 and then decreased (fig. 2b). The decrease in mean colony size despite the continuing increase in the total number of colonies was due to an increasing proportion of small colonies (fig. 2a, b). A second increase in colony size was observed from week 18 to 21, before colonies went extinct in week 27.
(a) Total number of colonies found in the study area throughout the season (total number of ramets surveyed N ramets=1202). For each week, number of small colonies (in white), medium size colonies (in grey) and big colonies (in black). (b) Mean aphid colony size per week throughout the season based on the lowest (black squares), mean (open circles) and highest (black triangles) number of aphids in each colony size class. (c) Proportion of colonies on ramets with winged individuals, out of all colonies. For each week, proportion of such colonies of small (in white), medium (in grey) and large (in black) size. (d) Proportion of winged individuals in colonies with winged individuals throughout the season. For each week, minimum and maximum of proportion of winged individuals, represented respectively by the lower (full squares) and upper (full triangles) lines.

The proportion of aphid colonies with winged individuals increased until week 7 (55.2% of all colonies) and then decreased (fig. 2c). The only winged individuals observed late in the season were males (weeks 22 to 25). Most aphid colonies with winged individuals were of small to medium size throughout the season. Large colonies with winged aphids did not exceed ∼10% of all colonies (fig. 2c).
The proportion of winged individuals in colonies with winged individuals increased from week 3 to 4 and remained thereafter at more or less the same level (∼40% of the total) until week 9–10 (fig. 2d). The fluctuations observed from week 11 to 15 were due to the low number and the small size of the aphid colonies (fig. 2a). From weeks 22–26, the number of winged individuals (here males) increased to around 30% of the total (fig. 2d). In October, 37 colonies were collected and dissected. The mean percentage of sexual individuals was 72.8±5.1% SE (64.6±4.6% SE sexual females and 8.2±1.7% SE sexual males).
Aphid colony size was not significantly different between sampling periods (ANOVA, F=1.10, df=3, P=0.35), but the number of adult aphids per colony differed between sampling dates (F=7.32, df=3, P<0.001; table 1). The number of adults was the highest in the October sampling. The proportion of winged individuals in colonies also differed between sampling periods (χ2=25.01, df=3, P<0.001). Winged adults and fourth instar larvae with wing buds were rare in June and September (table 1). In the September sampling, all winged morphs were fourth instar larvae with wing buds. The October sampling had the highest proportion of colonies with winged individuals (table 1).
Results from the colony sampling for the proportion of aphid colonies with winged individuals; both winged adults and fourth instar larvae with wing buds were counted. To calculate the proportion of winged individuals in colonies, only colonies with winged individuals were considered. Averages are shown as mean±SE.

Analysis of main genetic parameters
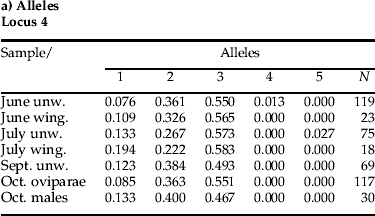
Of the three loci tested in the total population, Mt-4, -6 and -7 were found to have 5 (range 201–213 bp), 26 (range 197–253 bp) and 11 (range 167–187 bp) alleles per locus, respectively (mean 7.19±3.78 SD over all loci and sampling periods). Allele frequencies per sampling period/morph are shown in fig. 3a–c, genotype frequencies in fig. 3d, e. Observed heterozygosity (H o) ranged from 0.46–0.61 (mean 0.56±0.02 SD), expected heterozygosity (H E) from 0.65–0.73 (mean 0.70±0.01 SD). These values are very similar to those found in the earlier metapopulation study (Massonnet et al., Reference Massonnet, Simon and Weisser2002) and show an excess of homozygotes, as also found in this earlier study (see their table 1). The probability of significant deviation from HWE (P<0.05) for the various lifecycle categories tested (asexual wingless, winged, ovipara and males) over the four sampling periods (June, July, September and October) is shown in table 2. Of the 21 population samples tested, 15 (71%) deviated from HW expectations. Removal of duplicate MLGs from the samples reduced the proportion of loci deviating from HWE to 12 out of 21 (57%; table 2). In terms of linkage disequilibrium, significant (P=0.05) differences were often observed, i.e. June wingless (3 out of 3 pairwise comparisons); June winged (0 out of 3); July wingless (3 out of 3); July winged (3 out of 3); September wingless (1 out of 3); oviparae (3 out of 3) and males (3 out of 3). All populations were significant across all loci and populations (Fisher's method). Except at Mt-4, which was not significant (P>0.05) across all populations tested, the other two loci were significantly different (P<0.05), both in terms of genic and genotypic differences. In terms of genic differentiation for Mt-4, Mt-6 and Mt-7, 3, 15 and 19 of 21 pairwise comparisons were significantly different (P<0.05), respectively, whilst for genotypes, 2, 14 and 18 out of 21 pairwise comparisons were significant, respectively.
Changes in the temporal genetic composition across populations of tansy aphid sampled from June to October: (a–c) allele frequency at locus Mt-4, -6 and -7, respectively; (d, e); genotype frequency at locus Mt-4 and -7, respectively (e.g. for Mt-4, genotype 1:2, 1:3, etc. refer to combinations between alleles 1 and 2, 1 and 3, etc. at this locus). Each shaded or stippled section represents the frequency for a given allele or genotype at the locus and population sample in question. (A31–1, A9–2, B1–1, etc. refer to the original seasonal aphid sample designations used).

Single-locus probability tests for deviation from HWE for seven temporal population samples of tansy aphids.

N, samples size; significant deviations from HWE after Bonferroni correction are shown in boldface; P-values and N in parentheses refer to probabilities and sample size, respectively, after removal of duplicate MLGs from population samples.
F IS
* P<0.05; ** P<0.001;
ns, non-significant.
Over the three loci, F IS computed in ARLEQUIN ranged from 0.09–0.36 (mean=0.19) and all values except for the July winged sample were significantly different from HWE (P<0.05), whilst pairwise F ST ranged from 0.0–0.091 (mean=0.028 over all loci and comparisons). Values were little changed on removing duplicate MLGs (data not shown), although F IS values were now all significantly different from HWE. These values may be compared with the mean F IS and F ST values in the study of nine populations sampled in 1999 in Germany and France by Massonnet et al. (Reference Massonnet, Simon and Weisser2002) using eight microsatellite loci, i.e. F IS=0.1 and F ST=0.12, respectively. Whilst the F IS value is similar, the F ST value is considerably lower. In the present study, of the 21 pairwise Fst analyses performed, the majority (15/21) were significantly different (P=0.05) (12/21 on removing MLG duplicates). Of the non-significant comparisons with no duplicates removed, these concerned June wingless vs. June winged; July wingless vs. July winged; July wingless vs. males; July winged vs. October ovipara and males, and October sexual females vs. males. Thus, in terms of temporal genetic relatedness, the June and July samples of wingless and winged individuals were, respectively, similar to one another, though not the two monthly samples (June and July) when compared directly with one another. The July wingless samples were similar to the October males, whilst the July winged samples were similar to both October sexual samples (males and oviparae); and, as might be expected, the sexual forms did not differ significantly from one another. F ST values showed a mean of 0.048±0.008 SE (13 pairwise comparisons) for June vs. all other seasonal samples, and a mean of 0.011±0.004 SE (15 pairwise comparisons) for the remainder of the comparisons. Hence, the June samples seemed both qualitatively as well as quantitatively different from the other samples tested.
This is borne out by examination of the individual allele and genotype frequencies for the three loci tested. Thus, and interestingly, at Mt-4, the frequency of three main alleles (1–3) is similar over the entire temporal collecting period (fig. 3a). In contrast, at locus Mt-6 (fig. 3b), the June collections are clearly different in terms of their allelic array, showing, for example, unique alleles 5, 7, 11 (at least to the samples tested) compared with the later collections, which have in contrast unique alleles 12 and 16, although alleles 20 and 22 appear in both early (June unwinged) and later samples. Mt-7 shows a similar pattern to Mt-6 in that alleles 4 and 9 occur only in the June collection, whilst allele 10 occurs only in all the later collections, and alleles 5 and 11, the dominant alleles, are common to all the collections (fig. 3c).
This difference between the June samples and the remainder is also supported in the case of the genotypic frequencies. Thus, whilst the genotypic array for locus Mt-4 (fig. 3d) is somewhat similar between sampling dates/morph, as found also with the aforementioned allelic array at this locus, the genotypic array for Mt-7 shows differences between the June and later collections (fig. 3e). Thus, genotypes 3:9 and 5:9 (i.e. comprising alleles 3 and 9 and 5 and 9, respectively, at this locus) occur only in this month, whereas genotype 5:10 occurs in some of the subsequent collection, although not the sexual morphs. The dominant genotypes 5:5 and 5:11 occur in all the samples. The genotype pattern for locus Mt-6 (not shown), though more complex and hence less clear, nevertheless still shows differences between the June and later samples, e.g. the presence of genotype 12:12 in the latter samples (see Appendix for tables of allele and genotype frequencies for the three loci).
In terms of G/N ratio (table 2), this is clearly similar in wingless samples from June, July and September (range 0.67–0.72), but increases in the June/July winged samples (0.96–1.00) so that all individuals bear virtually or completely unique MLGs, and decreases again to 0.44 and 0.57 in oviparae and males, respectively, as the season ends in October, showing that more multiple copy MLGs have been produced compared with earlier in the field season.
Pairwise hierarchical analysis of molecular variance (AMOVA; distance method) performed in ARLEQUIN for pooled population samples (winged and wingless) for the four sampling periods (June, July, September, October) showed that the great majority of the variance was ‘within individuals’ (78.9%) (degrees of freedom, df=451; sum of squares, sos= 387.5; variance components, vc=0.86) with 17.5% ‘among individuals within sampling periods’ (df=447, sos=554.2; vc=0.19) and a very small proportion among the sampling periods themselves (3.6%) (df=3, sos=29.6; vc=0.04). Hence, despite clear differences in genetic structuring, especially between June and July samples, there was a seemingly high level of gene exchange between all the temporal populations tested. The essential pattern was not fundamentally changed by testing the temporal population samples individually (i.e. June, July and September wingless aphids) or as all wingless samples pooled or all samples (wingless and winged) pooled (data not shown).
Multilocus profiles and calculation of relatedness
The number of colonies from which four wingless individuals were analysed for multilocus genotypic profiles was 26, 14, 12 and 28 for the June, July, September and October sampling, respectively. In the other genotyped colonies, fewer than four wingless individuals were found (see table 1).
In less than 30% of these colonies, the wingless individuals sampled were monomorphic (i.e. carrying genetically identical MLGs) (fig. 4); there was a trend for increasing proportions of monomorphic colonies as the growing season progresses (binomial GLM, z=1.75, df=3, P=0.08; fig. 4). Similarly, for wingless individuals, there were trends for decreasing numbers of MLGs per colony (binomial GLM, z=–1.75, df=103, P=0.08; fig. 5a), and a decline in genetic variability (defined as the ratio of different MLGs to the number of samples per colony) through the season (binomial GLM, z=–1.77, df=105, P=0.08; fig. 5b).
The proportion of monomorphic colonies with four wingless individuals (i.e. identical MLGs) per season: for the June, July, September and October sampling 26, 14, 12 and 28 colonies were analysed, respectively.

For each sampling period, (a) mean number of MLGs (±SE) per colony; (b) mean genetic variability (±SE) per colony, given as the ratio of different MLGs to the total number of aphids analysed; and (c) mean D AS-value (±SE) for all wingless individuals. There were 32, 21, 21 and 30 aphid colonies analysed for June, July, September and October sampling dates, respectively. Different letters (a and b) in fig. 5c indicate significant differences (Tukey's HSD post hoc tests, α=0.05).

Moreover, there was significant variation in terms of relatedness (D AS) among wingless individuals (four per colony) between sampling periods (linear mixed-effects model anova, F=6.38, df=3, P<0.001; fig. 5c). Relatedness among wingless individuals increased significantly (i.e. D AS became closer to zero) from June until October (Tukey's HSD, z=−3.23, P<0.01) and July until October (Tukey's HSD, z=−4.08, P<0.001) (fig. 5c). Of these wingless individuals, both asexual morphs (June, July and September) and sexual morphs (oviparae, October) showed a maximum of eight clonal individuals per MLG (i.e. September wingless).
Examination of the MLGs themselves as a function of seasonal morph class (table 3a) reveals that, for the June wingless sampling, a total of 96 out of 119 MLGs were unique (i.e. unique+multiple unique per particular sample (=80.6%); in July, 50 out of 75 (66.7%); in September, 42 out of 69 (60.9%); and for the oviparae in October, 86 out of 117 (73.5%). Hence, there were more uniques in June, whereafter these remained about 60% of the populations tested except for the oviparae. The number of shared MLGs was low in the June wingless sample (19.4%) and was generally higher in the other wingless samples tested, although the general proportion of shared MLGs is not that different between categories (33.3–38.9%), except for the oviparae, which showed a lower value (26.5%) (table 3a). It is clear that the sexuals have more multiple copies per morph category than the other morph categories (>43.3%). From table 3b, it is seen that seasonal morph groups often share MLGs, although June wingless and winged samples have none in common. In addition, there is no large pool of June wingless MLGs that feeds into the July population, although June wingless MLGs continue to be shared as the season progresses, sometimes quite a few, i.e. vs. September wingless (19). Later, the July wingless share MLGs with the other morph classes, e.g. July winged (11), September wingless (18) and October ovipara (17) (table 3b). What is very striking is that there is a big discontinuity between June wingless vs. July shared MLGs, i.e. 17 vs. six and four for July wingless and winged, respectively, again strongly supporting the view that it is at this time that the main genetic revolution occurs in terms of MLG turnover.
(a) Distribution of M. tanacetaria MLGs in seasonal (morph) classes. (b) Distribution of M. tanacetaria MLGs between seasonal (morph) samples.

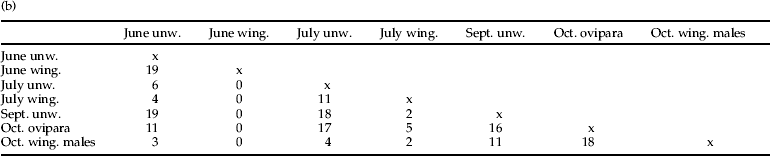
Percentage of total shown is bracketed in parenthesis.
Like the wingless aphids, most winged individuals also carried unique MLGs. In the June sampling, 15 out of the 23 MLGs of winged adults were unique (65.2%), and all shared MLGs were shared with June wingless aphids only (see below). In the July sampling, all 18 winged adults had different (i.e. unique) MLGs. There were no winged adults in September. In October, 19 of the 30 males showed unique MLGs (63.3%) (table 3a).
Of the total of 80 aphid colonies (four wingless individuals) sampled, 66 colonies (82.5%) showed different MLGs, while in 14 cases (17.5%) a given MLG was restricted to a single colony. Of these latter MLGs, six had totally unique MLGs; the remainder shared with colonies on nearby ramets in the same time period (i.e. usually 1–3 repeats MLGs), whilst two such samples shared MLGs with different time periods (i.e. September wingless vs. July wingless; October oviparae with July wingless).
In June, eight out of 23 winged individuals shared an MLG with at least one wingless individual. To test whether this degree of MLG sharing is expected under the assumption that MLGs of both wingless and winged individuals derive from the same population, we performed a bootstrap analysis. First, the MLGs derived from wingless and winged individuals were pooled, then 23 MLGs (mimicking the winged sub-sample) were drawn at random and tested for genotype sharing with the remainder of the sample (10,000 replications). Under these conditions, the expected average degree of MLG sharing between re-sampled ‘winged’ and ‘wingless’ subgroups was 14.2 (95% bootstrap-CI=10–18). Similarly, in the July and October samplings, three out of 18 and two out of 30 winged individuals shared an MLG with at least one wingless individual, respectively. The expected average levels of MLG sharing for these cases were 10.5 (95% bootstrap-CI=7–14) and 17.4 (95% bootstrap-CI=13–22), respectively. This analysis indicates that the distributions of MLGs derived from wingless vs. winged sub-samples are significantly different. Hence, it appears that the winged genotypes are not primarily derived from the respective natal populations.
This assertion was supported when we tested for differences in the degree of relatedness among wingless individuals (four aphids per colony) as opposed to the degree of relatedness among wingless and winged individuals (four wingless vs. 1–4 winged aphids) in the June, July and October samples. Since no significant differences became apparent between June and July (Tukey's HSD, z=−1.64, P>0.05), these two sampling periods were pooled for the final model. A linear mixed-effects model revealed a significant main effect of ‘wingedness’ (t=2.59, df=326, P=0.01), indicating that, in both sampling periods, wingless and winged individuals were less related to each other (higher D AS-values) than wingless individuals among themselves (lower D AS-values) (fig. 6). Interestingly, for both winged and wingless individuals, the June/July samples were significantly less related (higher D AS-values) than the October samples (lower D AS-values) (linear mixed-effects model, t=−3.66, df=31, P<0.001; fig. 6). Moreover, there was a significant interaction between ‘wingedness’ and sampling period (linear mixed-effects model, t=2.62, df=326, P<0.01), indicating a more pronounced increase in relatedness among wingless individuals (59%) as the season progresses than between wingless and winged individuals (36%; fig. 6). Shannon diversity of MLG generally decreased over the season, except for a small increase at the end of the season (due to male immigration) and was always higher when winged individuals were included in the calculation, again emphasizing the winged immigration of new genotypes into colonies from other areas (fig. 7).
Mean relatedness (D AS-values±SE) among wingless individuals within a colony (white bars) and between wingless and winged individuals within a colony (grey bars) for June/July and October (□, Wingless;  , Wingless/Winged).

Shannon diversity of M. tanacetaria MLGs as a function of season (June, July, September and October) for all samples (grey bars) and with winged individuals (including males in October) removed (white bars) (, All; □, Without winged).

Discussion
Whilst there have been few studies examining the spatial genetic variability of aphids (reviewed in Loxdale & Lushai, Reference Loxdale, Lushai, van Emden and Harrington2007), there have been even fewer studies concerning the temporal genetic variation of aphids, either within or between growing seasons (e.g. Rhomberg et al., Reference Rhomberg, Joseph and Singh1985; Loxdale & Brookes, Reference Loxdale and Brookes1990; Kasprowicz et al., Reference Kasprowicz, Malloch, Pickup and Fenton2008). This is surprising considering their potential significance both as economic pests and as model organisms for cyclical parthenogenesis and clonal selection. The present study is, hence, one of the very few within season temporal studies of aphids using high resolution molecular markers, here microsatellites.
In previous studies, Massonnet (Reference Massonnet2002), Massonnet et al. (Reference Massonnet, Simon and Weisser2002) and Massonnet & Weisser (Reference Massonnet and Weisser2004) found that both Macrosiphoniella tanacetaria and Metopeurum fuscoviride Stroyan (another aphid species occurring on tansy, but unlike M. tanacetaria, ant attended) show metapopulation structure; colonies undergo seasonal changes in abundance as a function of an initial colonisation phase. Colonies reach a peak of abundance in mid-June to early July with a partial recovery in late season (September–October) when sexual morphs are produced (see below). Such decline in population size is brought about by the action of predators, primary hymenopterous parasitoids (e.g. Nyabuga et al., Reference Nyabuga, Loxdale, Heckel and Weisser2010 in the case of the specialist parasitoid of M. fuscoviride) and entomopathogenic fungi, host senescence (i.e. increasing unsuitability) and, perhaps sometimes, purely abiotic factors, ultimately leading to extinction of the colony.
The pronounced patchy distribution of the tansy aphid host plants should enhance the effects of selection and genetic drift, thus shaping the population genetics of the tansy aphids to a significant degree. We may expect this to lead to genetic isolation of local colonies (i.e. reduced inter-colony gene flow) and local inbreeding. It may distort gene frequencies, cause excess homozygosity within subpopulations (positive F IS) and lead to elevated levels of linkage disequilibrium, further exacerbated by parthenogenetic propagation during the asexual phase of the life cycle, as indeed found in M. tanacetaria populations (Massonnet et al., Reference Massonnet, Simon and Weisser2002; Massonnet & Weisser, Reference Massonnet and Weisser2004), including in the present study. Interestingly, despite a perceived lack of gene flow, no significant isolation by distance at lower spatial scales (<∼400 km) has been shown in related studies (Massonnet et al., Reference Massonnet, Simon and Weisser2002). This suggests that, even so, enough low level gene flow occurs locally to blur potentially differentiated genetic patterns using the markers available.
This, in turn, implies that there may be enough winged migrants locally to allow for colonisation of new plants and the spread of particular genes/genotypes between resource patches. If, however, local migrants were frequent, particular successful genotypes should be able to spread widely across resource patches, thus establishing themselves as regionally dominant clones (e.g. Kasprowicz et al., Reference Kasprowicz, Malloch, Pickup and Fenton2008 in the case of M. persicae). This does not appear to be the case for tansy aphids where populations are found to be locally highly heterogeneous with relatively few clonal copies, especially early in the season (Loxdale et al., Reference Loxdale, Kigathi and Weisser2009, Reference Loxdale, Massonnet and Weisser2010). To explain these patterns, we therefore examined within-seasonal fluctuations in genetic variability within and among colonies of the tansy aphid.
First, the results of the field survey performed for this study were broadly consistent with the results of previous studies on the population ecology of M. tanacetaria (Massonnet et al., Reference Massonnet, Simon and Weisser2002; Massonnet & Weisser, Reference Massonnet and Weisser2004). After egg hatch in spring, there was a strong increase in the number of colonies on host ramets and genets, until about mid-summer. During this expansion phase, similar to many aphid species, the number of winged individuals and the proportion of colonies with winged individuals also increased. The number of aphid colonies then decreased and increased again at about the time when sexual aphids were produced in October (see fig. 2). Dispersal by asexual winged females is, hence, mostly restricted to the beginning of the season. This pattern was also found in the 2000 collection of colonies tested for genetic variation. For example, the density of aphid colonies was very low in September (2000), which made collection of colonies difficult; and no winged asexual female adults were observed in the colonies at this time. Dispersal by winged males, on the other hand, occurs at the end of the season when males seek out wingless sexual females (oviparae), attracted by female sex pheromones and plant odour cues (Pickett & Glinwood, Reference Pickett, Glinwood, van Emden and Harrington2007). Thus, there are two distinct peaks of dispersal during the phase of parthenogenetic reproduction in M. tanacetaria, and, consequently, two main periods during the year when within-colony genetic diversity can be increased by the immigration of winged forms.
In terms of genetic parameters, table 2 shows that the majority of loci deviated significantly from HWE. Although this was ameliorated partially after removal of MLG duplicates, the few samples conforming to HWE expectations were of small sample size. This suggests that such agreements may be artifactual. The fact that the majority of F IS values (table 2) were positive further supports the notion that colonies of the aphid are rather inbred. Similarly, the majority of pairwise linkage disequilibrium tests showed significant deviations, as might be expected for a cyclical parthenogen with a lack of recombination in the asexual phase of the life cycle of perhaps 14 generations and, in effect, with a linked genome during this time (Loxdale, Reference Loxdale2008). The values for observed heterozygosities are similar to those found in previous studies of this aphid (Ho=0.56 vs. 0.52; mean of all values presented in table 1 of Massonnet et al., Reference Massonnet, Simon and Weisser2002) although expected heterozygosity was higher in this study (i.e. H E=0.7 vs. 0.56 in Massonnet et al. Reference Massonnet, Simon and Weisser2002). The lower F ST value reported in this study compared with Massonnet et al.’s (2002) (i.e. ∼0.03 vs. 0.12) probably reflects the smaller number of loci here used and the fact that subpopulations were geographically much closer in the present study, hence with relatively higher levels of interpopulation (colony) gene flow. Lastly, pairwise differences between temporally-sampled colonies (AMOVA) showed that most of the variation resided within individuals, with much lower variations among individuals within sampling periods, and least variation among the sampling periods themselves. This being so, whilst temporally-sampled colonies show high genetic heterogeneity, the small ‘among sampling’ variance suggests that there is, nevertheless, significant ‘gene flow’ (i.e. a persistence of certain genes/genotypes) between tansy aphid generations over time, as indeed seen graphically from fig. 3a–e.
The paucity of clones among tansy aphid colonies as previously noted in spatial studies (e.g. Loxdale et al., Reference Loxdale, Kigathi and Weisser2009, Reference Loxdale, Massonnet and Weisser2010) was also noted in the present temporal study. Over the entire growing season, the vast majority of colonies had more than one multilocus genotype, even though only up to four individuals were genotyped. Since aphids rapidly reproduce asexually in spring and summer, it might rather be expected that a single genotype would dominate per colony (see also Loxdale & Brookes, Reference Loxdale and Brookes1990 and De Barro et al., Reference De Barro, Sherratt, Brookes, David and Maclean1995b where more than one Sitobion aphid genotype were found on single ears of cereals or grasses).
A further interesting finding was a seasonal pattern in genetic variability; the number of monomorphic colonies and the degree of relatedness between wingless colony members increased from July to October (figs 4, 5c), whilst the mean number of MLGs per colony and the ratio of different MLGs to the total number of wingless aphids within colonies decreased from July to October (table 3a; figs 5a, b and 6). Even though the differences were non-significant except for relatedness, the consistency of the pattern across analyses strongly indicates an overall highly significant effect (Fisher's combined probability (excluding relatedness), χ2=15.2, df=6, P=0.02).
Lastly, it was found that the winged forms are unlikely to derive from the same natal population as the wingless aphids. Winged individuals of all sampling periods shared significantly less MLGs with wingless individuals than expected by chance alone (figs 6 and 7) and were significantly less related to the wingless members of the same colony than those were amongst themselves (fig. 6). The above trends – decline of genetic variation in wingless individuals as the season progressed towards its end and the fact that samples with winged forms, including males, always had per sampling period comparatively higher genetic variation than the females (asexual or sexual females), as if they had come as immigrants from other colonies – is supported by the observed seasonal changes of G/N ratios (table 2). These finding strongly suggest that winged morphs primarily immigrated into already existing colonies (see below). In the following, we discuss the consistency of these patterns with the results of the field study and the processes that may perhaps explain the high clonal diversity.
What are the sources of the clonal diversity at the beginning of the season? When stem mothers hatch in spring, the tansy genet is often of small size and consists of only a few ramets. Therefore, the number of feeding sites available is likely to be low at the beginning of the season. Stem mothers are often observed feeding together on the only shoot present in a genet (B. Massonnet, personal observation). When stem mothers feed together, this results in colony founding by different genotypic lineages. As the size of this aggregation increases due to asexual reproduction, the clustering of different MLGs will result in clonal competition and selection (Rhomberg et al., Reference Rhomberg, Joseph and Singh1985; Loxdale et al., Reference Loxdale, Massonnet and Weisser2010).
Whilst neither genetic diversity nor relatedness among the wingless individuals significantly changed from June to July (fig. 5a–c), there is clear evidence for a turnover in gene and genotype frequency (table 3a, b; fig. 3b, c, e), indicating some genetic replacement within colonies after June. (Also, F ST-values decreased slightly between June and the remainder of the season, giving credence to a genetic change having occurred). This could have come about either by low-level immigration from other colonies or extinction of the original colonies and appearance of new colonies founded by individuals of different MLG. As the mean survival time of colonies is less than two weeks (Massonnet et al., Reference Massonnet, Simon and Weisser2002; Massonnet & Weisser, Reference Massonnet and Weisser2004), many colonies sampled in July were newly founded. Such replacement is unlikely to come from wingless individuals, certainly not between genets, and anyway predation is likely to be high for such individuals (Losey & Denno, Reference Losey and Denno1998; but see also Hodgson, Reference Hodgson1991). As the number of colonies per genet was low in June and July (Massonnet et al., Reference Massonnet, Simon and Weisser2002), some of the observed turnover of genotypes is likely due to immigration of winged forms from other genets. This is further supported by the field study that showed that winged individuals are produced from May until the end of July, and by the occurrence of these in the colony sampling. The fact that genetic diversity and relatedness among colony members is not greatly perturbed may suggest that the immigrants involved are local rather than more distant, i.e. they are members of the same local diversity centre.
Genetic diversity and relatedness among the wingless individuals changed significantly from summer to autumn (figs 5 and 6). This is consistent with the severe bottleneck in terms of colony numbers and size observed throughout the late summer period seen in the field study (fig. 2). It is also consistent with the notion of an increase in clonality derived from clonal competition as the season progresses (Loxdale et al., Reference Loxdale, Massonnet and Weisser2010). In relation to clonal selection, there are several examples of a significant decrease of clonal diversity over the season at the level of fields or greenhouses (De Barro et al., Reference De Barro, Sherratt, Carvalho, Nicol, Iyengar and Maclean1994, Reference De Barro, Sherratt, Carvalho, Nicol, Iyengar and Maclean1995a; Sunnucks et al., Reference Sunnucks, De Barro, Lushai, MacLean and Hales1997; Fuller et al., Reference Fuller, Chavigny, Lapchin and Vanlerberghe-Massuti1999). Difference in fitness can also occur when aphids feed on different host plants (e.g. De Barro et al., Reference De Barro, Sherratt, David and Maclean1995c; Lushai et al., Reference Lushai, Markovitch and Loxdale2002; Llewellyn et al., Reference Llewellyn, Loxdale, Harrington, Clark and Sunnucks2004; Via, Reference Via1991; see below) or by differential susceptibility to parasitoids (e.g. Ankersmit et al., Reference Ankersmit, Bell, Dijkman, Mace, Rietstra, Schröder and de Visser1986; Henter & Via, Reference Henter and Via1995; Losey et al., Reference Losey, Ives, Harmon, Ballantyne and Brown1997) or predators (Braendle & Weisser, Reference Braendle and Weisser2001). It is likely that the final dominance of a clone may occur through a combination of genetic drift and clonal competition.
The field study showed the appearance of winged males in October; like the summer asexual winged females, the males are likely immigrants at that time. Both in the summer sample, as well as in the October sample, the relatedness of winged to wingless individuals within colonies was lower than the relatedness among wingless forms (fig. 6). Hence, many of the winged forms were not born in the colony they were found in. Moreover, the comparison of the summer sample with the October sample implies that winged dispersers in autumn are comparatively less related to their wingless colony mates than early in the season (fig. 6). This suggests a higher ‘migratoryness’ in the autumn males than the June/July winged asexual females. If so, this in turn may relate to the cues sought by either morph: plants in the case of the winged asexual females and plant odours and sex pheromones in the winged males. Possibly, the males also fly comparatively higher than the asexual females. Certainly, the autumnal pre-sexual winged females of the bird cherry-oat aphid, Rhopalosiphum padi (L.), are known to fly higher than the summer asexual forms, since they too are seeking different targets (here the primary woody host bird cherry, Prunus padus L. in the former morph, whereas the latter morph are seeking grasses and cereals (Poaceae): Tatchell et al., Reference Tatchell, Plumb and Carter1988).
In conclusion, we suggest that the temporal pattern of genetic diversity in colonies of M. tanacetaria is driven mainly by seasonal fluctuations in population size and dispersal rates of this species. Periods of reduced population size are followed by a drop in genetic diversity. In contrast, in the periods when winged dispersers abound, natal colonies receive immigrants, and changes at the genetic profile occur at some loci. Nevertheless, overall genetic variability is not greatly changed. This last point emphasises the local nature of the migration events involved.
Acknowledgements
We thank Andreas Werries for technical help with DNA extractions and Dr John Sloggett, Prof. Andrew Davis and two anonymous referees for their valuable comments on this paper. We thank Norma Nitschke for help with the SPSS frequency analysis. Blandine Massonnet was supported by grant no. 3100-053852.98 of the Swiss Nationalfonds.
Appendix. Original allele and genotype frequencies for the three loci: Mt-4, Mt-6 and Mt-7 (N=sample size)