A substantial literature documents the importance of racial differences in schooling in accounting for the black-white earnings differential in the early to mid-twentieth century (see, Smith Reference Smith1984; Smith and Welch Reference Smith and Welch1989; Margo Reference Margo1990; Donohue and Heckman Reference Donohue and Heckman1991). On average, the quantity and quality of schooling was lower for blacks than for whites around 1900, but the racial gap narrowed over the twentieth century. The literature finds that measured school quality (Orazem Reference Orazem1987; Margo Reference Margo1987, Reference Margo1990; Walters, James, and McCammon Reference Walters, James and McCammon1997), the Rosenwald Rural Schools Initiative (Aaronson and Mazumder Reference Aaronson and Mazumder2011), parental characteristics (Fishback and Baskin Reference Fishback and Baskin1991; Margo Reference Margo1987; Walters, James, and McCammon Reference Walters, James and McCammon1997; Walters, McCammon, and James Reference Walters, McCammon and James1990), and family structure (Moehling Reference Moehling2004) account for part of the racial differentials in school enrollment and attendance. However, this literature has largely neglected the role of cotton, the main product of the region where most black children lived.
In the early twentieth-century South, harvesting the cotton crop required a large number of extra workers from September into December. Children, who had the advantages of short stature and nimble fingers, were employed, both formally and informally, to fill this seasonal demand. The harvest overlapped with the timing of the traditional school year, forcing parents to choose between sending their kids to school or to the fields. Because farmers, when deciding how much cotton to plant, likely took into account the availability of their children to help harvest the crop, cotton production may be endogenous to the schooling decision. Thus, I use the timing of the arrival of the boll weevil, an invasive pest that consumes the cotton plant, as an instrumental variable.
Since cotton generated more demand for child labor than did its substitutes, the shift away from cotton production following the arrival of the boll weevil provides an exogenous drop in the marginal product of child labor in agriculture. Because such a drop in child productivity reduces the opportunity cost of schooling, it is predicted to have a positive impact on school enrollment and attendance. And, while the shock itself is race blind, the schooling response is expected to be stronger for blacks than for whites because black children were more likely to be farm laborers (U.S. Bureau of the Census 1913). If the cotton economy indeed had a differential impact on enrollment and attendance by race, then the shift away from cotton could explain an economically significant share of the substantial gains in educational attainment made by blacks relative to whites during the early twentieth century.
This article focuses on Georgia, a major cotton-producing state with excellent records on education and wealth. The boll weevil arrived in Georgia in 1915 and infested nearly all of the cotton-growing regions by 1919 (Hunter and Coad Reference Hunter and Coad1923). Immediately prior to the invasion, Georgia was the nation's second largest cotton producer; its record 1911 crop topped 2.82 million bales. After the spreading pest drove up production costs, farmers switched from cotton to alternatives, including corn, sweet potatoes, and peanuts. By 1923, cotton production in Georgia had fallen to 600,000 bales, one-fifth of the record high (Haney, Lewis, and Lambert Reference Haney, Lewis and Lambert2012). A major contribution of this article is to construct a novel database on education and wealth. Georgia published annual statistics on taxable wealth, allowing for control of the potentially confounding effects of wealth on educational investments. In addition, underexploited published reports by the Georgia Department of Education contain detailed annual information on school enrollment, attendance, finance, and quality. I have compiled statistics from the reports of the Georgia Department of Education and Comptroller-General into a large panel dataset at the county level with annual observations from 1909 to 1922. These data let us go beyond the existing historic literature on race and education, which largely uses samples of census data supplemented with indicators of school quality (Fishback and Baskin Reference Fishback and Baskin1991; Margo Reference Margo1987, Reference Margo1990; Walters, McCammon, and James Reference Walters, McCammon and James1990).Footnote 1
My results suggest that reduced cotton production significantly increased the enrollment rate of blacks, but had little impact on the education of white children. Specifically, I find that a 10 percent reduction in cotton production increased the enrollment rate of blacks by 2 percent. Reduced-form results show the arrival of the boll weevil caused a 4 percent increase in the black enrollment rate, or a 2.8 percentage point increase at the 1914 mean (the year prior to contact with the boll weevil in Georgia). This amounts to a 14.6 percent reduction in the racial gap in enrollment.
This work supports the ideas that (1) child labor has a negative impact on educational outcomes, including exam performance (Gunnarsson, Orazem, and Sánchez Reference Gunnarsson, Orazem and Sánchez2006), years of schooling (Beegle, Dehejia, and Gatti Reference Beegle, Dehejia and Roberta2009), and school attendance (Boozer and Suri Reference Boozer and Suri2001); and that (2) restrictions on child labor increased educational attainment (Margo and Finegan Reference Margo and Finegan1996; Acemoglu and Angrist Reference Acemoglu and Angrist1999; Lleras-Muney Reference Lleras-Muney2002; Stephens and Yang Reference Stephens and Yang2014). While much of this literature considers child labor more generally and often focuses on urban employment, I show that the seasonal demand for child labor in agriculture can have substantial negative impacts on educational outcomes, particularly for the poor. Child labor–intensive crops, such as cotton, tea, coffee, sugarcane, and tobacco, are the primary agricultural products in many developing countries (U.S. Department of Labor 1995, 2012). My results are suggestive of the broader impacts of programs that encourage the production of less child labor–intensive crops.
HISTORICAL BACKGROUND
Cotton was King of the Southern Economy
Georgia, like much of the South, was principally an agrarian economy in the early twentieth century, with agriculture employing 63 percent of the labor force in 1910. Moreover, the value of all crops (excluding animal products) was more than twice the value added by manufacturing. The staple of this agrarian economy was cotton, which accounted for 66 percent of the value of all crops in 1909 (U.S. Bureau of the Census 1913).
The dominance of cotton had important implications for the entire household, for cotton, unlike many other crops, did not differentiate between the labor of men, women, and children during much of the growing season, and particularly during harvest. Since the harvesting of cotton remained non-mechanized until the mid-twentieth century, between 1.1 and 2.0 trillion bolls of cotton were picked entirely by hand each year (U.S. Bureau of the Census 1935). Thus, the cotton harvest, which began in September and stretched into December, was a family affair. In fact, small nimble hands and short stature gave children an advantage over adults in the tedious task. While not the norm, it was not unusual for children between ten and 15 years of age to pick more than adults. Even some younger children were able to pick substantial amounts; in Hill County, Texas, for example, a six-year-old girl maintained a picking rate of 80 pounds a day, or approximately one-half the adult male average (Bradley and Williamson Reference Bradley and Williamson1918; Matthews and Dart Reference Matthews and Dart1924). Due to the near perfect substitutability of adult and child labor in the harvest, cotton generated a high demand for child labor from September to December.
Agriculture was by far the largest employer of children. In 1910, 43.4 percent of ten to 15 year-olds living in Georgia worked, of which 88.3 percent were employed in farming. Moreover, these youth made up 19.4 percent of the agricultural labor force (U.S. Bureau of the Census 1913, 1924). These young farm laborers were more likely to be black; 40.8 percent of blacks aged ten to 15 were employed in agriculture, as opposed to 26.9 percent of comparably-aged whites (Ruggles et al. Reference Ruggles, Alexander and Genadek2010).
The majority of these child laborers undoubtedly worked the cotton fields. When children in a North Carolina township, selected to be representative of conditions in the Cotton Belt, were asked about their farm chores, 66 percent of white children and 76 percent of black children ages five through 15 reported doing field work during the agricultural season of inquiry. Of these, 98 percent of white and 100 percent black children reported picking cotton (Bradley and Williamson Reference Bradley and Williamson1918). In Rusk County, Texas, 98 percent of children engaged in field work reported picking cotton (Matthews and Dart Reference Matthews and Dart1924).
The child labor demands of cotton were greater than alternative crops such as corn, peanuts, and sweet potatoes.Footnote 2 While 98 percent of children doing field work in Rusk reported picking cotton, only 13 percent picked corn and 5 percent picked peanuts (Matthews and Dart Reference Matthews and Dart1924). On harvesting corn, the second most common crop in Georgia: “It is doubtful whether any child who is not fairly well-grown should have this sort of work to do, since reaching the highest blades necessitates considerable muscular strain” (Bradley and Williamson Reference Bradley and Williamson1918, p. 51). Thus, a shift away from cotton production would have reduced the productivity of children in agriculture. Such a shift was caused by the arrival of the boll weevil.
The Coming of the Boll Weevil
The boll weevil, Anthonomus grandis, is a small beetle native to Central America and Mexico.Footnote 3 It is thought to have crossed from Mexico into southern Texas near Brownsville in 1892. It then steadily spread north and east, engulfing almost the entire Cotton Belt by 1922. As shown in Figure 1, the boll weevil entered Georgia in 1915 and infested all cotton counties by 1920 (Hunter and Coad Reference Hunter and Coad1923).
THE SPREAD OF THE BOLL WEEVIL THROUGH GEORGIA

The insect's spread through the South had a disastrous impact on cotton production. After being attacked, the fiber-producing squares and bolls usually yellow and drop from the cotton plant, reducing output. While ample anecdotal evidence of the pest's destruction exists, only recently has its impact been examined empirically. Fabian Lange, Alan L. Olmstead, and Paul W. Rhode (2009) show that the boll weevil reduced cotton production by approximately 50 percent within five years of its arrival in a county. While the weevil devastated some cotton fields, particularly those of the Sea Island variety in southeast Georgia, and significantly damaged late-maturing bolls (the top-crop), the presence of the boll weevil did not altogether preclude cotton production. Rather, it reduced yield and necessitated costly pest-control measures.Footnote 4 The decreased returns to farming cotton “under boll weevil conditions”—a commonly-used phrase in contemporary media—caused farmers to shift to less child labor–intensive alternatives.
The arrival of the boll weevil reduced the South's reliance on cotton, and thus had substantial implications for the entire household due to the crop's unique labor demands. Therefore, the spread of the boll weevil through the Cotton Belt provides a unique natural experiment through which I examine the role the cotton economy played in household labor allocation and schooling decisions.
Southern Schooling and Cotton
Since the timing of the cotton harvest conflicted directly with fall schooling, school superintendents both reduced the length of the school term and altered its timing to accommodate the demand for children to work in the field. As an example of the latter, in Morgan County, Georgia, the black schools ran “4 months in the Winter, December, January, February and March. Then two in the Summer, July, August” (Georgia Department of Education 1913, p. 124). Also, William J. Collins and Robert A. Margo (2006, p. 143) observe that “schools in cotton counties (black and white) were open fewer days per year than elsewhere to accommodate seasonal demands for child labor.”
Given its length, however, the cotton harvest inevitably affected school attendance and enrollment despite these accommodations. County superintendents attest to the impact of child labor in cotton on schooling. They often blamed low enrollment and attendance numbers on large cotton harvests. For example, the superintendent of Jones County remarked: “The enrollment of white children is slightly below former years, as is also the average, but the children had to pick cotton” (Georgia Department of Education 1912, p. 152). A year later, the Baker County superintendent made a similar statement: “We had a six months term, but our attendance was not as good as we would have liked for it to have been, owing to the fact of a very large cotton crop” (Georgia Department of Education 1913, p. 101).
Daily attendance data from Hancock County hint at cotton's impact on education.Footnote 5 Attendance was lowest at the start of the school year, increased throughout the fall, and plateaued in the winter. This pattern holds for all races and sexes, but it is a more prominent feature of attendance for blacks. This is consistent with the hypotheses that the cotton harvest depressed school attendance during the fall and had a greater negative effect for blacks.
Southern Schooling and Race
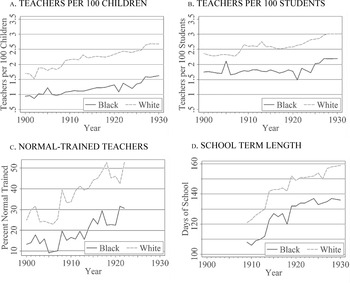
Despite the significant expansion of public education in the Southern United States in the early twentieth century, there remained large racial disparities. The South's segregation policies mandated the creation of two separate school systems, which were in practice anything but equal. Figure 2 shows the time trend of several measures of school quality in Georgia between 1900 and 1930. As shown in panel (a), the number of teachers per 100 school-age children averaged 2.2 for whites but only 1.2 for blacks. The disparity is slightly reduced by restricting the denominator to include only enrolled children; the racial differential in the number of teachers per 100 same-race enrolled students was only 0.75 (see panel [b]). Additionally, the human capital of black teachers was on average lower than that of white teachers. While the percentage of teachers having received normal training (instruction in teaching standards at a normal school, or teachers college) was increasing for both races, the percentage of black teachers receiving normal training consistently lagged behind that of whites by an average of 18 percentage points, as displayed in panel (c). Moreover, school term length, as panel (d) shows, was consistently shorter for blacks by about a month on average.
TRENDS IN SCHOOL QUALITY IN GEORGIA BY RACE, 1900–1930

The educational attainment of blacks lagged behind that of whites as well. In 1900, the school attendance rate of southern children aged five to 19 was 34 percent for blacks and 52 percent for whites. This difference in school attendance culminated in a large gap in educational attainment. The cohort of blacks born between 1890 and 1894 in the South completed just 5.1 years of schooling on average, nearly three years fewer than their white counterparts. However, the racial gaps in education narrowed over time. By 1940, the racial gap in school attendance was just 3.8 percentage points, compared to 18 percentage points four decades earlier. Similarly, the gap in educational attainment fell to 1.1 years of schooling for the cohort born between 1930 and 1934 (Collins and Margo Reference Collins, Margo, Hanushek and Welch2006).
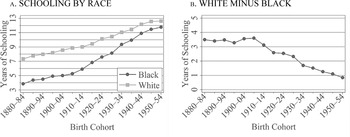
The history of the black-white education gap in Georgia illustrates these points. Figure 3(a) presents the years of schooling of whites versus blacks by five year birth cohorts in Georgia. While the educational attainment of both races trended upward over the early twentieth century, growth was faster for blacks than whites. Figure 3(b), which shows white minus black years of schooling by birth cohort, gives a better sense of the timing of this convergence. The racial education gap remained relatively constant at around 3.5 years of schooling until the 1910–1914 birth cohort when it began to fall at a fairly steady rate. Yet there was no contemporaneous increase in the quality of black schools relative to white schools in Georgia that can explain this trend break, as evidenced by Figure 2.Footnote 6 The timing of the arrival of the boll weevil in Georgia, and the resulting shift away from cotton production, however, corresponds to the beginning of the convergence of the black-white education gap. The first cohort whose schooling decisions would have been fully affected by the weevil in Georgia was the 1910–1914 birth cohort. This suggests that the fall in cotton production in the wake of the boll weevil's arrival may explain part of the initial narrowing of the racial gap in education in the South.
GAP IN YEARS OF SCHOOLING BY FIVE-YEAR BIRTH COHORT IN GEORGIA

DATA
To analyze the role of the cotton economy in determining educational outcomes, I have collected county-level data from the Annual Report of the Department of Education to the General Assembly of the State of Georgia for the years 1909 to 1922. The statistical summaries are a source of a variety of data on school quantity and quality at the county level. Useful statistics on school quantity include the number of children enrolled in school by grade and by sex and average daily attendance. Controls for the quality of education include the number of schools and teachers, days of school per year, and total receipts. Also, Georgia took a quinquennial census of the school-age population, which provides the total school-age population of each county by sex. With the exception of receipts, all of the above mentioned educational statistics were reported separately by race. In addition, the Report of the Comptroller-General provides detailed statistics on taxable wealth, from which I collected total wealth by race for each county.
I also collected data from three sources previously exploited by Lange, Olmstead, and Rhode (Reference Lange, Olmstead and Rhode2009) to analyze the impact of the boll weevil on cotton production. First, Cotton Production in the United States provides the number of bales of cotton ginned, an excellent proxy for the amount of cotton grown, in each county. Second, USDA maps of the boll weevil's spread (Hunter and Coad Reference Hunter and Coad1923, p. 3) are used to create a variable tracking the presence of the boll weevil at the county level. Third, the United States Historical Climatology Network provides historical data including monthly totals of precipitation, which I use to estimate total summer rainfall at the county level—an alternative exogenous shock to cotton production.
EMPIRICAL FRAMEWORK
My first hypothesis is that exogenous reductions in cotton production increased the school enrollment rate of children by reducing the marginal product of child labor in agriculture.Footnote 7 Secondly, this effect is predicted to have been greater for blacks than for whites because black children were more likely to be employed as farm laborers.Footnote 8
While the conflict between the cotton harvest and school attendance in the fall is obvious, the relationship between cotton and enrollment may be less clear, for example, since the harvest did not directly conflict with school attendance in February. However, over the school term topics generally build upon one another, growing in complexity. Thus, the marginal benefit of a day of school is decreasing in the number of days missed at the beginning of the term. Since the cotton harvest overlapped with the beginning of the school term, a child participating full time in the harvest would miss the first few weeks to months of school, lowering the marginal benefit of attending school later. For some, this decrease in the value of schooling may have been great enough to prevent attendance altogether.
I use county-level cotton production as a proxy for the marginal product of child labor in agriculture.Footnote 9 A potential concern with this approach is the existence of alternative mechanisms by which exogenous changes in cotton production could affect the household schooling decision. First, a negative shock to cotton production, such as the arrival of the boll weevil, would negatively affect household wealth. Since wealth is positively correlated with schooling, the wealth effect would bias the expected relationship toward zero. To mitigate this concern, average wealth at the county level is included as a control.Footnote 10 Additionally, lower household wealth implies a reduction in the tax base and, potentially, a reduction in funds for education. In Georgia, however, most school board receipts were apportioned from the State School Fund rather than being raised by local taxation in the early twentieth century. Georgia's School Fund did not change in response to cotton production, which suggests that the boll weevil had little impact on school finances. Nevertheless, to address this concern, I control for school board receipts per school-age child.
A simple regression of measures of education (y) on bales of cotton ginned (COTTON) could be used to examine the hypotheses. This linear regression is represented by the following equation:

which includes controls X ct for county c and year t, as well as county and year fixed effects. County-level controls include average wealth and measures of school quality (teachers per 100 same-race children of school age, schools per 1000 same-race children of school age, days of school per year, and school board receipts per child).Footnote 11 The coefficient of interest is β, the effect of cotton output on measures of education.
However, one concern with the above methodology is the likely endogeneity of cotton production to schooling decisions. A farmer, when deciding how much cotton to plant in the spring, would likely consider whether his children would be available to help with the fall harvest. If the children were to attend school, their labor could not be counted on in the fall. Thus, ordinary least squares (OLS) estimates of equation (1) are likely contaminated by reverse causation: increased schooling, and thus a reduction in the supply of child labor, caused a fall in cotton production due to the higher marginal cost of labor. I address this concern by using an instrumental variables strategy to estimate the effect of cotton production on educational outcomes. Therefore, bales of cotton ginned, COTTON ct , is treated as endogenous and modeled as

where Z ct is an indicator variable for the presence of the boll weevil in county c in year t.
The validity of the boll weevil as an instrument is easily argued. The boll weevil is certainly relevant to cotton production; Lange, Olmstead, and Rhode (Reference Lange, Olmstead and Rhode2009) find that total cotton production fell by approximately 50 percent within five years of contact. The exclusion restriction is that the boll weevil influenced schooling only through its effect on cotton production, a reasonable assumption as the boll weevil's only direct effect was on cotton. Due to the insect's narrow diet, it had no direct impact on humans, livestock, or other crops. Furthermore, there is no reason to think that schooling decisions could have affected the spread of the boll weevil, which can fly up to 50 miles in search of food. Validity of the presence of the boll weevil as an instrument is further explored in a later section.
I also consider the reduced-form specification, given by the substitution of equation (2) into equation (1). This provides an estimate of the overall impact of the boll weevil's arrival on enrollment rates. Since reduced-form effects are computed by OLS, they are unbiased and do not require large sample sizes for statistical properties to hold; the same cannot be said of 2SLS estimates (Angrist Reference Angrist2005).
Two restrictions are imposed on the sample of counties included in the analysis. First, the analysis is limited to those counties that maintained public schools for blacks throughout the study period. There were 11 counties that had small black populations and did not always provide schooling for black children. Second, the analysis is limited to cotton-producing counties. There are 12 counties in Georgia for which there are no data on cotton production for part of the study period. Most are in the mountainous area of northeast Georgia or along the coast. Due to overlap, these two restrictions eliminate only 14 counties. Additionally, to provide a balanced panel of consistently-defined geographical units, I merge counties whose borders changed within the time period studied into the smallest consistent unit. Between 1909 and 1922, 14 new counties were created from parts of 22 existing ones. The adjustment for border changes merges these 36 counties into eight “super counties.”Footnote 12 Altogether, these adjustments reduce the number of counties in the sample from 160 to 121.Footnote 13 Thus, data on 121 Georgia counties over 14 years, 1909–1922, are used throughout the analysis.
RESULTS
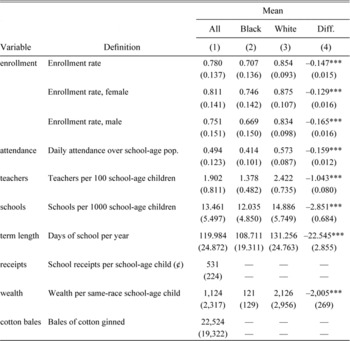
Summary statistics for 1914, the year prior to contact with the boll weevil in Georgia, are shown in Table 1. In 1914, 70.7 percent of school-age black children were enrolled in school, compared with 85.4 percent among whites, for a racial difference of 14.7 percentage points. The racial gap in average daily attendance per school-age child was slightly larger, 15.9 percentage points. However, the average attendance rate, for both races, at these county schools was fairly low at 49 percent.
SUMMARY STATISTICS FOR GEORGIA, 1914

* = Significant at the 10 percent level.
** = Significant at the 5 percent level.
*** = Significant at the 1 percent level.
Notes:
Columns (1) to (3) report means for 1914 with standard deviations in parentheses. Column (4) reports the difference in means estimated from regressions with an indicator variable for blacks and presents standard errors in parentheses.
Sources:
See the text.
There was also a substantial racial gap in school resources. White schools were open for roughly 6.5 months a year, while black schools ran only 5.5 months on average (assuming 20 school days per month). Additionally, there were 2.4 white teachers per 100 white children of school age, but only 1.4 black teachers per 100 black children of school age. Even after adjusting for differences in enrollment rate, the racial differential in student-teacher ratio is very large. On average, there were 51 enrolled black students per teacher, but only 35 enrolled white students per teacher. In terms of schools, there were 2.9 fewer schools for blacks per 1,000 school-age children than for whites. However, blacks were much more likely to attend one-room schools, whereas whites often attended multi-room graded schools. So this measure of access to schools likely understates the true disparity. The average school board received less than six dollars per school-age child. Statewide expenditures for 1914 show 73 percent of funds were spent on whites, 17 percent on blacks, and 10 percent on items not reported separately (Georgia Department of Education 1915). Since blacks made up 46 percent of the school-age population, black schools were clearly not equal to white schools, consistent with work in the “separate-but-equal” literature (Kousser Reference Kousser1980; Margo Reference Margo1990).
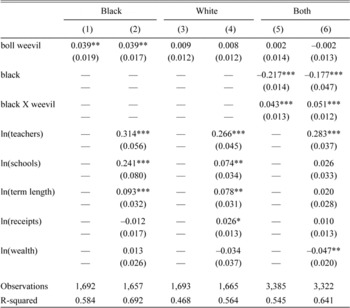
Table 2 begins the examination of the relationship between cotton and schooling, presenting reduced-form effects of the boll weevil on log enrollment rate. The coefficient of 0.039 in column (1) implies that the boll weevil explains a 4 percent (e 0.039 – 1) increase in the school enrollment rate of black children. This result suggests the boll weevil increased the enrollment rate of blacks by 2.8 percentage points at the 1914 mean, or placed roughly an additional 10,000 black children ages six through 18 in school in the state of Georgia alone. Column (2) shows the boll weevil's effect to be robust to the inclusion of wealth and school quality controls.Footnote 14 Conversely, the results for whites in columns (3) and (4) suggest that the boll weevil caused less than a 1 percent increase in school enrollment rate, but these estimates are not statistically different from zero.
REDUCED-FORM REGRESSIONS OF LOG ENROLLMENT RATE ON BOLL WEEVIL

* = Significant at the 10 percent level.
** = Significant at the 5 percent level.
*** = Significant at the 1 percent level.
Notes:
Standard errors adjusted for clustering by county in parentheses. All regressions include county and year fixed effects. See Tables D1 and D2 in the Online Appendix for the results of specifications including county-specific linear time trends and interaction terms.
Sources:
See the text.
To test whether the effect of the boll weevil differed significantly by race, columns (5) and (6) present reduced-form estimates of pooled regressions of log enrollment rate on the presence of the boll weevil, an indicator for blacks, and their interaction. The coefficients on the interaction term are positive and highly significant, confirming that the boll weevil had a greater positive impact on black enrollment rate than white enrollment rate.Footnote 15 The results shown in Table 2 reveal that the arrival of the boll weevil, an exogenous, negative shock to cotton production, increased the enrollment rate of blacks and reduced the racial gap in enrollment by 14.6 percent at the 1914 mean. Moreover, the boll weevil accounts for 30 percent of the convergence in black and white enrollment rates between 1914 and 1929 in Georgia.Footnote 16
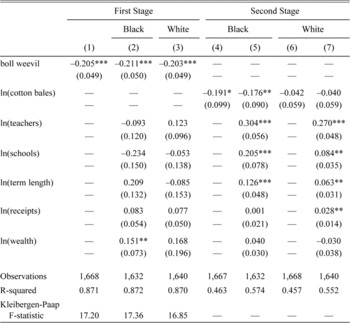
Table 3 presents two-stage least-squares estimates of the model given by equations (1) and (2) with log enrollment rate as the dependent variable. The first-stage results, presented in columns (1) through (3), reveal a strong negative effect of the boll weevil on cotton production in Georgia, consistent with the work of Lange, Olmstead, and Rhode (Reference Lange, Olmstead and Rhode2009). The −0.205 coefficient on the presence of the boll weevil in column (1), for example, suggests that the boll weevil was associated with a 19 percent (e –0.205 – 1) decline in total output. This result is robust and highly significant across specifications. The fact that the estimated effect of the boll weevil on cotton remains almost unchanged when controls for either race are included suggests that the boll weevil is a good instrument. Furthermore, the first-stage Kleibergen-Paap F-statistic for the excluded instrument ranges from 16.85 to 17.36, allaying concerns that the boll weevil is a weak instrument.Footnote 17 In summary, these first-stage results confirm the relevance of the boll weevil and suggest that it is a strong instrument for cotton production.Footnote 18
2SLS ESTIMATES OF COTTON'S EFFECT ON ENROLLMENT RATE

* = Significant at the 10 percent level.
** = Significant at the 5 percent level.
*** = Significant at the 1 percent level.
Notes:
Standard errors adjusted for clustering by county in parentheses. All regressions include county and year fixed effects. The dependent variable in the first stage is log cotton bales ginned, and the dependent variable in the second stage is log enrollment rate.
Sources:
See the text.
The second-stage results, also shown in Table 3, suggest large racial differences in schooling response to changes in cotton production. The −0.191 coefficient on log cotton bales in column (4) suggests that a 10 percent reduction in cotton production caused a 2 percent (0.9–0.191 – 1) increase in the school enrollment rate of blacks. The model in column (5) shows this result is robust to the inclusion of race-specific school quality and wealth controls. As for whites, the coefficient for log cotton bales in column (6) suggests that a 10 percent reduction in cotton production led to a 0.4 percent increase in enrollment rate. However, the relationship between cotton and white enrollment is not statistically significant. The differential results by race are consistent with the hypothesis that blacks were more sensitive to changes in cotton production than whites.
The results for the school quality controls in Table 3 are as expected. The number of teachers, number of schools, term length, and school receipts are all positively correlated with enrollment rate. Interestingly, the number of schools appears to have a greater effect on enrollment rate for blacks than whites: a 10 percent increase in the number of schools is associated with a 2 percent increase in enrollment rate for blacks but only a 0.8 percent increase for whites. The racial difference might be because an increase in the number of schools reduced the cost of attendance for blacks more than whites, since whites had better access to transportation.
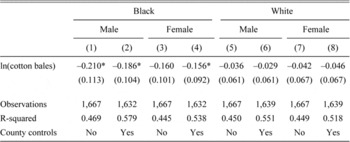
The effect of cotton production on enrollment rates across sex is also worth exploring. If females had a lower marginal product of labor in the cotton harvest than males, then their school enrollment might be less affected by cotton production. Indeed, the gap between the male and female enrollment rate of black children, as seen in Table 1, may be in part due to a higher demand for black males in the production of cotton. Table 4 displays the second-stage results of 2SLS regressions of log enrollment rate broken down by race and sex. A 10 percent decrease in cotton production led to a 2.2 percent increase in the enrollment rate of black males (column [1]) and a 1.7 percent increase in the enrollment rate of black females (column [3]). The magnitude of these effects is only slightly reduced by the addition of wealth and school quality controls, while the coefficients are statistically significant at the 10 percent level. However, the estimated coefficients for black males and females are not statistically different from one another. As shown in columns (5) through (8), the effects of cotton on the enrollment rate of white males and females are negative but small and statistically insignificant.
2SLS ESTIMATES OF COTTON'S IMPACT ON LOG ENROLLMENT RATES BY SEX

* = Significant at the 10 percent level.
** = Significant at the 5 percent level.
*** = Significant at the 1 percent level.
Notes:
Presence of the boll weevil is the instrumental variable. Standard errors adjusted for clustering by county in parentheses. All regressions include county and year fixed effects. Even columns include county-level wealth and school quality controls.
Sources:
See the text.
To understand the mechanisms at play, it is necessary to consider how enrollment responded relative to the timing of the boll weevil's arrival. Lange, Olmstead, and Rhode (Reference Lange, Olmstead and Rhode2009) show that cotton production increased just prior to the insect's arrival, suggesting that farmers attempted to produce a final big crop when the pest's arrival was eminent. If farmers pulled children out of school to help with these large, pre–boll weevil harvests, then the estimates in Table 2 may overstate the net effects of the boll weevil on enrollment rates, due to an Ashenfelter dip. Considering the schooling response relative to the boll weevil's arrival date addresses this concern.
Therefore, I replace the indicator for the presence of the boll weevil with six leads and four lags for the year of its arrival. The empirical specification of the reduced form becomes
![\[
\begin{array}
y_{ct}=\Sum^{k \leqslant 4}_{k \geqslant -6, k \ne 0} \beta_k * 1
[t - BW_c = k] +\gamma X_{ct} +\theta_c+\theta_t+\phi_c t+\varepsilon_{ct},
\end{array}
\](https://static.cambridge.org/binary/version/id/urn:cambridge.org:id:binary:20160921010151552-0225:S0022050715001515:S0022050715001515_eqn3.gif?pub-status=live)
where BW c denotes the year the boll weevil entered county c. The specification includes the county-level controls for school quality and wealth (X ct ) and county-specific linear time trends. The indicator for the year of the boll weevil's arrival is omitted, so all effects are measured relative to the year of contact. A single categorical variable is used to indicate four or more years after contact, and a separate variable indicates six or more years before contact. Thus, β –6 represents the long-run average effect six or more years before the weevil arrived, and β 4 represents the average effect four or more years after contact.
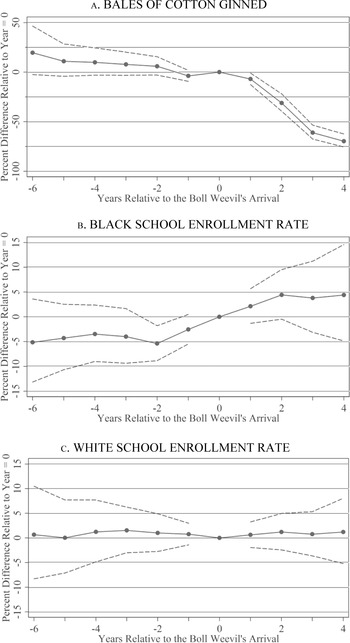
Figure 4 presents the transformed coefficients on the leads and lags, with solid lines representing main effects and dashed lines indicating 95 percent confidence intervals. Panel (a) shows that the boll weevil had a relatively small immediate impact on bales of cotton ginned, but three years after its arrival production had fallen by more than 50 percent. This result is similar to that of Lange, Olmstead, and Rhode (Reference Lange, Olmstead and Rhode2009).
COTTON PRODUCTION AND SCHOOL ENROLLMENT RELATIVE TO THE BOLL WEEVIL'S ARRIVAL

Panel (b) of Figure 4 shows that the enrollment rate of blacks began to increase the year prior to the boll weevil's arrival; two years after the arrival date, the black enrollment rate had increased by roughly 5 percent relative to the year of arrival, with no sign of a reversal four years after being hit. This suggests that household schooling decisions fully responded to the presence of the boll weevil two years after its arrival. The increase in enrollment just prior to contact suggests there may have been anticipation effects. Children may have been enrolled in school with the expectation that the boll weevil's impending arrival would increase the relative returns to education, as farming cotton no longer seemed a prudent career choice.Footnote 19 Most importantly, there is only a slight dip in enrollment rate two years prior to contact, which is not statistically different from the pre–boll weevil trend, allaying the above mentioned concern regarding the possibility of an Ashenfelter dip inflating estimates of the boll weevil's effect.Footnote 20 In comparison, the effect of the leads and lags of the boll weevil's arrival on the enrollment rate of whites yields a remarkably flat line (shown in panel [c]).
Alternative Measures of Education
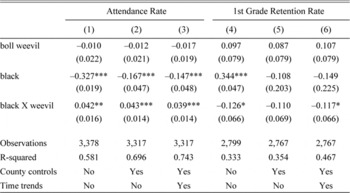
I now consider the boll weevil's impact on alternative educational outcomes starting with attendance rate, defined as average daily attendance divided by the school-age population. Columns (1) through (3) of Table 5 present the results of regressions testing for racial differences in the boll weevil's impact on log attendance rates. The 0.042 coefficient on the interaction term black X boll weevil in column (1) implies the boll weevil differentially increased black attendance rates, showing a relative gain of 4.3 percent; this reinforces the results for enrollment.Footnote 21
THE BOLL WEEVIL'S IMPACT ON OTHER EDUCATION MEASURES

* = Significant at the 10 percent level.
** = Significant at the 5 percent level.
*** = Significant at the 1 percent level.
Notes:
Standard errors adjusted for clustering by county in parentheses. All regressions include county and year fixed effects. Columns (2), (3), (5), and (6) include race-specific controls for wealth and school quality. Columns (3) and (6) include county-specific linear time trends.
Sources:
See the text.
Also, the first grade retention rate (the proportion of children held back to repeat first grade) might have been affected by the demand for child labor in cotton production. The infrequent attendance of blacks, perhaps due to their participation in the cotton harvest, led to a distortion in the age-for-grade distribution because some children did not attend enough days of school to advance from one grade to the next. Additionally, irregular enrollment often led to the repetition of grades. Thus, as southern farmers moved away from cotton, the first grade retention rate of blacks is expected to fall. The Georgia Department of Education did not report the first grade retention rate directly. But Finis Welch (Reference Welch, Ashenfelter and Rees1973) argues that the ratio of first to second grade enrollment serves as a good proxy for the first grade retention rate in the absence of growth in enrollment. Since the above results suggest that the overall enrollment rate changed significantly with the arrival of the boll weevil, at least for blacks, this simple ratio must be adjusted for the growth rate of enrollment (as described in Online Appendix B).
The results of pooled reduced-form regressions of log first grade retention on the indicator for presence of the boll weevil, an indicator for blacks, and their interaction are also presented in Table 5. The results in column (4) suggest that the boll weevil reduced the first grade retention rate of blacks 13 percent more than it reduced that of whites, and is significant at the 10 percent level. Columns (5) and (6) show the result to be fairly robust to the inclusion of county-specific linear time trends and wealth and school quality controls. This suggests the arrival of the boll weevil also reduced the racial difference in first grade retention.
THREATS TO VALIDITY
Summer Rainfall as an Alternative Instrument
One concern with using the boll weevil as a natural experiment is that such a dramatic and sustained drop in cotton production would likely induce structural changes in the local economy, affecting, for example, wealth and adult wages, which directly influence schooling. While reductions in wealth and income negatively affect school enrollment, implying that the above estimates understate the effect of cotton production on schooling, other changes may imply the opposite. If the relative returns to education increased, for example, then the second-stage estimates shown in Table 3 would be biased away from zero. An alternative instrument with a more transient impact on cotton production would be unlikely to have long-run impacts on the local economy and, therefore, useful in confirming the above results.
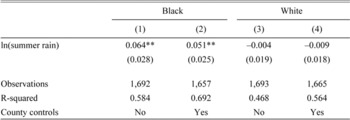
One potential alternative instrument with a seasonal effect on cotton is total summer rainfall.Footnote 22 With regard to relevance, too little rainfall does not seem to have been a problem in Georgia, but too much rain was. Gavin Wright (Reference Wright1986, p. 81) notes that cotton required at least 25 inches of precipitation in the absence of irrigation—a condition met for every county-year in the sample. Prolonged periods of soil moisture, however, invited pathogens that reduced yield (Tharp and Young Reference Tharp and Young1939). Indeed, “uniformly dry and hot weather during the growing season always contributes to the best results in cotton growing” (U.S. Bureau of the Census 1912, p. 9). As for the exclusion restriction, since school was not in session during the summer, rainfall during this season would have no direct effect on school enrollment.Footnote 23 However, caution should be observed as summer rainfall may affect schooling through omitted variables.
Table 6 presents reduced-form effects of log summer rainfall on log enrollment rate by race. The results in columns (1) and (2) confirm a positive and statistically significant relationship between summer rainfall and enrollment rate for blacks. The coefficient of 0.064 in column (1) suggests that a 10 percent increase in summer rainfall led to a 0.6 (1.10.064 – 1) percent increase in the black enrollment rate.Footnote 24 The estimates for whites suggest a negative correlation between summer rainfall and enrollment rates, but once again they are not statistically significant.
REDUCED-FORM REGRESSIONS OF LOG ENROLLMENT RATE ON SUMMER RAIN

* = Significant at the 10 percent level.
** = Significant at the 5 percent level.
*** = Significant at the 1 percent level.
Notes:
Standard errors adjusted for clustering by county in parentheses. All regressions include county and year fixed effects. Columns (2) and (4) include race-specific controls for wealth and school quality.
Sources:
See the text.
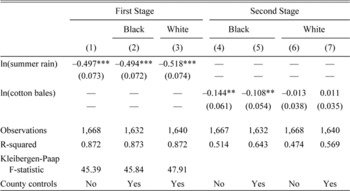
Table 7 presents 2SLS regressions of log enrollment rate on log cotton bales with log summer rain as the instrument. The first-stage results, displayed in columns (1) through (3), show that log summer rain is a very strong instrument for cotton production; the F-statistic for the excluded instrument is above 45 in every specification. The −0.496 coefficient in column (1) suggests that a 10 percent increase in summer rainfall results in a 5 percent decrease in cotton output—consistent with the observation that excessive rainfall made the crop susceptible to pathogens. The result is highly significant and robust across specifications, confirming the relevance of summer rainfall to cotton production.
2SLS ESTIMATES OF COTTON'S EFFECT ON ENROLLMENT RATE, SUMMER RAIN

* = Significant at the 10 percent level.
** = Significant at the 5 percent level.
*** = Significant at the 1 percent level.
Notes:
Standard errors adjusted for clustering by county in parentheses. All regressions include county and year fixed effects. The dependent variable in the first stage is log cotton bales ginned, and the dependent variable in the second stage is log enrollment rate. Columns (2), (3), (5), and (7) include race-specific controls for wealth and school quality.
Sources:
See the text.
The results of the second stage, presented in columns (4) through (7), look quite similar to those presented in Table 3. They show that reductions in cotton production have a positive and statistically significant effect on the enrollment rate of blacks, while having little, if any, effect on white enrollment. These estimates support the relevance of the marginal product of child labor in the cotton harvest to the household schooling decision, at least for blacks, allaying concern that alternative channels drive the main result. However, the estimates presented here are slightly smaller in magnitude than those in Table 3, suggesting that some of the gains in black enrollment as a result of the boll weevil's arrival may be due to an increase in the relative returns to schooling.Footnote 25
Concurrent Shocks to Schooling
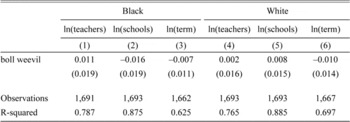
Another possible threat to the validity of the boll weevil as an instrument concerns shocks to school quality contemporaneous with the insect's arrival. For example, the school consolidation movement may have spread from the southwest to the northeast of Georgia in a manner similar to the boll weevil. Table 8 shows results from regressions of measured school quality, in logs, on the indicator for the presence of the boll weevil. There is no significant relationship between the boll weevil's spread and the number of teachers, number of schools, or term length for either race. Not only do these results ameliorate concerns of validity, but they also help rule out shocks to the supply of schooling as a channel linking cotton production and school enrollment.
REDUCED-FORM REGRESSIONS OF SCHOOL QUALITY ON BOLL WEEVIL

* = Significant at the 10 percent level.
** = Significant at the 5 percent level.
*** = Significant at the 1 percent level.
Notes:
Standard errors adjusted for clustering by county in parentheses. All regressions include county and year fixed effects.
Sources:
See the text.
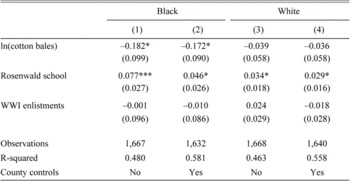
Other events having a significant impact on schooling during this period were the construction of Rosenwald schools for black children and WWI. If Rosenwald school construction or participation in WWI were correlated with the boll weevil's arrival, then this could lead to spurious correlation between the presence of the boll weevil and school enrollment rates. The year of the boll weevil's arrival is not a significant predictor of early Rosenwald school construction or WWI enlistments. Nevertheless, I add county-level controls for the presence of a Rosenwald school and the number of new military enlistments over the school-age population during the years of U.S. involvement in WWI. The second-stage results are presented in Table 9. The estimates shown are comparable in magnitude and significance to those presented in Table 3.Footnote 26 Therefore, the main findings are robust to controlling for these specific events.
ROBUSTNESS OF 2SLS ESTIMATES OF THE IMPACT OF COTTON PRODUCTION ON ENROLLMENT RATE

Sources:
* Significant at the 10 percent level.
** Significant at the 5 percent level.
*** Significant at the 1 percent level.
Notes:
Presence of the boll weevil is the instrumental variable. Standard errors adjusted for clustering by county in parentheses. All regressions include county and year fixed effects. Columns (2) and (4) include race-specific controls for wealth and school quality.
Sources:
See the text and Online Appendix A.
Shifting Migration Patterns
Since this analysis uses a panel of counties rather than individuals, there might be concern that migration is biasing the results. Shifting migration patterns concurrent with the boll weevil's arrival would be troubling if, on average, either in-migrants had a higher preference for schooling or out-migrants had a lower preference for schooling. Both cases would upward bias the results presented in Table 2. There is significant anecdotal evidence that agricultural workers migrated in advance of the boll weevil, trying to stay ahead of its devastation (Giesen Reference Giesen2011). Lange, Olmstead, and Rhode (Reference Lange, Olmstead and Rhode2009) also show that local populations swelled over the five years leading up to the boll weevil's arrival and declined thereafter, with the trend in the black population mirroring that of the total population.
There is no reason to think that the population migrating ahead of the boll weevil had a higher preference for education than the resident population. Moreover, if they did, then one would expect to see a rise in enrollment rates prior to contact with the boll weevil followed by a fall in enrollment rates after its arrival. However, Figure 4(b) shows no evidence of a fall in enrollment rates after contact with the boll weevil. Alternatively, if the children of migrants were less likely to enroll in school, perhaps because they were more likely to work in the cotton fields, then one would expect a fall in enrollment rates over the five years leading up to contact with the boll weevil, but Figure 4(b) shows no evidence of this pattern either. Additionally, recent work shows that black migrants leaving the South during this period were positively selected on the basis of education (Collins and Wanamaker Reference Collins and Wanamaker2014). This suggests, if anything, my results are slightly downward biased due to migration.
Trends in Child Labor
Between 1910 and 1920 there was a significant decrease in the number of gainfully employed children that “was not limited to either sex, to any part of the county, to any field of occupation, or to any special occupations” (U.S. Bureau of the Census 1924, p. 11).Footnote 27 Moreover, this decrease represents a deviation from the trend, as the employment rate of 10 to 15 year olds had remained fairly constant since 1890. This decline in child labor could confound the estimates presented in this work if it was correlated with, and not caused by, the spread of the boll weevil across Georgia. However, the fact that both black and white children experienced similar declines in employment over this period, and yet only the schooling behavior of blacks changed in response to the boll weevil, suggests that these child labor trends were secular.
CONCLUSION
This article documents the effect of the cotton economy on educational outcomes in the early twentieth-century Southern United States. More specifically, it considers how reductions in cotton production following the arrival of the boll weevil affected school enrollment. While there is little evidence that the cotton economy played a role in the schooling decision of whites, my results clearly show that the demand for child labor in cotton production suppressed the enrollment rate of blacks.
The differential response to changes in cotton production by race is expected because white children were less likely to be engaged in farm work than were black children. This might be because whites, who were wealthier on average than blacks, relied more on hired labor rather than their children to harvest cotton. Still, the lack of a significant relationship between cotton production and the enrollment rate of white children is surprising, as a non-trivial share reported working as farm laborers in 1910. Possible explanations include the following: First, if the boll weevil had a greater negative effect on the wealth of whites, the estimates for whites, relative to those for blacks, might be more biased toward zero due to the role of the wealth effect in household schooling decisions regarding both attendance and enrollment. However, the fact that the estimates are little changed by the inclusion of average assessed wealth should mitigate this concern.
Second, Lange, Olmstead, and Rhode (Reference Lange, Olmstead and Rhode2009) show that farmers responded to the boll weevil by pushing up the harvest season. Since white schools had longer terms on average, it seems likely that they started earlier in the fall than black schools (as was the case in Hancock County). This suggests that the conflict between harvest and schooling was reduced by a proportionately greater amount for blacks, relative to whites, by the arrival of the boll weevil. This might explain the lack of a significant effect of the boll weevil on white enrollment, but it fails to explain the insignificant results for whites when using summer rainfall, which tends to delay the harvest. Neither does this explain the lack of a response in the attendance behavior of whites to the boll weevil. Unfortunately, the reports of the Georgia Department of Education contain only scattered information on the timing of school terms. Thus, this remains an open question for future research.
Nevertheless, the differential effect by race implies that the shift away from cotton after the coming of the boll weevil significantly reduced the black-white education gap. Furthermore, other events that reduced the demand for child labor generated by cotton, such as the Agricultural Adjustment Act and mechanization of cotton production, may have contributed to convergence of the racial gap in education through the mid-twentieth century. Indeed, John Cogan (Reference Cogan1982) argues that mechanization of farm production, and principally diffusion of the mechanical cotton picker, explains a reduction by one-half in southern black teenage employment between 1950 and 1970. If these black teenagers were going to school instead, then mechanization could explain the continued narrowing of the black-white differential in years of schooling through the 1970s.
The results of this article demonstrate that the production of a child labor–intensive crop negatively affected educational outcomes in the early twentieth century. This gives new insight into the role of the seasonal demand for child labor in agricultural production in the household schooling decision. Further work might consider long-run effects of the boll weevil on years of schooling, migration, and labor market outcomes using linked census data. Additionally, an examination of how the household schooling decision responds to different local cropping patterns would be beneficial to the literature. Understanding how school enrollment and attendance are affected by the demand for labor generated by agriculture is key to understanding how to increase educational attainment in rural areas of the developing world today.