Implications
Feeding higher volumes of milk or milk replacer (MR) to dairy calves is becoming increasingly popular. However, concern arises regarding glucose and insulin kinetics of supplying a high plane of nutrition at a low feeding frequency, meaning that meal sizes are large. Our results show that feeding 8 l of MR per day at a feeding frequency of 2×compared to 4×daily (4 l or 2 l meal sizes) increased feeder visits, but not other hunger-related behaviors and had minimal impact on glucose and insulin kinetics in pre- and post-weaned Holstein calves.
Introduction
Increasingly in the dairy industry calves are fed an elevated plane of milk or MR (⩾8 L or 20% of birth BW), as replacement heifers raised using this feeding regimen show greater pre-weaning growth (Jasper and Weary, Reference Jasper and Weary2002; Khan et al., Reference Khan, Lee, Lee, Kim, Ki, Hur, Suh, Kang and Choi2007), fewer signs of hunger (Vieira et al., Reference Vieira, Guesdon, De Passille, von Keyserlingk and Weary2008) and have the potential for greater future milk production (Soberon et al., Reference Soberon, Raffrenato, Everett and Van Amburgh2012). Calves are typically fed twice daily resulting in meal sizes of 4 l or more per feeding when offered an elevated plane of nutrition. This contrasts natural suckling from the dam (Egli and Blum, Reference Egli and Blum1998), or if given free access to an automated feeder, where calves consume in excess of 7 to 10 meals per day (De Passillé et al., Reference De Passillé, Borderas and Rushen2011).
Feeding larger meals pre-weaning at a low feeding frequency (i.e. one to two meals per day) may have metabolic consequences for the calf. Such a feeding regimen has been linked to reduced insulin sensitivity in 6 to 19-week-old veal calves fed 8 l per day in two meals (Hostettler-Allen et al., Reference Hostettler-Allen, Tappy and Blum1994), and more recently, in younger milk fed calves (1 to 9 weeks old) offered 8 l per day, twice daily (Bach et al., Reference Bach, Domingo, Montoro and Terré2013). Reduced insulin sensitivity can lead to impaired energy and protein metabolism, subsequently reducing growth rates (Van den Borne et al., Reference Van den Borne, Verstegen, Alferink, Giebels and Gerrits2006; Vicari et al., Reference Vicari, Van Den Borne, Gerrits, Zbinden and Blum2008). The potential carry over effect on glucose metabolism into adult life is unknown. Previous literature comparing a high v. a low plane of nutrition in pre-weaned calves, also offered calf starter, have noted minimal impact on post-weaning insulin and glucose kinetics when feeding twice daily (Yunta et al., Reference Yunta, Terré and Bach2015; MacPherson et al., Reference MacPherson, Berends, Leal, Cant, Martin-Tereso and Steele2016). However, the impact of pre-weaning feeding frequency at an elevated plane of nutrition on both pre- and post-weaning insulin sensitivity has not been studied. In line with previous literature (Hammon et al., Reference Hammon, Schiessler, Nussbaum and Blum2002; Jensen, Reference Jensen2006; Borderas et al., Reference Borderas, de Passillé and Rushen2009), we hypothesize that by increasing feeding frequency and decreasing meal size, calves will display fewer hunger behaviors and demonstrate improved insulin sensitivity as the nutrient load is more evenly spread across smaller meals throughout the day (Kaufhold et al., Reference Kaufhold, Hammon, Bruckmaier, Breier and Blum2000; Vicari et al., Reference Vicari, Van Den Borne, Gerrits, Zbinden and Blum2008). Thus, the objective of this study was to determine if increasing the feeding frequency from two to four meals per day at an elevated plane of MR (8 l/day) in calves weaned at two months would decrease hunger behaviors and improve glucose and insulin kinetics in Holstein calves.
Material and methods
All animal procedures were pre-approved by the Animal Care and Use Committee for Livestock at the University of Alberta and conducted according to the guidelines of the Canadian Council on Animal Care (CCAC) (2009).
Animals and experimental design
Ten male Holstein calves received a minimum of 4 l of colostrum in the first 24 h of life. Following colostrum, calves were fed 2 l of commercial MR (Grober Excel Pro Gro, Grober Nutrition, Cambridge, ON, Canada) twice daily until 2.8±0.5 days of age (42.2±1.8 kg BW) when calves were transported from local dairy farms to the University of Alberta animal experimental facilities. Calves were group housed in a single pen (6×24 m) bedded with wood shavings. Calves were blocked by BW and randomly assigned to two groups, each receiving a total of 8 l MR per day (150 g MR powder/l) in: (1) two (2×; 4 l/meal) or (2) four (4×; 2 l/meal) feedings per day through the use of automated feeders (DeLaval, Tumba, Sweden). Calves were adapted to the use of automated feeders and the elevated plane of nutrition over 5 days. The MR had a metabolizable energy (ME) content of 14.6 MJ/kg and contained 26% CP, 18% crude fat, 0.15% crude fiber, 7.5% ash, 0.95% calcium, 0.70% phosphorus, 0.55% sodium, 40 000 IU/kg vitamin A, 4000 IU/kg vitamin D3, 150 IU/kg vitamin E and 0.3 mg/kg selenium (dry matter (DM) basis). The ingredients of the MR included skim milk powder (50%), whey powder, vegetable oil, delactosed whey powder and premix.
The experimental treatments were implemented when calves were 8.8±0.49 days of age. Calves were entitled to access MR at 1000 and 2000 h for the 2×treatment, and 0500, 1000, 1500 and 2000 h for the 4×treatment. However, as calves had free-access to the feeders, feeding times varied for each calf. Yet, calves on the 2×treatment fed within at least 9 h after the previous meal, and calves on the 4×treatment fed within at least 5 h after the previous meal. Calves remained on feeding treatments for 7 weeks. Feeding was stepped down by 1 l MR/day during week 8, until weaning at week 9. A pelleted calf starter (19% CP Calf Starter Pellet; Hi-Pro Feeds, Sherwood Park, AB, Canada) supplemented with rumensin (60 mg/kg) was offered ad libitum via automated feeders. It had a ME content of 12.7 MJ/kg, 19% CP, 4.7% crude fat, 6% crude fiber, 0.35% sodium, 0.9% calcium, 0.53% phosphorus, 30 000 IU/kg vitamin A, 4400 IU/kg vitamin D3, 245 IU/kg vitamin E and 0.3 mg/kg selenium (DM basis). The automated solid feeder was located directly adjacent to the MR feeder and separated by a panel.
Individual intake of pelleted calf starter and MR were recorded daily through the use of their respective automated feeders. Calf starter intake was measured by feed disappearance in gram/day. Body weight was measured upon arrival (week 0) and weekly thereafter at 1200 h, except for weeks 4, 7 and 10 where calves were weighed at 0800 h to coincide with jugular catheter placement.
Blood sampling
Jugular catheters (36” Tygon Microbore tubing 0.015” and OD 0.018 cm; Saint Gobain Performance Plastics Corp., Malvern, PA, USA; 12 gauge 2” stainless steel needle; Jorgensen Labs, Loveland, CO, USA) were placed on weeks 4, 7and 10 and remained for ~72 h for postprandial blood sample collection, in addition to a glucose tolerance test (GTT). Catheters were flushed with 2 to 5 ml heparinized saline (10 000 IU/ml) after every sample collection. Blood samples were collected using 5 ml syringes, then transferred to a 4 ml lithium heparin VacutainerTM (BD Canada, Mississauga, ON, Canada) on week 4, and a 6 ml lithium heparin VacutainerTM on weeks 7 and 10, then immediately placed on ice. All blood samples were immediately centrifuged at 3000×g for 15 min, and plasma stored at −20°C. Plasma samples were analyzed for glucose on a 96-well plate using peroxidase glucose oxidase enzyme and dianisdine dihydrochloride (Sigma, MI, USA). Insulin was analyzed on a 96-well plate using a bovine insulin ELISA kit (Mercodia, Bovine Insulin Elisa, 2014, Uppsala, Sweden). All plates were analyzed at a wavelength of 450 nm with a plate reader (SpectraMax 190; Molecular Devices Corp., Sunnyvale, CA, USA). For both glucose and insulin quantification a CV below 5% was established for acceptance. The inter- and intra-assay CV was 0.8% and 1.2% for glucose, and 1.9%and 2.6% for insulin, respectively.
For determination of postprandial glucose and insulin concentrations nine blood samples were collected at 0, 30, 60, 90, 120, 150, 180, 210 and 240 min relative to the 1000 h MR feeding on weeks 4 and 7. To manage this sampling with one automated feeder, the calf was sampled once it naturally entered the feeding station and the milk was allowed to flow to the nipple after the baseline blood sample was collected. A GTT was administered on the day following postprandial sampling on weeks 4 and 7. An additional GTT was administered independently on week 10, consisting of a glucose infusion (50% dextrose at 540 mg/kg of BW0.75; DMVet Inc., QC, Canada; MacPherson et al., Reference MacPherson, Berends, Leal, Cant, Martin-Tereso and Steele2016) via the jugular catheter at 1000 h. Sampling on week 10 was necessary to assess carry-over effects from the pre-weaning period to the post-weaning period. Blood samples were collected at −15, 0, 5, 10, 20, 30, 45, 60, 90, 120, 180 and 240 min relative to the glucose infusion. To ensure basal plasma glucose levels were achieved before each infusion, calves were denied access to all feed (i.e. fasted) for 12 h and their morning MR meals were delayed until sampling was finished (4 h for 2×and 9 h for 4×) for weeks 4 and 7. During sampling calves were also denied access to calf starter and water.
Calf behavior
Behavioral observations were made on the same day each week, from weeks 4 to 10, for a total of 12 h, divided into morning (0800 to 1400 h) and evening (1800 to 2400 h) observational periods. Measurements began on week 4, following three weeks of environmental adaption and to coincide week-wise with insulin sensitivity measurements. Behavior was recorded continuously for 36 h using three cameras (DeLaval FMC60, Peterborough, ON, Canada) to view the entire pen. Recording hours captured MR feedings shared by both treatments, where time ‘0’ was standardized as the start of each meal for each calf. Due to the variable nature of MR feeding times, within each observation window, the longest observation interval on either side of a MR feeding, for each calf, was±1.5 h from feeding. Thus, equal lengths of time before- and after-feeding were used to record anticipation behaviors and behaviors resulting from feeding. Post-weaning (weeks 8, 9 and 10) observation intervals were 0830 to 1130 h (AM) and 1830 to 2130 h (PM) as most calves drank MR during these times pre-weaning. During the step down (week 8), MR meal allowance times were more varied throughout the pre-set observation periods than in previous weeks, as such four calves did not meet the full 3 h observation interval (within 20 min).
Observed behaviors included lying, feeder occupancy, non-nutritive sucking and cross-sucking were analyzed for total and mean durations (min) and frequencies per hour by three trained observers for the morning and afternoon periods. Observers were trained by a primary observer who verified all behaviors were identified as defined in the study ethogram in order to ensure inter-observer reliability. A calf was considered to be lying when the calf’s body was in a horizontal or recumbent position (sternal or lateral) and in contact with the ground. Non-nutritive sucking was defined as when the feeder nipple was in the mouth of the calf without the calf receiving a meal reward, while cross sucking was defined as a calf nosing the penile sheath of another calf, as we could not determine if the sheath was in the mouth of the calf from the cameras vantage points. For both sucking behaviors, a 5 s bout criterion interval was utilized to distinguish between bouts. Feeder occupancy was defined as when a calf’s entire body entered a feeder until when the entire body left the feeder, and a bout criterion interval of 60 s was used to distinguish between bouts. Finally, daily visits (rewarded and unrewarded) were recorded by the automated MR and starter feeders.
Calculations and statistical analysis
Metabolizable energy intake was calculated according to National Research Council (2001). Metabolizable energy, MR intake, starter intake and average daily gain (ADG) were analyzed separately for pre-weaning (days 1 to 56) and post-weaning periods (days 57 to 70), and overall (days 1 to 70). For GTT and postprandial measurements, the time to maximum concentration (T max), maximum concentration (C max), baseline concentration and change in concentration (delta) were calculated for glucose and insulin. In addition, the positive incremental area under the curve (AUC) was calculated using the trapezoidal rule for glucose and insulin concentrations above the baseline levels (MacPherson et al., Reference MacPherson, Berends, Leal, Cant, Martin-Tereso and Steele2016). The AUC was calculated over 240 min for both the GTT and postprandial measurements (AUC240). For the GTT, the clearance rate (CR) of glucose and insulin were determined using the method described by Pires et al. (Reference Pires, Souza and Grummer2007).
 $$\eqalign{ {\rm Clearance}\,{\rm rate}\,\left( {{\rm \,\%\,\,/\,min}} \right){\rm {\equals}} \cr & \hskip-40pt \left\{ {\left( {{\rm ln}\left[ {ta} \right]{\rm --ln}\left[ {tb} \right]} \right){\rm \,/\,} \left ({ta{\rm -- }tb} \right)} \right\} {\times}{\rm 100}$$
where [ta] and [tb] is the concentration of insulin or glucose at time (ta) or (tb), respectively. In addition, an insulin sensitivity index was calculated using the method described by Christoffersen et al. (Reference Christoffersen, Ribel, Raun, Golozoubova and Pacini2009).
Data were analyzed using the MIXED procedure of SAS (SAS, v 9.4, Cary, NC, USA) with time (week) as repeated measures for BW, MR intake, ME intake, starter intake and ADG. Initial BW was considered a covariate for the final weight analysis. Calf was the experimental unit and random effect, treatment, week and interactions of treatment by week were fixed effects. The model included week as a repeated measure and was run using the covariance structure with the lowest Akaike’s information criterion value which was either compound symmetry or auto regressive depending on the variable, and the Kenward–Roger adjustment was used. Before analyses, data were screened for normality using the UNIVARIATE procedure of SAS, and logarithmically transformed (insulin for GTT and postprandial) where necessary. Data presented in all tables represent raw means. Multiple comparisons were assessed using the PDIFF options in LSMEANS statement with Tukey adjustment.
Behavioral data were screened for normality using the UNIVARIATE procedure in SAS and was found to have a Poisson distribution for all variables. Behavioral data were then analyzed using the GLIMMIX procedure of SAS (v. 9.4) specifying a Poisson distribution and log link function in the model. Calf was the experimental unit and random effect with treatment, week, time of day and interactions of treatment by week, and treatment by time of day as fixed effects. The data for time of day interactions is not shown. For all analyses significance was declared when P⩽0.05 and trends were declared when 0.05<P⩽0.10.
Results
BW and intake
Milk replacer intake (7.19±0.11 v. 7.11±0.18 l/day), starter intake (0.81±0.11 v. 0.88±0.11 kg/day) and ME intake (7.3±1.12 v. 7.0±1.12 MJ/day) were similar (P⩾0.57) between feeding frequency groups, for 2× v. 4×feeding frequencies, respectively. Similarly, final BW (112.8±4.48 v. 109.0±4.48 kg for 2× v. 4×, respectively) and overall ADG (0.92±0.06 v. 0.87±0.06 kg/day; 2× v. 4×) were similar (P⩾0.56) between treatments. No differences (P>0.05) were observed between pre- and post-weaning periods, or from weeks 1 to 10, for any measurement.
Behavioral observations
Feeding frequency did not affect lying, cross-sucking or non-nutritive sucking behaviors (Table 1). Frequency of MR feeder occupancy did not differ with feeding frequency, but calves fed 2×daily tended (P=0.07) to spend 31% more time in the feeder, than calves fed 4×daily. Calves fed twice daily also had an increased (P=0.03) number of unrewarded visits to the feeder, compared to those fed 4×daily evidenced by a 35% increase measured during the observation period (P=0.01) and a 20% increase measured throughout the entire day (P=0.03), as recorded by the automated feeder (Table 1).
Effect of milk replacer (MR) feeding frequency (2× v. 4×daily) on behavior of Holstein calves fed 8 l milk replacer/day (n=5/group)

Data are averaged across AM and PM observational periods, where the highest SEM is reported.
1 Lying time=calf’s body horizontal and all feet off the ground; Cross sucking=calf sucking or nosing the sheath area of another calf; ended when interaction stopped for more than 5 s; Non-nutritive sucking=calf sucking the feeder nipple with no milk being dispensed; ended after 5 s of no interaction; Feeder occupancy=calf’s entire body entered feeder; ended when entire body left feeder.
When treatment effect by time of day was investigated, differences between AM and PM observation periods occurred. There was an interaction effect on frequency of feeder occupancy, where 2×calves had more visits (P=0.03) during the PM observation period, compared to the AM observation period (2.8±0.37 v. 4.6±0.47, respectively).
Postprandial glucose and insulin
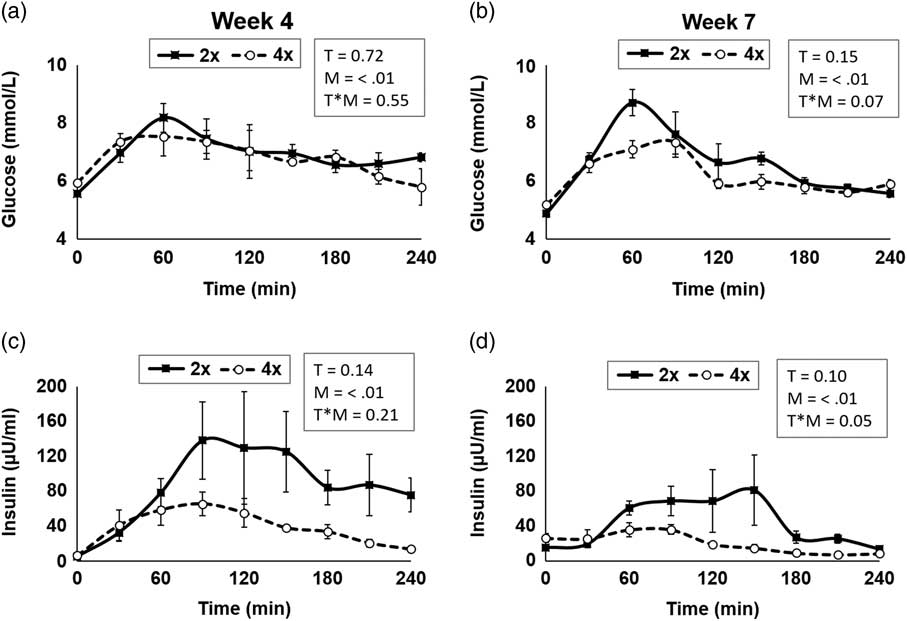
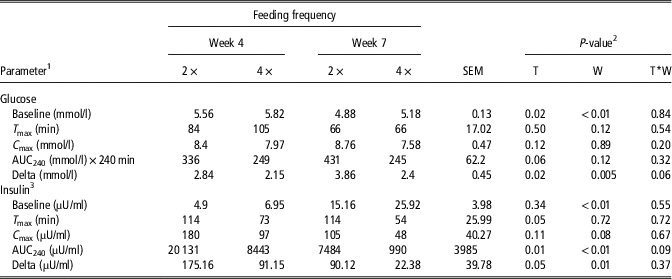
Postprandial glucose (mmol/l) measurements were not affected by the interaction of feeding frequency × week (Figure 1 and Table 2), with the exception of the maximum change in glucose concentration from the baseline (delta) which tended (P=0.06) to be higher in calves fed 2×daily at 7 weeks of age. However, the maximum change in glucose concentration from the baseline (delta) was higher in 2×, compared to 4×calves (3.35±0.42 v. 2.28±0.43 mmol/l, respectively). Basal glucose concentrations were greater (P=0.02) in 4×, compared to 2×calves (5.55±0.09 v. 5.22±0.09 mmol/l, respectively). AUC240 tended (P=0.06) to be lower in 4×, compared to 2×calves. In addition, 7-week-old calves had lower (P<0.01) basal glucose concentrations and greater changes in glucose concentrations (delta), compared to 4-week-old calves (Table 2).
Effect of milk feeding frequency on postprandial plasma glucose and insulin in dairy calves. Postprandial plasma glucose (a, b; mmol) and insulin (c, d; μU/ml) at weeks 4 and 7 of study for 240 min in dairy calves fed milk replacer (MR) 2 or 4× daily. The solid line represents calves fed MR 2×daily and the dotted line represents calves fed MR 4× daily. Data are means±SEM, n=5 per group. T=treatment; M=minute; T*M=interaction between treatment and minute.

Effect of feeding frequency on pre- and postprandial plasma glucose and insulin responses in Holstein dairy calves fed 8 l milk replacer/day (n=5/group)

1 C max=maximum plasma concentration; T max=time of maximum concentration observed, AUC=area under the concentration-time curve; Delta=the maximum change from baseline.
2 Statistical comparisons: T effects=2× v. 4×; W effects=week; T×W effects=treatment by time interaction.
3 P-values for insulin from log-transformed data.
Postprandial insulin (µU/ml) was not affected by the feeding frequency ×week interaction (Table 2). However, insulin AUC240 tended (P=0.09) to be greater in 2×calves at week 7, compared to 4×calves at week 7. Similarly, insulin AUC240 was higher (P=0.01) for 2×calves, compared to 4×calves, but decreased with increasing calf age (P<0.01). Insulin delta values decreased (P=0.02) from 133.2 to 56.3 mmol/l with increasing age, and were greater (P=0.05) for 2×, compared to 4×calves (132.6±31.2 v. 56.8±32.2 mmol/l, respectively). Basal insulin concentrations increased (P<0.01) as calves aged and C max concentrations tended (P=0.08) to decrease with increasing calf age. The time taken to reach the maximum insulin concentration (T max) was 78% longer (P=0.05) for 2×, compared to 4×calves.
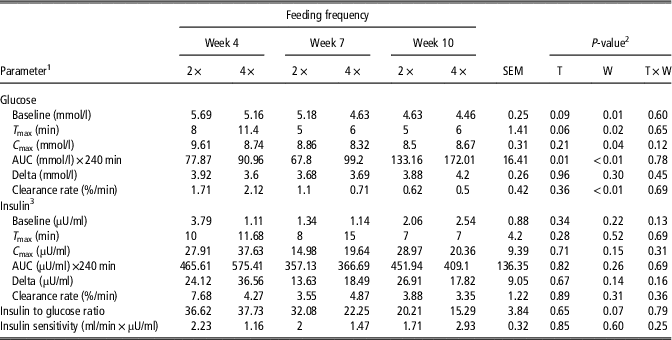
Glucose tolerance test
Plasma glucose levels (mmol/l) during the GTT reached a C max of 8.79±0.13 mmol/l within 5 to 10 min after infusion and returned to baseline within 60 min after infusion for all animals. No feeding frequency × week interaction was observed for any parameter measured (Table 3). However, the AUC240 for plasma glucose was greater (P=0.01) for 4×calves, compared to 2×calves (120.7±8.6 v. 92.9±8.2 mmol/l, respectively). Basal glucose concentrations tended (P=0.09) to be greater for 2×calves compared to 4×, and decreased (P=0.01) with age. Similarly, the CR (%/min) for plasma glucose decreased (P<0.01) with calf age. There was no effect of the interaction between feeding frequency and week, of individual effects of feeding frequency or week on calf insulin response’s during the (Table 3). In addition, the insulin sensitivity index, and insulin to glucose ratio were similar (P⩾0.25) between treatment groups and across weeks.
Effect of milk feeding frequency on plasma glucose and insulin responses to a glucose tolerance test in dairy calves

1 C max=maximum plasma concentration; T max=time of maximum concentration observed; AUC=area under the concentration-time curve; Delta=the maximum change from baseline.
2 Statistical comparisons: T effects=2× v. 4×; W effects=week; T×W effects=treatment by time interaction.
3 P-values for insulin from log-transformed data.
Discussion
Growth
The lack of differences in calf BW are comparable to previous studies conducted in veal calves. For example, a study by Kaufhold et al. (Reference Kaufhold, Hammon, Bruckmaier, Breier and Blum2000) fed veal calves a mixture of whole milk and MR for 6 weeks at a feeding frequency of either 2×daily (bucket feeding) or 6×daily using automatic feeders, and observed no difference in BW or ADG, as the calves were offered identical daily feed volumes. Similarly, Vicari et al. (Reference Vicari, Van Den Borne, Gerrits, Zbinden and Blum2008) observed no differences in BW, ADG, DM intake in Holstein-Friesian calves fed a whey-protein-based MR at 1.5× or 2×ME requirements for maintenance, at a feeding frequency of 1, 2 or 4×daily.
Behavior
The incidence of hunger behaviors decline in relation to an increase in a calf’s plane of nutrition (Soberon et al., Reference Soberon, Raffrenato, Everett and Van Amburgh2012), such that calves fed diets restricted to 4 l/day show greater signs of hunger, than those fed ad libitum or high planes of nutrition (Borderas et al., Reference Borderas, de Passillé and Rushen2009; De Passillé et al., Reference De Passillé, Borderas and Rushen2011; Miller-Cushon and DeVries, Reference Miller-Cushon and DeVries2015). However, this is the first study to examine the potential role of feeding frequency of a high plane of nutrition on hunger associated behaviors. We observed that calves fed less frequently (2×) visited the feeder more often, and up to twice as often before feed delivery, despite the lack of feed availability (unrewarded visits), than those fed 4×daily. Yet, as all calves were fed within 1 h of each other at the 1000 and 2000 h feedings, it is possible that the number of anticipatory feeder visits, before a calf being allowed access to feed, increased as a result of watching other calves gain access to feed. Similar behaviors were observed by Borderas et al. (Reference Borderas, de Passillé and Rushen2009) in dairy calves, as calves fed restricted amounts of MR visited the feeder more frequently, compared to those allowed ab libitum access. This contrasts Jensen, (Reference Jensen2006), which reported no difference in unrewarded MR feeder visits when offering meals 4×or 8×daily, perhaps due to the increased feeding frequencies compared to the current study. Differences in feeder visits between AM and PM for 2×calves indicated a greater motivation to eat during evening feeding. This could not be explained by differences in competition for feeder access, as both treatment groups were fed at approximately the same time for the evening meal. However, it may reflect an increased activity of calves during the day, compared to at night before the morning feeding. Yet, as no other treatment effects were observed on calf behavior in the current study, we are unable to conclude 2×calves were hungrier than 4×calves. The lack of difference in other hunger behaviors between treatment groups may be attributed to the elevated plane of nutrition fed to all calves. It is also possible that ad libitum access to starter negated the effects of MR feeding frequency. However, calves consumed similar amounts of starter throughout the entire experimental period, indicating that calves fed MR less frequently were not compensating by increasing their starter intakes. This suggests that while increasing feeding frequency may more closely reflect the natural feeding pattern of a calf offered ad libitum access to MR (De Passillé et al., Reference De Passillé, Borderas and Rushen2011), it had limited effects on calf behavior under the current conditions.
Glucose and insulin kinetics
To assess the effect of feeding frequency of an elevated plane of MR on glucose metabolism in calves, we examined glucose and insulin kinetics following a meal, and during a GTT. As expected, the maximum change (delta) in postprandial glucose and insulin concentrations decreased when increasing feeding frequency from 2×to 4×per day. This is in agreement with previous studies, where veal calves older than 2 months of age demonstrated improved postprandial insulin sensitivity when feeding frequency was increased above two daily feedings (Kaufhold et al., Reference Kaufhold, Hammon, Bruckmaier, Breier and Blum2000; Vicari et al., Reference Vicari, Van Den Borne, Gerrits, Zbinden and Blum2008). Postprandial hyperinsulinemia has been linked to the development of hyperglycemia and reduced insulin sensitivity. A primary driving mechanism in the development of hyperinsulinemia is a sustained high concentration of insulin for a prolonged period. This has been shown to down-regulate insulin receptors in muscle of veal calves older than 2 months of age fed at a low feeding frequency (Hostettler-Allen et al., Reference Hostettler-Allen, Tappy and Blum1994; Hugi et al., Reference Hugi, Tappy, Sauerwein, Bruckmaier and Blum1998). It is possible that glucose utilization is more efficient in young pre-weaned calves (Pantophlet et al., Reference Pantophlet, Gilbert, Van Den Borne, Gerrits, Priebe and Vonk2016), as was demonstrated by decreasing glucose clearance with age, in the current study. Although insulin response in the current study was variable, postprandial plasma concentrations of both glucose and insulin decreased with age. Our results contrast findings in veal calves experiencing reduced insulin sensitivity and elevated postprandial glucose concentrations when fed a high MR diet at a low feeding frequency (Hostettler-Allen et al., Reference Hostettler-Allen, Tappy and Blum1994; Kaufhold et al., Reference Kaufhold, Hammon, Bruckmaier, Breier and Blum2000; Vicari et al., Reference Vicari, Van Den Borne, Gerrits, Zbinden and Blum2008). The decrease in concentrations of both insulin and glucose with age may be attributed to solid feed consumption and initiation of rumen microbial fermentation which is lacking in milk-fed veal calves (Hammon et al., Reference Hammon, Schiessler, Nussbaum and Blum2002). Unlike ingested glucose from MR, which is absorbed rapidly in the small intestine, fermentation of carbohydrates from solid feed in ruminants generates volatile fatty acids after a lag phase of microbial digestion, delaying nutrient absorption and preventing 75% to 80% of carbohydrates reaching the small intestine (Huntington et al., Reference Huntington, Harmon and Richards2006). Studies investigating glucose in ruminating calves (Webb et al., Reference Webb, Heah and Wilcox1969; Khan et al., Reference Khan, Weary and von Keyserlingk2011) and lambs (Jarrett et al., Reference Jarrett, Jones and Potter1964) report decreasing concentrations as the animals age. This is supported by lower glucose concentrations in mature dairy cows, compared to young ruminating (Hayirli, Reference Hayirli2006) or veal calves (Hostettler-Allen et al., Reference Hostettler-Allen, Tappy and Blum1994).
Our GTT results suggest that all calves had similar glucose tolerances up to 7 weeks of age, regardless of the feeding frequency, indicating that 8 l MR supplied at a feeding frequency of either 2×or 4×daily are viable feeding regimens to increase calf ADG without impairing calf glucose or insulin kinetics. Studies conducted with older milk-fed veal calves using a GTT (Hostettler-Allen et al., Reference Hostettler-Allen, Tappy and Blum1994; Hugi et al., Reference Hugi, Gut and Blum1997) highlight that the age of calves (6 to 16 weeks) and targeted feeding plane (1.4 kg ADG) are likely the main driving factors behind reduced insulin sensitivity in veal calves. In addition, studies in which calves younger than 2 months of age were fed 4 l MR per meal, twice daily report either decreased insulin sensitivity (Bach et al., Reference Bach, Domingo, Montoro and Terré2013; Yunta et al., Reference Yunta, Terré and Bach2015) or unchanged insulin sensitivity (MacPherson et al., Reference MacPherson, Berends, Leal, Cant, Martin-Tereso and Steele2016) using a GTT. Notably, these studies use different methodological approaches: studies reporting reduced insulin sensitivity (Bach et al., Reference Bach, Domingo, Montoro and Terré2013; Yunta et al., Reference Yunta, Terré and Bach2015) conducted a GTT 4 h postprandial in the post-absorptive state; whereas MacPherson et al. (Reference MacPherson, Berends, Leal, Cant, Martin-Tereso and Steele2016) and the current study, imposed a 12 h feed restriction before the GTT and found no insulin response. As such, the post-absorptive state of the calves likely influenced the GTT response, providing a potential explanation for the observed increased insulin concentration at 4 h postprandial in 2×, compared to 4×calves. In addition, it is important to note that the meals fed 12 h before the GTT in the current study were of different sizes, and therefore, the 4×calves may have been in a more nutrient deprived state – as shown by the lower baseline blood glucose levels – and should be considered when evaluating the results of the GTT and the postprandial results from this study.
Expectedly, a larger meal size increased postprandial insulin and glucose concentrations in plasma, likely attributable to a two-fold increase of lactose intake per meal in the 2×v. 4×calves. However, baseline postprandial plasma glucose concentrations of all calves were similar to concentrations in suckling (Egli and Blum, Reference Egli and Blum1998) and weaned calves (Hugi and Blum, Reference Hugi and Blum1997), and were within the normal range of 4.4 to 6.9 mmol/l (Hayirli, Reference Hayirli2006; Vicari et al., Reference Vicari, Van Den Borne, Gerrits, Zbinden and Blum2008). A calf’s ability to delay the rate of nutrient delivery from the abomasum to the small intestine, or the abomasal emptying rate, when fed larger meal sizes (MacPherson et al., Reference MacPherson, Berends, Leal, Cant, Martin-Tereso and Steele2016) may be a possible mechanism for glycemic control. Similarly, Ellingsen et al. (Reference Ellingsen, Mejdell, Ottesen, Larsen and Grondahl2016) reported that calves 19 to 23 days old were able to distend their abomasum, allowing consumption of MR meals up to 7 l. Previously, feeding large meals was perceived to impair glucose metabolism and promote foregut disorders including ruminal drinking (Herrli-Gygi et al., Reference Herrli-Gygi, Steiner, Doherr, Blum, Kirchhofer and Zanolari2008) and abomasal ulcers (Ahmed et al., Reference Ahmed, Constable and Misk2002). However, when feeding 4 l meal sizes at a low feeding frequency, it is possible that delayed abomasal emptying can improve glucose metabolism, as observed in the current study. It is important to acknowledge that these results are specific to the MR used in this experiment (high in skim milk) as the ingredient composition and proportion of specific ingredients in the MR (skim milk-based v. whey-based) can alter passage rate and digestion, and glucose metabolism (Longenbach and Heinrichs, Reference Longenbach and Heinrichs1998).
Interestingly, during the GTT 2×calves had a lower glucose AUC, than 4×calves, despite similar glucose clearance rates and insulin responses indicating enhanced glucose tolerance in 2×calves. Previous data suggests that intermittent fasting or time-restricted feeding periods (⩾ 12 h) between meals can improve glucose tolerance in humans and rodents (Mattson and Wan, Reference Mattson and Wan2005; Longo and Panda, Reference Longo and Panda2016). As such, it is possible that the extended fasts between MR meals for the 2×calves positively influenced glucose tolerance, such that insulin sensitivity remained similar to that of the 4×calves both pre- and post-weaning. In agreement with the current study, no carryover effect from pre-weaning nutrition has been observed previously in weaned calves (Yunta et al., Reference Yunta, Terré and Bach2015; MacPherson et al., Reference MacPherson, Berends, Leal, Cant, Martin-Tereso and Steele2016).
Overall, increasing the daily frequency of MR meals, such that 8 l was supplied in smaller meal sizes (4×) decreased MR feeder visits, but not other observed hunger-related behaviors, perhaps due to the high plane of MR offered. It is difficult to discern the cause of increased visits to the feeder by 2×calves, as this may also reflect learned anticipatory behaviors in relation to feeding times. Conversely, variability in postprandial glucose and insulin parameters suggest increasing feeding frequency reduces the maximal level of glucose and insulin reached (delta), yet this response increases and decreases with increasing calf age, respectively. Unexpectedly, there was very little effect on glucose and insulin kinetics as demonstrated by the GTT, where insulin sensitivity was stable and only the AUC tended to be lower (glucose) or was lower (insulin) in 4×, compared to 2×calves. These findings suggest that, when calves are fed 8 l MR/day and undergo a weaning transition at 2 months of age, feeding frequency influences postprandial responses, but has little influence on insulin sensitivity, indicating that either feeding regimen is acceptable to supply pre-weaned calves an elevated level of MR in both the pre- and post-weaned calf.
Acknowledgements
The authors would like to thank the funding support provided by Alberta Milk (Edmonton, AB, Canada), Grober Animal Nutrition (Cambridge, ON, Canada) and the Natural Sciences and Engineering Research Council of Canada (Ottawa, ON, Canada). The authors acknowledge that the work was conducted as part of the first author’s thesis.
Declaration of interest
The authors declare there are no conflicts of interest.
Ethics statement
All animal procedures were pre-approved by the Animal Care and Use Committee for Livestock at the University of Alberta and conducted according to the guidelines of the CCAC (2009).
Software and data repository resources
None of the data were deposited in an official repository.