INTRODUCTION
Phosphorus (P) is essential for plants (Hawkesford et al. Reference HAWKESFORD, HORST, KICHEY, LAMBERS, SCHJOERRING, MØLLER, WHITE and Marschner2012, Raven et al. Reference RAVEN, EVERT and EICHHORN2005, Rennenberg & Herschbach Reference RENNENBERG and HERSCHBACH2013), but P deficiency occurs across natural ecosystems (Cleveland et al. Reference CLEVELAND, TOWNSEND, TAYLOR, ALVAREZ-CLARE, BUSTAMANTE, CHUYONG, DOBROWSKI, GRIERSON, HARMS, HOULTON, MARKLEIN, PARTON, PORDER, REED, SIERRA, SILVER, TANNER and WIEDER2011, Elser et al. Reference ELSER, BRACKEN, CLELAND, GRUNER, HARPOLE, HILLEBRAND, NGAI, SEABLOOM, SHURIN and SMITH2007, Vitousek et al. Reference VITOUSEK, PORDER, HOULTON and CHADWICK2010). Tropical rain forests on highly weathered soils are particularly known for P deficiency, because highly weathered soils in the tropics contain little bioavailable P (Crews et al. Reference CREWS, KITAYAMA, FOWNES, RILEY, HERBERT, MUELLER-DOMBOIS and VITOUSEK1995, Walker & Syers Reference WALKER and SYERS1976, Yang et al. Reference YANG, POST, THORNTON and JAIN2013). Tropical rain-forest trees on P-poor soils have developed mechanisms to use P efficiently (Kitayama & Aiba Reference KITAYAMA and AIBA2002, Silver Reference SILVER1994, Vitousek Reference VITOUSEK1984), and elucidating these mechanisms is an essential topic in tropical ecology.
Reproduction is a crucial process in a tree life history, and requires a disproportionately greater amount of P than other elements (Kitayama et al. Reference KITAYAMA, TSUJII, AOYAGI and AIBA2015, Witkowski & Lamont Reference WITKOWSKI and LAMONT1996). Tropical rain-forest trees allocate a large amount of P to reproduction; c. 10–16% of the total P that internally cycled as litterfall was allocated to reproduction in Bornean rain forests on P-poor soils (Kitayama et al. Reference KITAYAMA, TSUJII, AOYAGI and AIBA2015). The trees in the same forests allocated a lower ratio of carbon (C) and nitrogen (N) (c. 2–10% in both C and N) to reproduction (Kitayama et al. Reference KITAYAMA, TSUJII, AOYAGI and AIBA2015). Therefore, the reproductive strategy of tropical rain-forest trees may be selected by P availability. For instance, an episodic reproduction of tropical rain-forest trees in South-East Asia (i.e. general flowering/fruiting) (Appanah Reference APPANAH1985, Ashton et al. Reference ASHTON, GIVNISH and APPANAH1988, Cannon et al. Reference CANNON, CURRAN, MARSHALL and LEINGTON2007, Sakai Reference SAKAI2002) may be an adaptation to P deficiency, because the trees accumulate enough P for the episodic reproduction (Ichie & Nakagawa Reference ICHIE and NAKAGAWA2013, Ichie et al. Reference ICHIE, KENTA, NAKAGAWA, SATO and NAKASHIZUKA2005). However, the relationship of tree reproductive strategy with P deficiency has rarely been studied.
Kitayama et al. (Reference KITAYAMA, TSUJII, AOYAGI and AIBA2015) investigated P concentration in reproductive-organ (flower and fruits combined and bulked) litter collected for 10 y from eight Bornean rain forests, which differed in soil P availability, and found that the allocation ratio of P to reproduction (i.e. P in reproductive-organ litter per P in total litterfall for 10 y) did not significantly vary with P availability. On the other hand, Kitayama et al. (Reference KITAYAMA, TSUJII, AOYAGI and AIBA2015) also found that P concentration in the reproductive-organ litter significantly decreased with decreasing P availability. This is not intuitively understandable, because the dilution of P in reproductive organs may reduce reproductive success; the progeny on P-poorer soils, which may require a greater amount of P inherited from maternal trees (Fenner & Thompson Reference FENNER and THOMPSON2005, Thomson & Bolger Reference THOMSON, BOLGER and Baroow1993, White & Veneklaas Reference WHITE and VENEKLAAS2012), will suffer from P deficiency.
Kitayama et al. (Reference KITAYAMA, TSUJII, AOYAGI and AIBA2015) proposed the following two possibilities for the decline of P concentration in the reproductive-organ litter with increasing P deficiency: (1) P concentration in flowers/fruits is more diluted, and (2) capsulate species increase in abundance with increasing P deficiency. The first possibility points to the proportion of P-diluted tissues increasing with increasing P deficiency (hypothesis 1). The reproductive organs of trees consist of inflorescences, fruits and seeds. These components may have different P demands depending on their roles. Seeds require P for germination and seedling growth (Lamont & Groom Reference LAMONT and GROOM2002, Milberg & Lamont Reference MILBERG and LAMONT1997, Thomson & Bolger Reference THOMSON, BOLGER and Baroow1993, White & Veneklaas Reference WHITE and VENEKLAAS2012). Inflorescences also require P in pollen and embryos (Ashman Reference ASHMAN1994a, Reference ASHMANb). In contrast, pericarps (the fruit components enclosing seeds, such as pulp and capsules) may not require P for the growth of progeny, and their P concentration may be diluted on P-poor soils.
The second possibility reflects the shift in the composition of tree species along a soil P gradient. Capsulate species often predominate on P-poor soils on Mount Kinabalu (Aiba & Kitayama Reference AIBA and KITAYAMA1999). The woody pericarps of capsulate species may contain a lower amount of P compared with fleshy pericarps, such as pulp, which may require P to reward seed dispersers. Therefore, the increase in abundance of capsulate species may reduce P concentration in reproductive organs at a community level (hypothesis 2). This study addresses the above two hypotheses at the forest sites studied by Kitayama et al. (Reference KITAYAMA, TSUJII, AOYAGI and AIBA2015).
METHODS
Study sites
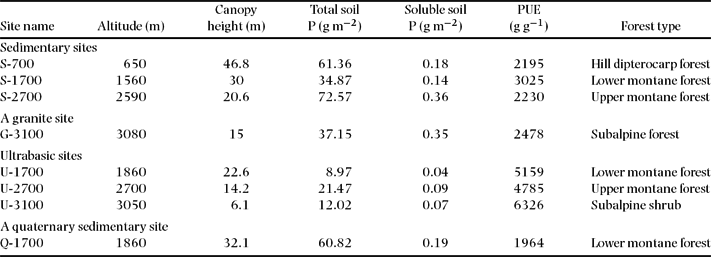
Mount Kinabalu, Borneo (6°05′N, 116°33′E, 4095 m asl), is one of the most species-rich mountains in the world (Merckx et al. Reference MERCKX, HENDRIKS, BEENTJES, MENNES, BECKING, PEIJNENBURG, AFENDY, ARUMUGAM, DE BOER, BIUN, BUANG, CHEN, CHUNG, DOW, FEIJEN, FEIJEN, FEIJEN-VAN SOEST, GEML, CEURTS, GRAVENDEEL, HOVENKAMP, IMBUN, IPOR, JANSSENS and JOCQUÉ2015), where tree species composition dramatically changes among soil substrates and altitudes (Kitayama Reference KITAYAMA1992, Kitayama & Aiba Reference KITAYAMA and AIBA2002, Stapf Reference STAPF1894). Mount Kinabalu is a non-volcanic mountain, and consists of granitic rocks above 3000 m and of Tertiary sedimentary rocks below 3000 m (Burton-Johnson et al. Reference BURTON-JOHNSON, MACPHERSON and HALL2017, Choi Reference CHOI, Wong and Phillipps1996, Collenette Reference COLLENETTE1964). Ultrabasic rocks occur among the granite and sedimentary substrates as mosaic. Eight tropical rain forests were selected in a matrix manner consisting of four elevations (c. 700, 1700, 2700 and 3100 m) and two substrates (sedimentary and ultrabasic rocks) on the southern slope of Mount Kinabalu by earlier workers (Aiba & Kitayama Reference AIBA and KITAYAMA1999). The 3100-m ‘sedimentary’ site is actually underlain by granite rocks. In addition, one forest on Quaternary colluvial sedimentary rock deposits at 1700 m was selected. These nine forests have been continuously monitored for growth, biomass and litterfall since 1996 (Aiba & Kitayama Reference AIBA and KITAYAMA1999, Kitayama & Aiba Reference KITAYAMA and AIBA2002, Kitayama et al. Reference KITAYAMA, TSUJII, AOYAGI and AIBA2015). Eight out of the nine forests were investigated in this study. The 700-m site on ultrabasic rocks was not studied here due to insufficient replication in the samples of flowers/fruits.
The climate in these sites is aseasonal humid tropical. Mean annual air temperature is 24.3°C at 550 m and predictably declines with a lapse rate of 0.55°C per 100 m (Kitayama Reference KITAYAMA1992). Soil P availability is different among the sites depending on geological substrates and weathering in relation to altitude (Wagai et al. Reference WAGAI, MAYER, KITAYAMA and KNICKER2008). The pool size of total and soluble soil P is greater in the sedimentary sites than in the ultrabasic sites at the same altitude (Kitayama et al. Reference KITAYAMA, MAJALAP-LEE and AIBA2000). Among the three sites at 1700 m, the pool size of total and soluble soil P is greatest in the Quaternary sedimentary, moderate in the Tertiary sedimentary, and lowest in the ultrabasic substrate (Kitayama et al. Reference KITAYAMA, AIBA, TAKYU, MAJALAP and WAGAI2004). The concentration of total and soluble soil P at each site (extracted with 0.03N NH4F/0.1N HCl solution) is provided in Table 1.
Description of eight study sites on Mount Kinabalu, Borneo. Canopy height represents the maximum height of a tree at each site (cited from Kitayama & Aiba Reference KITAYAMA and AIBA2002). Total soil P represents mean concentration of total soil P at each site (30 cm depth in a topsoil) (cited from Kitayama et al. Reference KITAYAMA, MAJALAP-LEE and AIBA2000). Soil soluble P represents mean concentration of the soluble soil P, which was extracted with hydrochloric-ammonium fluoride solution, at each site (15 cm depth in a topsoil) (cited from Kitayama & Aiba, Reference KITAYAMA and AIBA2002, Takyu et al. Reference TAKYU, AIBA and KITAYAMA2002). P-use efficiency (PUE) is calculated as the inverse of the P concentration in litter that was collected during the 10 years from 1996 to 2006 (cited from Kitayama et al. Reference KITAYAMA, TSUJII, AOYAGI and AIBA2015).

Sampling of reproductive organs
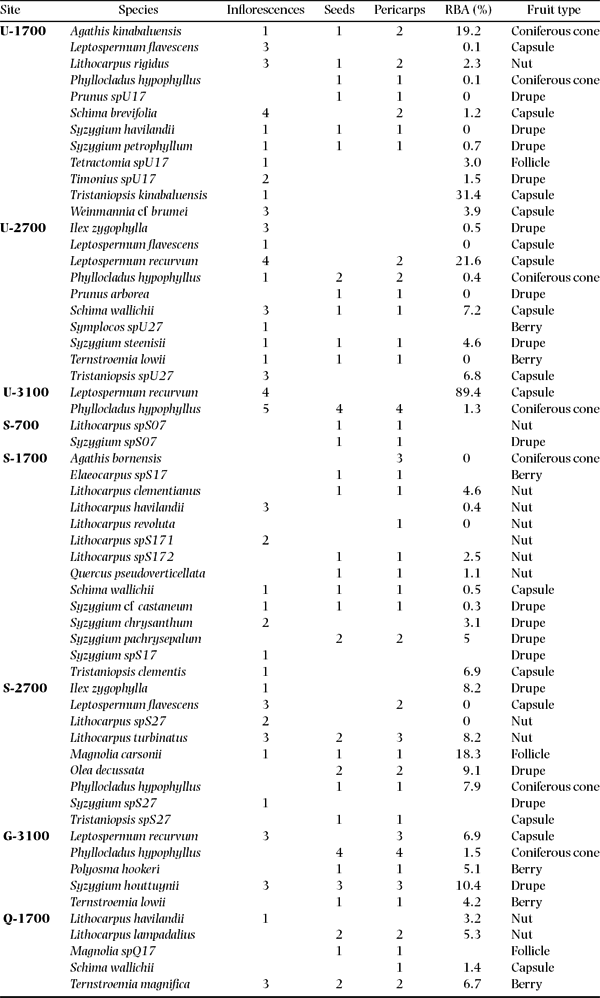
Fully expanded inflorescences and mature fruits were sampled from a total of 46 dominant tree species (21 genera) from the eight sites, using a 15-m telescopic pruning pole and a catapult. The dominant species were selected based on basal area (Appendix 1). An entire inflorescence was sampled from a shoot in the case of the species with hermaphrodite flowers. In the case of Lithocarpus species, which had unisexual flowers, entire inflorescences were collected because the inflorescence included both male and female flowers. In the cases of Agathis and Phyllocladus species (the species with unisexual cones), only male cones were sampled due to the lack of enough female cones. Inflorescences and fruits were collected from more than one canopy individual per species as far as possible (Appendix 1). The sampled inflorescences and fruits were dried at 60°C for more than 1 wk to a constant dry weight. After being dried, fruits were divided into seeds (including embryos, cotyledons and seed coats) and pericarps (i.e. the pericarp with a pedicel for angiosperm, or a female cone for gymnosperm). The seeds of drupes actually included endocarps, because the endocarps could not be removed. Only viable seeds (i.e. containing embryos) were analysed across all species, except for Tristaniopsis species. The seeds of Tristaniopsis species were analysed as a mixture of viable and non-viable seeds, because the seeds were too minute to separate non-viable from viable seeds. The sampling was conducted from July 2014 to February 2017. Masting (i.e. general flowering/fruiting) was recorded in 2014 at the 700-m sedimentary site, and the fruits of Shorea argentifolia were sampled during the masting event. Dried inflorescences, seeds and pericarps were powdered by a vibration mill (TI-200, Advantec, Tokyo, Japan) prior to chemical analysis.
Measurements of P concentration in reproductive organs
P concentration in the powdered samples was determined by the following procedure. The samples (c. 150 mg) were digested with 5 mL of concentrated H2SO4 and 2 mL of 30% H2O2 at 380°C for 5 h. P concentration in the digests was determined using an inductively coupled plasma atomic emission spectrometer (ICPS-7510, Shimadzu Co., Kyoto, Japan). P concentration in the samples was calculated on a dry mass basis.
Estimation of the composition of fruit types at each site
The composition of fruit types at each site was estimated based on the relative abundances of genera and fruit types by genus using the list of species composition documented by Aiba et al. (Reference AIBA, KITAYAMA and REPIN2002). We targeted all the species with > 0.1% relative basal area. We categorized the fruit types of the listed species to the following categories: berry or drupe, capsule, coniferous cone, nut, the others, and unknown. The fruit type of each species/genus was determined according to the description in the following literature: Esser (Reference ESSER1997), Keng (Reference KENG1978), LaFrankie (Reference LAFRANKIE2010), Schot (Reference SCHOT2004), Sleumer (Reference SLEUMER1955), Soepadmo & Saw (Reference SOEPADMO and SAW2000), Soepadmo & Wong (Reference SOEPADMO and WONG1995), Soepadmo et al. (Reference SOEPADMO, WONG and SAW1996, Reference SOEPADMO, SAW and CHUNG2002, Reference SOEPADMO, SAW and CHUNG2004, Reference SOEPADMO, SAW, CHUNG and KIEW2007, Reference SOEPADMO, SAW, CHUNG and KIEW2011, Reference SOEPADMO, SAW, CHUNG and KIEW2014). We categorized fruit type as unknown when the information regarding fruit type was not obtained from the literature.
Data analysis
Mean P concentration per site in inflorescences, seeds and pericarps was calculated for each genus separately, to allow for the difference of fruit types among genera. When there were several species in a given genus, mean P concentration was calculated for each species and species-mean values were used as units of replication in a site. The relationship of the mean P concentration per site by genus with soil P availability was examined by an ordinary least squares (OLS) regression. The concentration of soluble soil P was used as an explanatory variable of soil P availability (Table 1). The concentration of soluble soil P at each site was cited from Kitayama & Aiba (Reference KITAYAMA and AIBA2002). OLS models were fitted to each of the data sets by genus, separately. This approach is legitimate, because common species across sites are very few on this mountain due to high species turnover (Aiba & Kitayama Reference AIBA and KITAYAMA1999) and because flower/fruit traits are usually conservative within a given genus. Following the OLS regression analysis, sign tests were performed to examine whether the OLS models by genus had a common sign in the Pearson's correlation coefficients (i.e. positive or negative) across genera or not. When one or more genera have the counter sign to the majority, significance is not achieved with sample sizes of 6–7 or 8–9 genera, respectively.
The effect of phylogeny on P concentration in reproductive organs was examined by a variance-partitioning technique. This analysis was performed for mean P concentration by genus in inflorescences, seeds and pericarps. Nested ANOVA models were developed using the procedure of Fyllas et al. (Reference FYLLAS, PATIÑO, BAKER, BIELEFELD NARDOTO, MARTINELLI, QUESADA, PAIVA, SCHWARZ, HORNA, MERCADO, SANTOS, ARROYO, JIMÉNEZ, LUIZÃO, NEILL, SILVA, PRIETO, RUDAS, SILVIERA, VIEIRA, LOPEZ-GONZALEZ, MALHI, PHILLIPS and LLOYD2009) (equation 1), to partition the variance (i.e. R2 value) in a response variable into the following three categories: the contribution of family, genus nested within family, and residue.
 $$\begin{equation}
Y{\rm{ }} = {\rm{ }}\mu {\rm{ }} + {\rm{ }}f/g{\rm{ }} + {\rm{ }}\varepsilon
\end{equation}$$
where µ represents the overall mean value of a response variable (Y), f/g represents a genus (g) nested within a family (f), and ε represents the residues that include environmental effects, intra-genus variation, and measurement error.
A logistic regression with binomial error distribution was performed to model the relationship between the composition of fruit types and the concentration of soluble soil P. We also calculated community-weighted mean (CWM) P concentration in inflorescences, seeds and pericarps, to examine the relationships of species composition with P concentration in reproductive organs at a community level. The CWM was defined as the average of species-mean P concentration weighted by the relative basal area of each species sampled in a site. Species-mean values were calculated at each site, respectively. The relationship of the CWM with the concentration of soluble soil P was examined by an OLS regression.
The differences among the following fruit types were tested by ANOVAs for P concentration in seeds or pericarps: berry, capsule, coniferous cone, drupe, follicle and nut. Mean values per site by species were used as units of replication. The pooled data of the 46 species were used in this analysis.
There was a large variation in altitude among sites (650–3080 m asl), which was possibly correlated with P concentration in reproductive organs. Therefore, the same analyses were conducted to test significant relationships of the following response variables with altitude: mean P concentration per site by genus in inflorescences, seeds and pericarps, and the CWM P concentration in the same tissues. Multiple regression analyses were conducted to examine the interactive effect of the concentration of soluble soil P and altitude on the CWM P concentration in inflorescences, seeds or pericarps. All statistical analyses were done in R version 3.2.5.
RESULTS
P concentration in reproductive organs
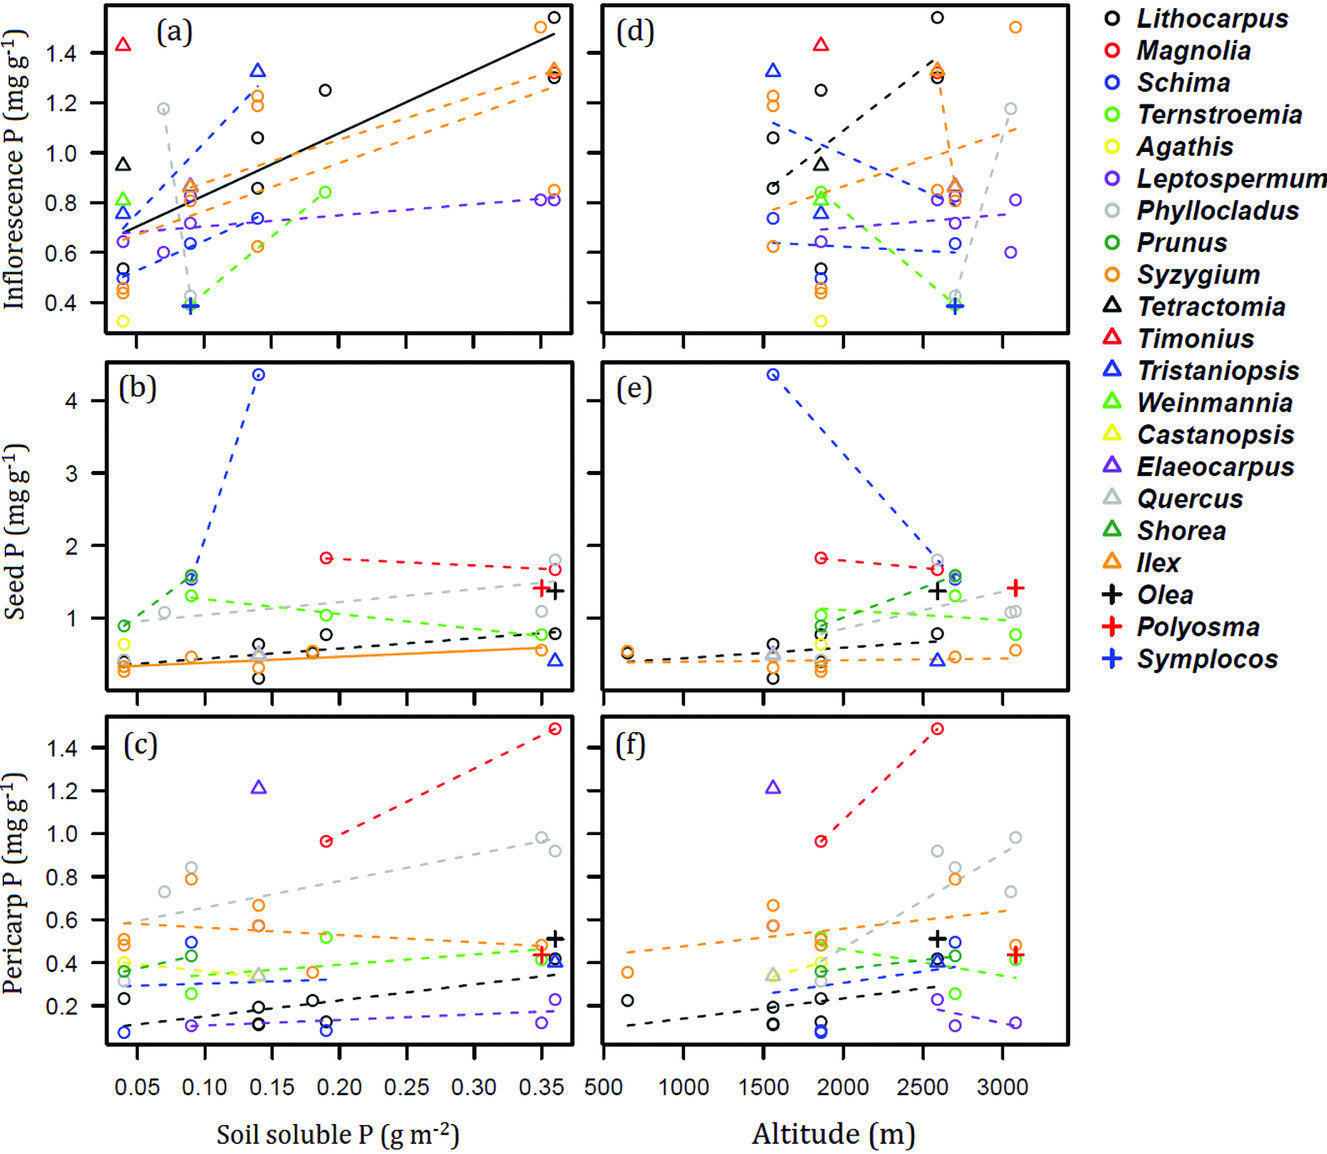
Mean P concentration per site by genus was 0.32–1.54, 0.17–4.36 and 0.08–1.49 mg g−1 in inflorescences, seeds and pericarps, respectively (Figure 1). Mean P concentration per site by genus in inflorescences was significantly positively correlated with the concentration of soluble soil P for Lithocarpus (t = 1.8, n = 6, P < 0.05, Figure 1a). This pattern in inflorescences was a significant majority across genera (sign test, P < 0.05); i.e. 7 out of 8 genera showed a positive sign in the Pearson's correlation coefficient of the OLS models by genus. In contrast, mean P concentration per site by genus in seeds or pericarps was not significantly correlated with the concentration of soluble soil P (t = −0.6–2.0, n = 3–7, P = 0.10–0.95, Figure 1b, c), except for the seeds of Syzygium (Figure 1b); mean P concentration per site by genus in seeds was significantly positively correlated with soluble soil P in Syzygium (t = 2.6, n = 7, P < 0.05, Figure 1b). There was no consistent pattern across genera for seeds or pericarps (sign test, P > 0.05); i.e. 5 out of 7, and 7 out of 9 genera showed a positive sign in the Pearson's correlation coefficient of the OLS models by genus for seeds and pericarps, respectively.
Relationships of mean P concentration per site in reproductive organs with the concentration of soil soluble P (a–c), or altitude at each site (d–f), for 21 tree genera on Mount Kinabalu, Borneo. The mean P concentration per site was calculated for each genus, respectively. OLS models were fitted to each of the data sets by genus, separately. Solid, and broken lines denote significant (P < 0.05), and non-significant correlation, respectively. Different colours and symbols represent different genera.

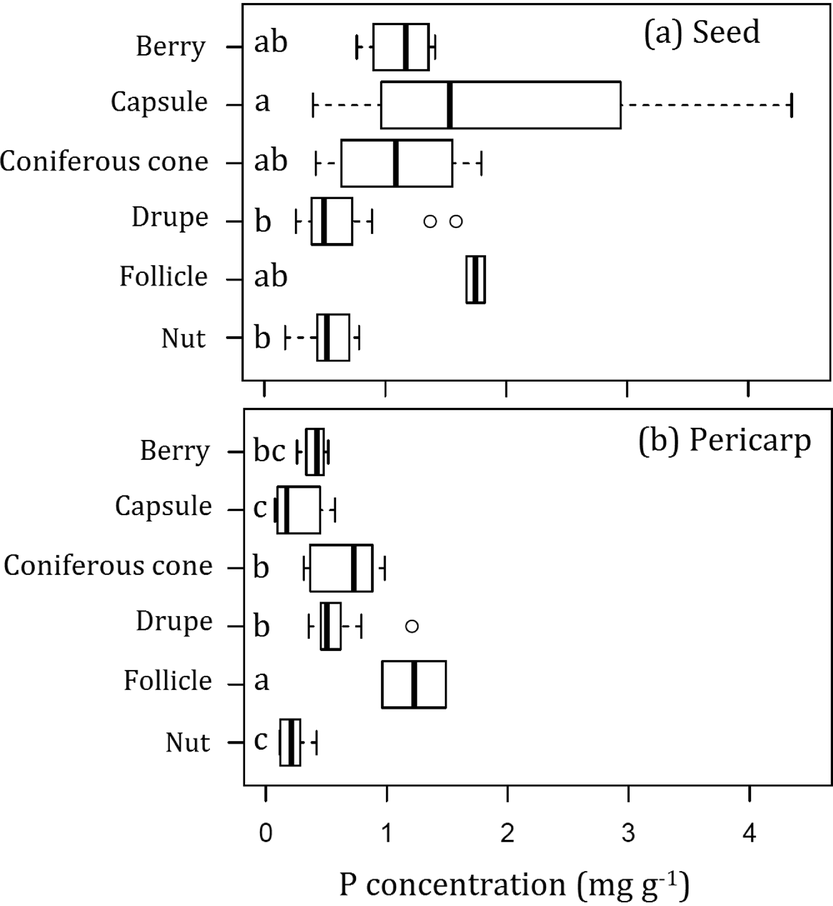
Mean P concentration in seeds and pericarps was significantly different among fruit types (F = 3.4 and 9.8, n = 33 and 40, P < 0.05 and < 0.01, for seeds and pericarps, respectively, ANOVA, Figure 2), when all species were pooled. Mean P concentration in seeds by fruit type was significantly higher in capsulate fruits than in nuts and drupes (Tukey HSD, P < 0.05, Figure 2a). Mean P concentration in pericarps by fruit type was significantly lower in capsulate fruits than in drupes (Tukey HSD, P < 0.05, Figure 2b).
Boxplots showing mean P concentration by species in seeds (a) and pericarps (b) for six fruit types from eight forests on Mount Kinabalu, Borneo. The mean P concentration by species was calculated at each site respectively. The central box in each box plot shows the inter quartile range and median; the whiskers extend 1.5 times the inter quartile range or to the most extreme value. Pairwise significant differences among sites are shown as different letters (Tukey HSD, P < 0.05).

Phylogenetic patterns
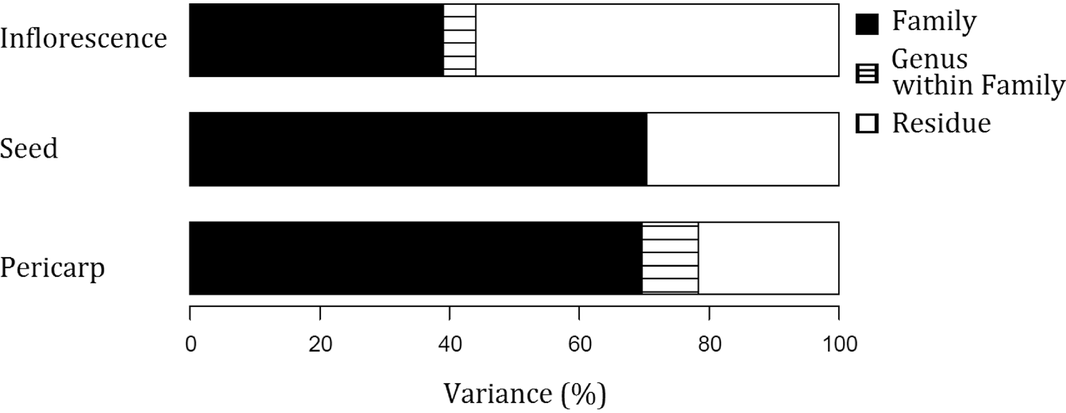
In total, 44.0–78.4% of the variance in P concentration in reproductive organs was explained by phylogeny (i.e. genus nested within family, and family) (Figure 3). P concentration in seeds or pericarps was explained by genus nested within family (0.0% or 8.8%) and family (70.0% or 69.6% for seeds or pericarps, respectively), while that in inflorescences was in part explained by genus nested within family (5.0%) and family (39.0%).
Proportion of variance explained (R2) by family, genus nested within family, and residue for P concentration in inflorescences, seeds or pericarps. Sums of squares (R2) were calculated by comparing R2 across different models. Filled, hatched and open bars represent family, genus nested within family, and residue, respectively.

The composition of fruit types at each site
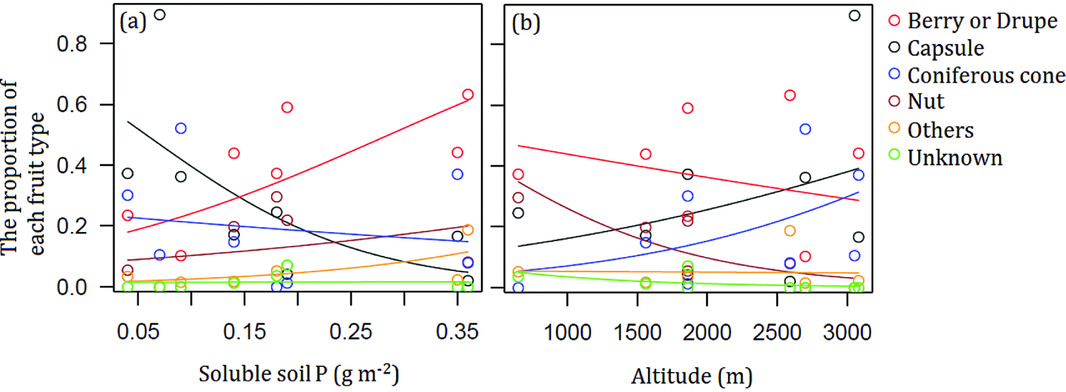
The relative abundance of the species with capsulate fruits tended to increase with decreasing concentration of soluble soil P, from 4.3% in the most P-rich site (i.e. the site of the Quaternary colluvial sedimentary rock deposits at 1700 m asl) up to 89.5% in the second most P-poor site (i.e. the site of the ultrabasic rock at 3100 m asl) (z = −1.0, n = 8, P = 0.34, Figure 4a). In contrast, the relative proportion of the species with berries/drupes tended to decrease with decreasing concentration of soluble soil P (z = 0.9, n = 8, P = 0.37, Figure 4a). The relative abundances of the species with the other fruit types were invariant with decreasing soluble soil P (z = −0.2–0.4, n = 8, P = 0.78–0.84, Figure 4a). The relative abundance of the species with nuts tended to decrease with increasing altitude (z = −0.7, n = 8, P = 0.46 for nut, Figure 4b), while those of the other fruit types were invariant (z = −0.3–0.0, n = 8, P = 0.54–0.98, Figure 4b).
Relationships of the relative proportion of fruit types with the concentration of soluble soil P (a), or altitude (b) for eight forests on Mount Kinabalu, Borneo. Red, black, blue, brown, orange, and green symbols/curves represent berry or drupe, capsule, coniferous cone, nut, the others, and unknown, respectively.

Community-weighted mean (CWM) P concentration
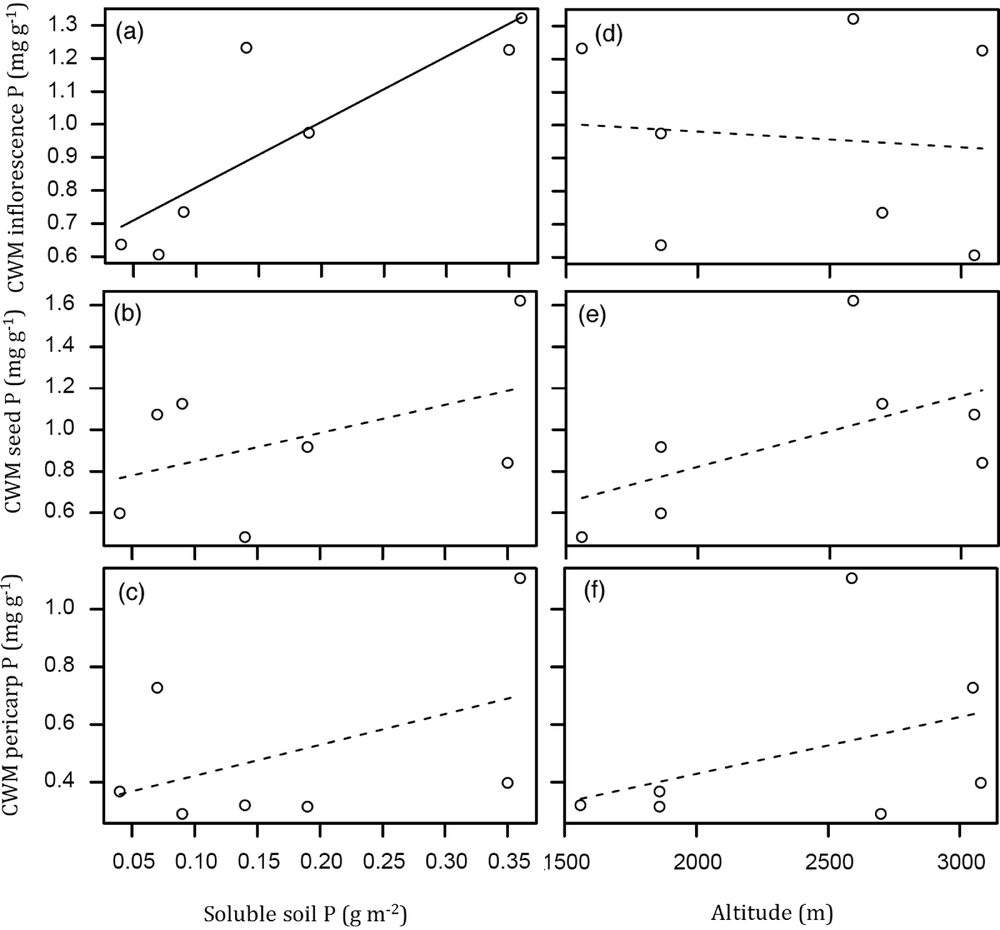
The CWM P concentration varied from 0.61–1.32, 0.42–1.42 and 0.29–1.01 mg g−1 in inflorescences, seeds and pericarps, respectively (Figure 5). The CWM P concentration in inflorescences was significantly positively correlated with the concentration of soluble soil P (t = 3.7, n = 7, P < 0.05, Figure 5a), while that in seeds or pericarps was not significantly correlated (t = 1.3 and 1.2, n = 8 and 8, P = 0.28 and 0.30, for seeds and pericarps, respectively, Figure 5b, c).
Relationships of community weighted-mean (CWM) P concentration in inflorescences, seeds, or pericarps with the concentration of soluble soil P (a–c), or altitude at each site (d–f) for eight forests on Mount Kinabalu, Borneo. Solid, and broken lines denote significant (P < 0.05), and non-significant correlation, respectively.

Altitudinal pattern
There was no significant correlation between mean P concentration per site by genus and altitude across all genera (Figure 1d–f), or between the CWM P concentration and altitude (Figure 5d–f) for all reproductive organs. There was no significant interaction of soil P availability and altitude on the CWM P concentration (t = −1.59 to −0.23, df = 3–4, P = 0.21–0.83, multiple regression analysis) for all reproductive organs. Therefore, we focused mainly on the relationship of P concentration in reproductive organs with soil P availability in the following discussion.
DISCUSSION
The aim of this study is to elucidate the underlying mechanism and ecological significance of the dilution of P in reproductive organs with increasing P deficiency. The dilution of P in reproductive organs was both due to (1) the dilution of P in inflorescences but not in fruits, and (2) the dominance of capsulate species. The former suggests that the allocation of P among reproductive organs is critically selected by P availability. The latter implies that community assemblage influences the dynamics of P in a forest via fruit type.
P concentration in reproductive organs
Mean P concentration per site by genus in inflorescences decreased with decreasing soil P availability (Figure 1a), and this was a common trend across genera. This is in contrast with our hypothesis. We hypothesized that P concentration in inflorescences is maintained even on P-poor soils, because a certain amount of P is required for fertilization and embryo development (e.g. pollen and ovule). However, P-poor environments favoured tree species with a low P concentration in inflorescences across lineages. The low P concentration in inflorescences may be associated with the dilution of P in non-dispersive reproductive components, such as calyx and corolla complex. If so, P concentration in fresh inflorescences would be diluted without sacrificing P concentration in pollen, ovule, embryos and so forth.
In contrast to inflorescences, P concentration in seeds was maintained even on P-poor soils across most genera (Figure 1b). The content of P per seed was also invariant across the sites with different P availabilities across most genera (sign test, P > 0.05; i.e. 6 out of 7 genera showed a positive sign in the Pearson's correlation coefficient of the OLS models, Appendix 2). This may be because tree species on P-poor soils accumulate P in seeds (DiManno & Ostertag Reference DIMANNO and OSTERTAG2016, Witkowski Reference WITKOWSKI1990). The accumulation of P in seeds was often found in species naturally growing on P-poor soils (Atkinson & Davison Reference ATKINSON and DAVISON1971, DiManno & Ostertag Reference DIMANNO and OSTERTAG2016, Groom & Lamont Reference GROOM and LAMONT2010, Witkowski Reference WITKOWSKI1990). For instance, DiManno & Ostertag (Reference DIMANNO and OSTERTAG2016) conducted P or N fertilization experiments at two sites with contrasting soil fertility (P-limited sites vs. N-limited sites) in the Hawaiian Archipelago, and found that Metrosideros polymorpha (Myrtaceae) at the P-limited sites accumulated P in seeds in response to P fertilization while that at the N-limited sites did not. They also showed that Metrosideros polymorpha had a greater P concentration in seeds at the P-limited sites than at the N-limited sites under natural conditions. Similarly, Witkowski (Reference WITKOWSKI1990) showed that Australian Proteaceae inhabiting P-poor environments accumulated P in seeds in response to P fertilization. Groom & Lamont (Reference GROOM and LAMONT2010) showed that Proteaceae from south-western Australia (stronger P deficiency) had on average a two-fold greater P concentration in seeds than those from the Cape of Africa (weaker P deficiency). The accumulation of P in seeds is considered to be an adaptive mechanism to P deficiency (DiManno & Ostertag Reference DIMANNO and OSTERTAG2016, Lambers et al. Reference LAMBERS, FINNEGAN, JOST, PLAXTON, SHANE and STITT2015), because the storage of P in seeds contributes to rapid seedling growth on P-poor soils (Groom & Lamont Reference GROOM and LAMONT2010, Thomson & Bolger Reference THOMSON, BOLGER and Baroow1993, Vandamme et al. Reference VANDAMME, PYPERS, SMOLDERS and MERCKX2016). Exceptionally, P concentration in the seeds of Syzygium species significantly decreased with decreasing soil P availability.
We hypothesized that P concentration in pericarps decreases with decreasing soil P availability. However, contrary to this hypothesis, P concentration in pericarps was invariant in relation to soil P availability across most genera (Figure 1c). Rather, the variation of P concentration in pericarps was associated with fruit type. Mean P concentration in pericarps was significantly different among fruit types when all species were pooled (Figure 2b). P concentration in pericarps may be related to seed-dispersal syndromes. For instance, the seeds of berries and drupes are typically dispersed by animals; such fruits have a high P concentration to reward seed dispersers even on P-poor soils. Indeed, high P concentration in the pericarps of berries and drupes (e.g. Syzygium, Ternstroemia and Prunus) (0.26–1.21 mg g−1) was found across sites (Figure 1c, 2b). In contrast, the fruits with wind-dispersed seeds may require less P in pericarps (e.g. capsules). P concentration in capsules was low (0.08–0.57 mg g−1) across all sites for Leptospermum, Tristaniopsis and Schima species (Figure 1c, 2b).
The effect of phylogeny on P concentration was different among reproductive organs (Figure 3). P concentration in inflorescences was to some extent independent of phylogeny. This may be due to the correlations between P concentration in inflorescences and soil P availability across genera (Figure 1a). Contrastingly, P concentration in seeds or pericarps may be strongly influenced by phylogeny.
The shift in the composition of fruit types along a soil P gradient
In our study sites, the relative proportion of the species with capsulate fruits tended to increase with decreasing soil P availability (Figure 4a). The abundance of capsulate species may explain the decrease of P concentration in reproductive organs at a community level, because capsulate fruits had significantly lower P concentration in pericarps than the other fruit types (Figure 2b). The reason why capsulate species dominated with greater abundance on P-poorer soils is an intriguing question. One possibility is that seed dispersal by wind is adaptive to P deficiency. Capsulate species are predominantly wind-dispersed, and their pericarps may not require P to reward seed dispersers. Capsulate species require a smaller amount of P per fruit weight, and hence could maintain the production of massive fruits even under P deficiency. Furthermore, mean P concentration in seeds by fruit type was significantly greater in capsulate species than in the other fruit types (Figure 2a). This greater P concentration in seeds may help seedling growth on infertile soils (Thomson & Bolger Reference THOMSON, BOLGER and Baroow1993), assuring a competitive advantage on P-poor soils. However, the dominance of capsulate species may also be linked with other factors such as air temperature, precipitation and fruit-frugivore interactions (Almeida-Neto et al. Reference ALMEIDA-NETO, CAMPASSI, GALETTI, JORDANO and OLIVEIRA-FILHO2008, Chen et al. Reference CHEN, CORNWELL, ZHANG and MOLES2017, Correa et al. Reference CORREA, ÁLVAREZ and STEVENSON2015, Fenner Reference FENNER1985). Adaptive traits of capsulate species to P deficiency need to be further investigated.
We focused on the CWM values to examine the relationships of species composition with P concentration in reproductive organs at a community level. The CWM P concentration in inflorescences significantly decreased with decreasing soil P availability (Figure 5a). This was due to the decrease of P concentration in inflorescences across genera (Figure 1a). Similarly, we expected that the CWM P concentration in pericarps decreases with decreasing soil P availability in relation to the dominance of capsulate species (Figure 4a). However, contrary to our expectation, the CWM P concentration in pericarps was invariant across sites (Figure 5c). This may be due to insufficient replication in fruit samples. We could not sample the fresh fruit of Tristaniopsis kinabaluensis, which dominated the second lowest P-availability site with capsules of a quite low P concentration (0.09 mg g−1 dry weight, Y. Tsujii unpubl. data). The lack of sampling such a species may result in the overestimation of the CWM P concentration in pericarps. The CWM P concentration in seeds was also invariant across sites (Figure 5b), possibly due to the same reason.
Flower/fruit productivity per species is also an important aspect. Masting was recorded in Shorea, Syzygium, Lithocarpus, Phyllocladus and Tristaniopsis species (Y. Tsujii unpubl. data). This temporal variation in flower/fruit productivity possibly influences P concentration in reproductive organs. However, P concentration in reproductive-organ litter did not significantly vary with time; this was consistent even when reproductive-organ litter of masting events was included (K. Kitayama & Y. Tsujii unpubl. data). We suggest that the patterns that we described here are robust and independent of the magnitude of fruit productivity.
CONCLUSION
There are two mechanisms to increase the P-use efficiency of reproductive-organ production in Bornean rain forests. The first mechanism is the dilution of P concentration in inflorescences. However, such species with diluted P in inflorescences still maintained P concentration in seeds, suggesting that these species maintain P investment to progeny in exchange with reduced P in inflorescences. The second mechanism is the community shift to capsulate species, whose pericarps contain less P than those of the other fruit types; this mechanism maintains the reproduction with a smaller P investment at an individual and/or a stand level. These mechanisms may be adaptive to maintain reproductive activities under P limitation.
ACKNOWLEDGEMENTS
We thank the staff members of the Sabah Parks for their kind assistance with our study. This work was supported by JSPS KAKENHI Grant Numbers JP16J11435 to YT and JP22255002 to KK.
A list of the species sampled at each forest. Numbers represent the replication of individuals in a species. RBA represents the relative basal area of each species at each forest (cited from Aiba et al. Reference AIBA, KITAYAMA and REPIN2002).

Appendix 2
Relationship of mean seed P content per site with the concentration of soluble soil P, for 18 tree genera on Mount Kinabalu, Borneo. The mean seed P content per site was calculated for each genus, respectively. OLS models were fitted to each of the data sets by genus, separately. Solid, and broken lines denote significant (P < 0.05), and non-significant correlation, respectively. Different colours and symbols represent different genera.