


Why do blue-collar American workers support less redistribution than their German counterparts? Why are they so proud to be Americans? How can we explain the fact (to be established later) that, in most economically advanced democracies, national pride is associated with reduced support for redistribution and that democracies with less national pride actually redistribute more? This article suggests that well-documented processes of social identification can, when applied to a standard political economy model of redistribution, help explain these and related phenomena.
For the past three decades, social identity has been the focus of intense research throughout the social sciences. In particular, social psychologists and experimental economists have produced a rich set of robust empirical results based on both experimental and field studies. This article takes these results seriously. It first attempts to distill them into a parsimonious statement of what it means to identify with a group, and what factors are important for determining the groups with whom people are likely to identify. The article then proposes a concept of equilibrium where the profiles of actions and social identities are jointly determined.
The basic theoretical framework is straightforward. A society may have many social groups—“American,” “Hispanic,” “middle class,” and so on—but in any given situation individuals “identify” with only some of these. Given their social identities, they choose courses of action that determine the aggregate outcome. That outcome forms the social environment that in turn affects the pattern of social identities. A social identity equilibrium (SIE) is a steady state where (1) each individual's behavior is consistent with his or her social identity, (2) social identities are consistent with the social environment, and (3) the social environment is determined by the behavior of the individuals.
Social identification is defined in terms of preferences: to identify with different groups means to have different preferences over outcomes. Preferences involve two novel components. The first is the status of the various groups that exist in society. Group status is the relative position of a group on valued dimensions of comparisons (e.g., wealth, occupational status, educational achievement). Thus, if we assume that individuals value consumption, then a group characterized by high levels of consumption will have a higher status than a group characterized by low levels, other things equal. The second component is the perceived similarity between an individual and the other members of the group. This component is modeled using the notion of distance in conceptual space from cognitive psychology. Each agent is characterized by a vector of attributes. The perceived distance from a given group is then simply a weighted Euclidean distance between the agent and the prototype of that group, with the weights reflecting the relative salience of the various dimensions. Given these two components, an individual is said to identify with group J if (1) he or she cares about the status of group J and (2) he or she wants to resemble the members of group J.
Next, the article provides a description of the process of identification with specific groups. Two factors are at work here. First, a cognitive factor: people are more likely to categorize themselves as members of a group the more “similar” they are to the other members of that group. Second, an affective factor: people tend to identify more with high-status groups than with low-status groups. Importantly, the factors underlying the process of identification—status and distance—are the same two factors that affect individual behavior under identification. This observation helps make the analysis of social identity tractable.
The model generalizes several existing models of social preferences. It augments the Akerlof and Kranton (Reference Akerlof and Kranton2000) approach—which emphasizes the tendency of group members to follow the prescribed behavior of their group—with a second feature of identification: the willingness to sacrifice material payoffs in order to enhance group status. This last feature also generalizes models of altruism because in many situations enhancing a group's status is equivalent to enhancing the welfare of other group members. Notice, however, that, to borrow a distinction from Hegel, this altruism is particular rather than universal: it is directed at in-group members only. Furthermore, because the model specifies the factors that determine who is likely to identify with what group, it can help account for some of the observed heterogeneity in altruism and conformity to group norms.
In this article, this general framework is applied to one specific issue: income redistribution in democracies. Since the early studies of voting behavior, it has often been suggested that social context and social groups have a crucial effect on political choices (Beck et al. Reference Beck, Dalton, Greene and Huckfeldt2002; Conover Reference Conover1984; Lazarsfeld, Berelson, and Gaudet Reference Lazarsfeld, Berelson and Gaudet1948; Miller, Wlezien, and Hildreth Reference Miller, Wlezien and Hildreth1991). This view is supported by observed differences in voting patterns and reported policy preferences across social groups such as class, race and religious affiliation, controlling for measures of economic self-interest (e.g., Evans Reference Evans2000; Glaeser and Ward Reference Glaeser and Ward2006; Luttmer Reference Luttmer Erzo2001). This article explores the possibility that part of the reason may be that people do not simply vote their economic self-interest: they also vote their identity. I focus on two prominent identities: class and nation.
The model starts from the simple point that if income redistribution enhances the status of the lower class more than it does national status, then class identification makes redistribution a more important issue to low-income voters than does national identification. Thus, two types of equilibria may emerge. In the first, the members of the lower class (who constitute a majority) identify with their class. Hence, they vote for a relatively high level of redistribution. A high level of redistribution can in turn help strengthen that class identity by endowing it with a higher status. In the second type of equilibrium, members of the lower class tend to think of themselves more as members of the nation as a whole than as members of a low-status part of it. They are thus less concerned with income redistribution and vote for a lower level of redistribution than they would under class identity. Again, low levels of redistribution can in turn help make identification with the lower class less attractive.
Which of these equilibria is likely to emerge? This depends first on perceived distances, which in turn depend on the extent and salience of common national attributes compared to income- and class-specific attributes. For example, an increased sense of commonality with fellow nationals (due to a perceived common threat, say) or a reduced sense of similarity to other members of the lower class (due to heterogeneity within the lower class, say) are both likely to increase national identification and reduce class identification among the relatively poor. They hence promote a lower level of redistribution. Second, the equilibrium attained depends on exogenous sources of national and class status. Nations with high international stature, for example, are more likely to engender national identification than inferior ones, other things equal. Furthermore, because pretax income distribution affects the status of the lower class, the model points to the possibility that an increase in pretax inequality will cause the poor to shift from a class identity to a national identity, which could lead them to vote for less redistribution. Finally, in certain situations, multiple equilibria can exist under the same economic and institutional fundamentals. This suggests a potentially lasting effect of historical contingencies.
Can this model help explain observed patterns of national identification and redistribution? The final section of the article examines the main implications of the model, both at the individual level and at the national level, using data from the International Social Survey Program (ISSP) 1995—National Identity surveys, the World Values Survey (WVS), and the Luxembourg Income Study (LIS). Overall, the model seems to account for the major patterns. First, in almost all modern democracies, poorer individuals are more likely to be nationalistic, as the model suggests (because, being the majority, the poor are more similar to the national prototype and because their more immediate social group has a lower status than the status of the high class). Second, in most economically advanced democracies, national identification reduces support for redistribution. This effect appears to be very large when compared to the effect of economic self-interest. Third, the model implies that regardless of whether differences in redistributive systems arise from exogenous factors or from multiple equilibria, we should observe a negative relationship between the prevalence of national identification and the extent of income redistribution. A cross-country analysis reveals a very strong negative relationship between these two variables. Indeed, when looking at well-established democracies, the R 2 is between 60% and 72%.
The rest of this section relates the article to other explanations of income redistribution. The next section presents the model. The third section of the article solves the model and discusses possible interpretations and implications. The empirical results are presented in the fourth section. Appendix A reviews the experimental evidence underlying the theoretical framework. Proofs are in Appendix B.
Before specifying the model, it is worthwhile relating the article to three strands of the literature on income redistribution. First is the literature on party competition, particularly John Roemer and his coauthors' work on policy bundling (Lee and Roemer Reference Lee and Roemer2006; Roemer Reference Roemer1998; Roemer and Van der Straeten Reference Roemer and Van der Straeten2005, Reference Roemer and Van der Straeten2006). This literature shows how, given a distribution of voter preferences over tax policy and some noneconomic issue (e.g., race), and when parties compete by proposing two-dimensional platforms, an equilibrium can emerge where voters support a party whose proposed policy does not maximize their economic interests. Notice that unlike the model of social identity proposed here, policy bundling theory is not meant to explain the distribution of policy preferences. Hence, it does not offer an account of the individual-level patterns presented in the empirical section of this article, nor of how preferences may react to policy. However, this literature suggests that in addition to the direct effect of national identification on preferences for redistribution—which lies at the heart of the present model—there may exist a further policy bundling effect, which emerges from party competition. Such an effect could amplify the relation (at the country level) between national identification and redistributive policies.
Second, it has been argued that the poor in the United States do not support redistribution because they misunderstand their economic interests and are distracted by various wedge issues (Frank Reference Frank2004). The model proposed here does not dismiss such noneconomic issues, and attempts to employ insights from social psychology to better understand the circumstances under which voters are more likely to care about such issues. The model also suggests a mechanism through which the relative salience of certain attributes (e.g., “American values” vs. class-related attributes) can affect identification patterns and hence policy preferences.
Finally, the article relates to the large literature on the cross-country variation in welfare systems, in particular in the United States and Western Europe. There are two prominent classes of explanations. First, there are explanations based on differences in countries' economic, political or social characteristics, for example, pretax income distribution (Meltzer and Richard Reference Meltzer and Richard1981; Romer Reference Romer1975); income mobility (Benabou and Ok Reference Benabou and Ok2001); and political and legal institutions (Persson and Tabellini Reference Persson and Tabellini2003). Second, there are explanations based on the possibility of multiple redistributive equilibria. That is, even societies with the same socioeconomic and political fundamentals may end up with very different redistributive regimes (Benabou Reference Benabou2000; Benabou and Tirole Reference Benabou and Tirole2006; Piketty Reference Piketty1995). This article contributes to both classes of explanations. Thus, although the model allows for the standard median-voter result regarding the effect of pre-tax income inequality, it also suggests the possibility of a shift in identification patterns as a result of an increase in inequality, which can lead to reduced demand for redistribution. Furthermore, the model highlights the importance of several other factors (e.g., diversity within the poor class) for redistributive politics. With respect to the possibility of multiple equilibria (and history dependence), the contribution of the proposed model is that instead of relying on multiple beliefs or on market imperfections, it highlights the effect of redistribution on the status of the lower class and hence on the likelihood that members of that class will identify with it and vote according to their class membership.
THE MODEL
This article examines whether a simple model of social identity, grounded primarily in evidence from social psychology, can help us understand patterns of national and class identification and their relation to redistributive policies. Formally, the model is a standard normal form game in which each agent i chooses an action (vote) a i and a group to identify with g i. The utility of each agent i is going to be a function of three variables: πi—his or her material payoff; d igi – his or her perceived distance from group g i; and S gi—the status of that group. I explain each variable in turn.
Political Economy
The material payoff comes from a standard model of redistribution by linear taxation. There is a set of agents  , and the analysis focuses on a subset N ⊂ of agents who compose a single nation. A proportion λ > 0.5 of the agents in this nation have a relatively low pretax income of y p, whereas 1-λ have income y r, where y r > y p. These agents will be referred to as “poor” and “rich,” but one should keep in mind that the “poor” are the median income agents. To avoid dealing with ties, assume that the number of poor is greater than the number of rich by more than 1. Denote mean income by y.
For each agent i, let πi be that agent's material payoff. This is just his posttax income, composed of income net of taxes and a government transfer k:

where t ∈ [0, 1] is the tax rate. As in the standard model of redistribution financed by distortionary taxation (Romer Reference Romer1975), income taxation involves deadweight losses, which I assume to be quadratic (following Bolton and Roland Reference Bolton and Roland1997). The government's budget constraint is then
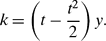
I keep the political process as simple as possible so the equilibrium policy directly reflects the policy preferences of the majority of voters. This seems like a reasonable approach to general interest redistribution in well-established democracies. Thus, all agents are assumed to vote directly and sincerely over the tax rate (i.e., each agent votes for his or her most preferred tax rate), and the median tax rate is adopted.Footnote 1 Formally, an action a i ∈ A i = [0, 1] by agent i is a vote for a tax rate. Given a profile of votes a, the chosen tax rate t* ∈ [0, 1] is determined by

It can be easily verified that absent social identity considerations, the chosen tax rate is  . This replicates the standard median voter result, whereby the equilibrium level of redistribution is higher the greater is the difference between median and mean income (Meltzer and Richard Reference Meltzer and Richard1981).
Social Identity
I now define the building blocks of the proposed model of social identity. Each building block is briefly introduced in general terms, and is then applied to the redistribution setting. The general theoretical framework attempts to capture concisely empirical regularities documented in three well-established strands of research that study behavior in groups: the minimal group paradigm, public goods experiments, and the study of conformity. These regularities are reviewed in Appendix A, which can be read now. A more thorough discussion of the model and the evidence can be found in Shayo (Reference Shayo2007).
Social Groups. I start from a given nonempty set of social groups G={J:J⊆ is a social group}. One can think of social groups as categories that individuals learn to recognize when growing up and living in a society. I do not model the cultural or sociological process by which these categories evolved. Rather, the focus is on the process of identification with given social groups. Thus, G is not an arbitrary collection of subsets of the population—its elements must be socially significant categories. Denote by G i the set of social groups to which agent i belongs: G i={J:J ∈ G and i ∈ J}.
The application to redistribution concentrates on two of the most politically prominent types of social groups in modern industrial societies: nations and social classes.Footnote 2 As mentioned, I focus on a single nation. Although there are other nations around, for the most part they will be kept in the background. In this nation, there are three social groups. The first two—which I term classes—are the “Poor” and the “Rich.” The third is the “Nation,” which includes all the agents in the society. The set of social groups is thus G={P, R, N}, where P={i ∈ N:y i=y p} and R={i ∈ N:y i=y r}. I use lowercase p and r to denote typical low-income and high-income agents, respectively, and uppercase P and R to denote the social groups.
The identification process involves both a cognitive and an affective factor. I begin with the former.
Perceived Distance. A key factor in categorization decisions in the cognitive psychology literature is the perceived difference between the stimulus that is to be categorized, and the attributes of the available categories. Following Turner et al. (Reference Turner, Hogg, Oakes, Reicher and Wetherell1987), I propose to adopt this approach to the process of categorizing oneself into a group. Although there are many ways to think about perceived difference, I adopt the notion of “distance in conceptual space” (e.g., Gärdenfors Reference Gärdenfors2000; Nosofsky Reference Nosofsky Robert1986, Reference Nosofsky Robert1992). Each agent is characterized by a vector of attributes or qualities q i.=(q i1, q i2, . . ., q iH). A social group is characterized by the “typical” attributes of its members, denoted q J. For simplicity, I assume q J is the mean across group members (i.e., ). q J is called the prototype of group J.Footnote 3 If attributes are coded as binary variables, then q Jh is simply the proportion of agents in group J with attribute h. The perceived distance between individual i and social group J is then represented by a weighted Euclidean distance function:
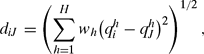
where 0 ≤ w h ≤ 1 and ∑ w h = 1. The ws are attention weights (Nosofsky Reference Nosofsky Robert1986): the more salient is attribute h relative to other attributes, the higher is w h.
This specification allows the social environment to affect perceived distances in two distinct ways. First, distances may change as the attributes of the agents (namely, the values of q i and q J) change. For example, the higher the fraction of people in a group that speak my language, the more similar I perceive myself to that group. Second, perceived distances can change as the attention paid to the various dimensions changes (e.g., as the salience of income increases relative to that of skin color).
In the application to redistribution an agent's first attribute is his or her income (y i). Assume for now that there is no within-class heterogeneity. Thus, there are a set of attributes shared by the members of the nation and a set of class-specific attributes shared by the members of one class. For simplicity, we can write all the national (or class-specific) attributes as a single binary variable. We thus have

Denote the attention weight on income by w y, the attention weight on the national attributes by w N, and on class-specific attributes by w C. The distance function is hence given by
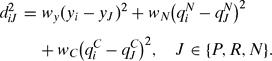
It is important to stress that although in general perceived distances can depend on agents' actions, in this application distances are exogenous. I do not directly model the determination of policies (e.g., the school system) that affect agents' attributes or the relative salience of these attributes.Footnote 4 Therefore, any possible effects of the adopted tax policy on perceived social distances are left outside the analysis. This may not be a very restrictive assumption if classes are mostly characterized by attributes relating to pretax income and to socially inherited qualities. A British survey suggests that this may be a reasonable approximation. Respondents (N=1,955) were asked which were “the best indicators of someone's social class—that is, most likely to tell you which class they belong to.” The most common answers were “their occupation” (44%), “the area in which they live” (43%) and “their accent” (38%), followed by “their income” (34%) and “which school they went to” (27%).Footnote 5
Group Status. Social identification involves more than just a cognitive process of self-categorization. It also includes an important affective factor that relates to the “value” of the group. Studies in social psychology argue that the evaluation of groups cannot often be based on some absolute standard. Rather, it is determined through social comparisons to other groups along valued dimensions of comparisons (Tajfel and Turner Reference Tajfel, Turner, Worchel and Austin1986). In our setting, one such dimension is material payoff. Let  be some measure of group J's material payoff when the tax rate is t. Let r(J) be the reference group of group J. The status of group J is then given by a simple linear function of the form

where σ1J is a positive constant. The parameter σ0J summarizes all exogenous factors that affect the status of group J. This captures the possibility that material payoffs are not the only dimensions of comparison that determine group status.Footnote 6
For the two classes, a natural measure of material payoffs is the material payoffs of their members (i.e.,  and
 . However, national material payoff can be measured in many ways, depending on the weight given to the material welfare of the poor and of the rich. I therefore write

Thus, if α = λ, then national material payoff is measured by (posttax) income per capita. If α =1, we have a Rawlsian measure of national material payoff, whereas if α equals zero it is measured by the posttax income of the nation's richest individuals.Footnote 7 Finally, I assume that each class forms the reference group of the other class. The nation's reference group is some other nation (or nations).
We are now in a position to formulate a definition of social identity and a solution concept for the model.
Definition 1. Agent i said to identify with social group J ∈ G if his utility over outcomes [tax rates] is decreasing in diJ and increasing in SJ.
In other words, identification with a group means caring about the status of that group while paying a cognitive cost that increases with the distance between the individual and the group. Loosely speaking, identification thus implies making the “group's interest” part of one's own interest. Given the status function (Equation [6]), this means caring about the material payoffs of other ingroup members. Furthermore, the cognitive cost of identification implies that as long as agents identify with a given group, they want to be similar to typical members of that group: from wearing the group's characteristic clothes and symbols to imitating typical group behavior and expressing typical group attitudes.Footnote 8
For tractability, I assume that the utility function of an agent i that identifies with group J takes a simple additive form

where β and γ are positive constants. I now propose an equilibrium concept that captures the endogenous determination of identification. Formally, it is a standard Nash equilibrium.
Definition 2. A Social Identity Equilibrium (SIE) is a profile of actions a = (ai)i∈N and a profile of social identities g = (gi)i∈N such that for all i ∈ N we have ai ∈ Ai, gi ∈ Gi and

for all a i′ ∈ A iand all g i′ ∈ G i.
Thus, SIE requires not only that actions be optimal given what others are doing, but also that each agent's social identity be “optimal” given his or her social environment. It should be stressed, however, that this is an equilibrium requirement. It is not asserted that there exists some controlled, deliberative process in which individuals “choose” their social identities optimally. Rather, the definition of SIE employs the tools of optimization to describe a steady state that takes into account the observed process whereby (1) given cognitive distance, individuals tend to identify with the group that possesses the higher status; and (2) given status, tend to identify with the group more similar to themselves.Footnote 9
Discussion
Before solving the model of redistribution, a few remarks relating the general SIE framework to some existing formal models are in order. First, in situations where one's actions do not affect the status of whatever groups one identifies with, nor one's perceived distance from these groups, an agent in the proposed framework behaves just like the selfish, material payoff maximizing agent of the standard economic model. However, the framework points to other situations where this model might be inadequate and offers a simple way of extending it to better understand these situations.
Second, the framework generalizes the prominent feature of Akerlof and Kranton's (2000) model of social identity. Akerlof and Kranton focus primarily on the effects of social “roles” and “prescriptions” that indicate the appropriate behavior for people in given social categories. “Identification” in their terminology essentially means the adoption of such rules of behavior. In the framework proposed here, modes of behavior that affect perceived distances between self and group can similarly induce agents to behave in accordance with their group's prototypical behavior. At the same time, the framework can generate utility losses from—and punishment of—nonprototypical behaviors by other group members.Footnote 10 However, in equilibrium, such conformist behavior (and punishment of deviants) only emerges under conditions that sustain identification with the group in question (i.e., its status is sufficiently high, and it is perceived as sufficiently similar to the agent). Furthermore, what constitutes the prototypical behavior may itself be determined endogenously.
Third, the framework generalizes models of altruistic preferences and allows at least a partial analysis of the circumstances under which people are more likely to hold such preferences. Specifically, because ingroup status depends positively on the payoffs of ingroup members, then in situations where actions affect these payoffs we may observe altruistic behavior. However, altruism is “parochial” rather than universal: it only applies to ingroup members (Bernhard, Fischbacher, and Fehr Reference Bernhard, Fischbacher and Fehr2006; Fowler and Kam Reference Fowler and Kam2007). Indeed, when actions affect an outgroup that competes with the ingroup for status, we may observe behavior that harms outgroup members. Moreover, in equilibrium, such ingroup favoritism is only expected under conditions that sustain identification with that ingroup. This is the focus of this article.
Finally, note that the definition of SIE does not impose any coordination requirement—in principle, one may identify with a group regardless of whether other members of that group identify with it (cf. Bawn Reference Bawn1999). Indeed, by itself, the social identity of agent i has no effect on other agents' payoffs—neither on their material payoff nor on the status of the group with whom they identify. It is only when social identity affects the choice of actions that such effects come about.
The previous remarks highlight two straight-forward—but important—implications of the general SIE framework that are left out of this analysis of redistribution. First, the social identity framework can generate deviations from self-interest due to conformity effects. If it is an established practice in a given group to oppose redistribution, and if political behavior in that group is sufficiently salient, then agents who identify with that group will modify their own political behavior accordingly (see Dickson and Scheve Reference Dickson and Scheve2006). Thus, many outcomes could be self-reinforcing. By keeping d iJ exogenous, the present application abstracts from conformity effects and focuses solely on the status effects of redistributive policies. A second implication of the general framework is that people may be more likely to support redistribution if the transfers are specifically targeted to their own group (Luttmer Reference Luttmer Erzo2001). This application largely abstracts from heterogeneity within income groups and focuses on general interest redistribution.
SOCIAL IDENTITY EQUILIBRIA
I begin the analysis by looking at how the preferred tax rate is affected by the group with whom one identifies. Let  be the preferred tax rate of an agent with income y i that identifies with group J.
Proposition 1. The tax rate preferred by a poor agent is lower if he or she identifies with the nation than if he or she identifies with his or her class:  .
The intuition is given in Figure 1. In each panel, the solid curve represents a possible choice set in the πp − πr plane. When the tax rate is zero (the top point on the curve), each agent gets his or her pretax income. As the tax rate increases, πr decreases monotonically, whereas πp initially increases but eventually decreases as the deadweight losses of taxation outweigh the gains from the transfers. When t = 1, material payoffs are equal for the rich and the poor. Note that πp reaches its maximum when t =  . The implications of class identification are illustrated in panel (a). Class identification induces individuals to care—in addition to their own material payoffs—about the relative status of that class. Therefore, the indifference curve (illustrated by the dotted line) of a poor agent that identifies with the poor class has a positive slope, yielding a higher preferred tax rate
 . National identification, on the other hand, shifts agents' social identity concerns to the status of their nation. As noted previously, national status may have to do primarily with variables that are not clearly related to tax policies—in which case the preferred tax rate would still be
 . However, to the extent that the material payoffs of the rich members of the nation also affect national status, the indifference curve of a poor nationalist has a negative slope, as illustrated in panel (b). This yields a lower preferred tax rate
 . Even in the extreme case where national status depends strongly on a Rawlsian measure of national welfare (hence, vertical indifference curves), a national identity induces a lower ideal tax rate than does a class identity.
The Voter's Choice
Note: In both panels, the solid curve depicts the implications of various tax rates for the posttax and transfers incomes of the poor (πp) and the rich (πr). When no taxes and no transfers are made, πr = y r > y p = πp. This is the point denoted t = 0. Increasing the tax rate implies moving down along the curve. The point that maximizes πp is denoted t =  . Finally, at the point denoted t = 1, full redistribution takes place and πr = πp. Panel (a) shows an indifference curve of a poor agent that identifies with his or her class (dotted line), and his or her preferred tax rate. Panel (b) shows an indifference curve and the preferred tax rate of a poor agent that identifies with his or her nation.

It is noteworthy that for a rich agent, the effect of a national identity on the preferred policy is not so clear cut. It depends on the sensitivity of national status to national material payoffs (captured by σ1N) and, crucially, on the extent to which the material payoffs of the poor affect the evaluation of national material payoffs (captured by α). If these relations are sufficiently strong, then a national identity could imply a higher ideal tax rate than does a rich-class identity (which implies zero redistribution). The possible proredistribution effect of national identity is consistent with a prominent view in political theory, according to which national identification can help promote redistributive policies (e.g., Miller Reference Miller1995; Tamir Reference Tamir1993). In a country where (contrary to the present model) the rich set the tax rate, but where national status is nonetheless significantly affected by the living conditions of the poor, a national identity may indeed be proredistributive. The evidence presented in the next section suggests that, by and large, this is not the case in industrialized and well-established democracies.
Let us now turn to the determination of the equilibrium tax rate. I first provide the intuition for the main result stated hereafter. Because the poor are the majority and because they vote sincerely, the equilibrium tax rate is the tax rate most preferred by the poor.Footnote 11 That is, the tax rate is t N*(y p) if the poor identify with their nation, and it is t P*(y p) if they identify with their class. These two tax rates are depicted on the horizontal axis in Figure 2. Now, in SIE a poor voter identifies with his or her nation rather than with his or her class if  (where lowercase p denotes a typical poor agentFootnote 12). If the inequality is reversed, he or she identifies with the poor class. The equilibrium tax rate is thus a step function of S N − S P. This is illustrated in Figure 2. For S N − S P above the
 threshold, the poor identify with their nation despite the fact that the nation is cognitively more distant from them than their class. They hence choose the relatively low tax rate t N*(y p). For S N − S P below the threshold, they identify with their class and choose the relatively high tax rate t P*(y p).
Social Identity Equilibria

At the same time, S N − S P is itself a function of the tax rate. A possible S N − S P curve is depicted in Figure 2. The crucial property of the S N − S P curve is that it is lower at t P*(y p) than at t N*(y p). The intuition is simple: a higher level of redistribution diminishes the difference in material payoffs between the rich and the poor and hence increases the status of the poor. Furthermore, to the extent that national status is affected by material payoffs, higher levels of redistribution reduce national status in the [t N*(y p), t P*(y p)] interval (partly due to the efficiency costs of taxation).
In equilibrium, S N − S P is determined by the chosen tax rate while, as pointed out, the tax rate depends on S N − S P. Depending on the parameters of the model, a unique equilibrium or multiple ones may exist. If perceived distance from the nation is high relative to perceived distance from the poor class, and if national status at t P*(y p) is low relative to the status of the poor class at that tax level, then there exists an equilibrium where the poor identify with their class and the tax rate is high at t P*(y p). Conversely, if d pN2 − d pP2 is sufficiently low relative to S N − S P at t N*(y p), there exists an equilibrium where the poor identify with their nation and the amount of redistribution is relatively low.
As Figure 2 suggests, there are situations where two “stable” equilibria exist. To illustrate this possibility, suppose the pretax income of the poor is y p= 50, that of the rich is y r=150, and that the poor compose 70% of the population (λ =.7). Suppose further that the weight of group status in the utility function is γ =.1 and that the sensitivity of both class and national status to the material payoff dimension is σ1P = σ1N =1. Then the preferred tax rate of a poor agent that identifies with his or her class is t P* =.5. If national material payoff is measured by income per capita (α = λ), then the preferred tax rate of a poor agent who identifies with the nation is t N* =.34. This gives us the two tax rates on the horizontal axis. Consider now the difference between national and class status. If there are no exogenous factors that affect the status of either group (namely σ0P = σ0N = 0), and if the material payoff of the nation's reference group is  = 100, then S N − S P = 41.3 when t = .34 and S N − S P = 20 when t = .5. Thus, if the threshold on the vertical axis [
 )] lies between 20 and 41.3, two equilibria are possible.Footnote 13 At the low tax equilibrium (with t = .34), the status of the poor class is sufficiently low to induce the poor to identify with the nation rather than with the poor even though that entails a higher cognitive cost. They thus vote for a low tax rate. But under the high tax rate (t = .5), the poor are not that far behind the rich in their standards of living and hence in their status (S N − S P} is now only 20). They now identify with the poor class and thus vote for the high tax rate.
The following proposition summarizes the main results.
Proposition 2.
1. An SIE exists.
2. There are generically two types of equilibria: one with relatively high levels of redistribution and class identification among the poor, and the other with relatively low levels of redistribution and national identification among the poor.
3. A low-tax national identity SIE exists if:
(a) common national attributes are sufficiently salient compared to income and class-specific attributes (wNis high, w Cand w yare low)
(b) exogenous sources of national status are sufficiently high (
 is high, is low),
(c) exogenous sources of poor-class status are sufficiently low (
is low).
4. The qualitative effect of pretax income inequality on the equilibrium level of redistribution is ambiguous.
5. There are conditions such that both types of SIE exist.
 is high,
 is low),
 is low).
Discussion and Possible Interpretations
Part 3(a) of Proposition 2 has to do with the effect of the distance that citizens perceive between themselves and their nation. The lower is d pN, the higher is the likelihood of a low redistribution equilibrium, other things equal. It seems plausible to assume that perceived distance from the nation is largely due to slow-changing “fundamentals” such as the development of a common national language and culture, as opposed to local or class-specific cultures (see Weber Reference Weber1976). However, as the social psychology literature suggests, perceived distances can be significantly altered by changing the relative salience of common national attributes versus class-specific attributes. Thus, a common threat to all members of the nation, salient international competition or a conflict with another nation, seem likely to make one's membership in the nation a more salient attribute, thereby reducing d pN and increasing the likelihood of a low redistribution equilibrium. In particular, a salient national security danger is likely to enhance a feeling that “we are all in the same boat”—rich and poor alike. But a national identity means less weight on class issues and less support for redistribution. This suggests that there may be an incentive for elites to hype national threats in order to diffuse domestic claims for more redistribution, or to soften opposition for a reduction in the level of redistribution.
In a similar vein, salient hardships or disasters that disproportionately threaten the poorer segments of society, are likely to enhance class identification among them and increase demand for redistribution.Footnote 14, Footnote 15 In the longer run, factors such as the transportation infrastructure and the nature of the school system—whether it fosters similarity to the nation or class distinctions—should have a crucial effect on the pattern of identification and hence on the redistributive regime.
Part 3(b) of Proposition 2 relates to the fact that group status may depend on dimensions other than the material payoffs of group members. A powerful nation, for example, is more likely to generate national identification among its members than a weak or a remorseful nation, other things equal. Post–World War II Germany is a case in point (see the cross-country patterns in the next section). Or consider Ronald Reagan's military build-up and rejection of Détente. If such policies enhanced America's stature, then according to the model they may also help explain the popularity and political success of the Reagan tax policies even among blue-collar workers. Part 3(c) of the proposition makes a complementary point regarding a strong/weak working class.
Part 4 of Proposition 2 relates to the effect of pretax inequality. The standard median voter result is that higher pretax inequality leads to more redistribution. This is not necessarily the case once social identification is allowed. The reason is that although preferred tax rates may increase with inequality for any given social identity, changes in inequality can lead to changes in the pattern of identification. This happens because the level of inequality affects both perceived distances and group status. Consider a drop in pretax inequality. This not only reduces perceived distance of the poor from the nation but also improves the condition of the poor relative to the rich. Thus, in Figure 2, both the  threshold and the S N − S P curve may shift down. If the shift in S N − S P is sufficiently large relative to the other changes, the country can move from a low-tax national identity equilibrium to a high-tax class identity equilibrium. Therefore, it is not clear that economies with higher pretax inequality will in general be at higher tax equilibria.Footnote 16
The model thus suggests that we may observe rather different levels of redistribution among economies with similar pretax income distributions and similar political institutions, and it points to several important factors that can cause such differences. But the last part of Proposition 2 says that we may observe different levels of redistribution even when these factors are held constant because different levels of redistribution serve to reinforce the identification patterns that support them. Historical contingencies can thus have a lasting effect on the redistributive system. In any case, empirically we should expect to find higher levels of national identification the lower is the level of redistribution, and vice versa.
Who Are the Nationalists?
Turning back to the model, two additional issues are worth commenting on. The first is: who are the nationalists? In the simple two-class setting considered here, the answer is rather stark: the poor.
Proposition 3. Unless the status of the poor class is sufficiently higher than that of the rich class, then in any SIE in which the rich identify with the nation, so do the poor. However, there exist SIE where the poor identify with the nation, but the rich do not.
Essentially, as long as there are no exogenous factors that endow the poor class with a significantly higher status than that of the rich, the poor are more likely than the rich to identify with the nation. Two factors are at work here. First, the more immediate social group the poor belong to—namely, the poor class—has lower status than the immediate social group of the rich. Second, most of the members of the nation are poor, which means that poor agents are in general more similar to the national prototype than the rich are.
As we see in the next section, this simple result is consistent with data available from most modern economically advanced democracies. Indeed, in these nations it seems reasonable to assume (as the model does) that the status of social classes is positively correlated with the economic conditions of these classes (see Weiss and Fershtman Reference Weiss and Fershtman1998). It is also reasonable to assume that perceived distance from the nation is not systematically higher among the poorer segments of society.
However, this need not always be the case. Consider 18th- and 19th-century Europe, where productivity resides with the bourgeoisie, but status still resides to a significant extent with the aristocracy. Furthermore, at these early stages of industrialization, much of the poor population lives in rural areas, often separated from the rest of their nation by cultural, linguistic, and geographic barriers. Perceived distance from the nation is thus higher for the rural poor than for the urban middle class (Weber Reference Weber1976, part I). Similar conditions might also characterize some developing countries today and colonized countries in the past, where much of the poor population inhabits remote rural areas, and where the middle class does not enjoy as high a status as it would based on its domestic economic position. Under these conditions, the urban middle class is more likely to hold a national identity than are the rural poor.Footnote 17
Heterogeneity of the Lower Class
A final point raised by the model concerns within-class heterogeneity. This issue merits a separate study, primarily because the sources of heterogeneity may well be related to other bases of identification (e.g., ethnic groups).Footnote 18 Nonetheless, this model allows us to make the following simple point, which relates less to the identification patterns of minorities and more to those of the “majority” population.
Proposition 4. Suppose a proportion μ ∈ (0,.5) of the poor agents possess some salient attribute x, that differentiates them from the rest of the population. Then, the equilibrium level of redistribution is weakly lower (1) the higher is μ, and (2) the more salient is attribute x compared to income and class-specific attributes.
The intuition is as follows: because μ < .5, the pivotal voters turn out to be the poor agents who do not possess attribute x. Now, as μ increases, these agents may dissociate themselves from their class—which becomes less similar to themselves—and identify with their nation. This implies a lower level of redistribution.Footnote 19 Similarly, as attribute x becomes more salient relative to attributes common to all poor agents, these pivotal voters perceive themselves as more different from the poor class and may turn to national identification.
This simple point might partly help explain the shift of significant portions of the working class in Western Europe from socialist to nationalist parties (Ignazi Reference Ignazi2003; Kitschelt Reference Kitschelt1996; Lubbers, Gijsberts, and Scheepers Reference Lubbers, Gijsberts and Scheepers2002). As Schain, Zolberg, and Hossay (Reference Schain, Zolberg and Hossay2002, 11) put it, “certainly the most common explanatory factor put forward for the electoral breakthrough of the radical right are immigration and the presence of immigrants.” Such a relationship is readily interpretable in terms of Proposition 4. Immigration of foreign workers affects primarily the composition of the poorer segments of society. As a consequence, identifying oneself as part of the working class is not as self-evident for the native workers as it used to be. Thus, support for general interest redistribution declines.Footnote 20 Note that this result does not hinge on any (empirically disputed) adverse effects of immigration on the pretax economic conditions of the natives: pretax incomes are held constant in Proposition 4.
Finally, part (2) of the proposition points to a possible channel that—even before taking into account ethnic identification—can relate the salience of attributes that divide the lower class to national identification and to redistributive politics.
EVIDENCE: NATIONAL IDENTITY AND REDISTRIBUTION
This section seeks to uncover some of the empirical relationships between national identification and redistribution, and verify whether they are consistent with the model. I examine three implications of the model:
1. Support for redistribution decreases with national identification among the nonwealthy (Proposition 1).
2. The poor are more likely than the rich to identify with their nation (Proposition 3).
3. Across democracies, there is a negative correlation between levels of national identification and levels of redistribution (Proposition 2).
I concentrate on the national identity side of the model and not the class identity side for two reasons. First, in contrast with data on national identification, data on class identification are hard to obtain. Although many surveys (e.g., the GSS, Eurobarometer, WVS) ask respondents what social class they belong to, this is at best a self-categorization question, akin to asking “which nation do you belong to?” It tells us little about identification as defined in the model.Footnote 21 Second, the model's predictions with respect to class identification seem less contentious. It would not be too surprising to find that low-income individuals with a strong “working class” identity desire more redistribution than their comrades with weak class identification. Similarly, it would hardly be ground-breaking to discover that class identification and class voting is more common in Western Europe, where there are higher levels of redistribution, than in the United States (see Evans Reference Evans2000; Lipset and Marks Reference Lipset Seymour and Marks2000). However, the model's implications regarding national identification are more novel and beg empirical investigation.
I use both micro and cross-country data. The micro data come from the WVS (waves 1–3) and the ISSP: National Identity, 1995. Each survey covers more than twenty democracies during the 1990s. The primary measure of the extent of redistribution at the national level comes from the LIS. I limit the analysis to democracies, defined as countries with a Polity IV combined score of at least 6 (following the Polity coders' recommendation).
As noted in previous sections, the model's assumptions appear better suited to industrialized, well-established democracies. For example, the model assumes that nation and (income-based) social class form the major social groups with whom individuals identify. But, particularly in less advanced economies, the more prominent social groups might be based on region, dialect, religion, or caste. The model also assumes that redistributive policies reflect the policy preferences of the majority of the population. However, in countries that have only recently turned democratic, this may not be the case. To help evaluate whether the model offers a better account for some countries than for others, the individual-level analyses are performed country by country, and for a broad set of countries. Similarly, I report cross-country data both for well-established democracies and for recently democratized countries.
Preferences for Redistribution by Income and National Identification
The definition of social identity requires that an agent care about the status of his or her group. In experimental studies, such preferences can be directly inferred from behavior. In larger empirical studies, we have to rely on survey questions. Ellemers, Kortekaas, and Ouwerkerk (Reference Ellemers, Kortekaas and Ouwerkerk1999) show that in-group favoritism in allocation decisions is captured by questions on “commitment to the group.” These consist of agreement to such statements as “I would like to continue working with my group” or “I dislike being a member of my group.” Consistent with this finding, results from an experimental study using natural groups in a political-economy game, show that willingness to forego material payoffs in order to benefit the group is best correlated with responses to the items “I am proud to be a member of my group” and “when someone criticizes my group it feels like a personal insult” (Klor and Shayo Reference Klor and Shayo2008). In both studies, in-group favoritism is not captured by mere self-categorization statements such as “I am similar to other members of my group.” Now, the WVS contains a question asking: “How proud are you to be [e.g., French]?” answered on a scale of 1 to 4 (“very proud,” “quite proud,” “not very proud,” and “not at all proud”). This question seems reasonably well suited to capture the notion of national identity.Footnote 22 As mentioned previously, no such question exists with respect to class identity.
The WVS also asks respondents to rank on a scale from 1 to 10 whether “incomes should be made more equal” or whether “we need larger income differences as incentives for individual effort.” This question captures preferences over the type of policies studied in the model, namely, ones that make incomes more equal (as opposed, for example, to policies designed to secure a minimal standard of living for the poor). These data can be used to examine the first implication of the model. The analysis is performed only on those surveys in which detailed data on respondents' income are retrievable (see Appendix C).
Figure 3 presents nonparametric estimates of the expected support for redistribution as a function of log household income. Panel (a) shows advanced economies (countries with real gross domestic product [GDP] per capita at least 50% that of the United States) and panel (b) shows less advanced economies. In each survey, the population is divided into two groups by level of pride in one's nation. A regression function is then estimated for each of the two groups, using Fan (Reference Fan1992) locally weighted regressions. The first group (shown by the solid lines) includes those who are “very proud” to be members of their nation. The other group (dashed lines) includes the rest.
Support for Redistribution by National Identity and Income

The first thing to note is that within each group, support for redistribution tends to decrease with income in most surveys. However, the striking result is that in most advanced economies, people who identify more strongly with their nation prefer a lower level of redistribution than people with low levels of identification and similar income. This pattern seems to hold in Austria, Britain, Canada, Finland, Germany (East and West), Japan, the Netherlands, Sweden, Switzerland, Taiwan, and the United States. The only advanced economies where this relationship is not apparent are Belgium, Italy, and Spain.
Outside the industrial world, the evidence is much more mixed. There is often no clear difference between the two groups in the support for redistribution. One possibility is that in less economically advanced countries, social groups that are left out of this model—such as the region, the religious community, or the caste—play a prominent role. This might also explain the absence of a clear effect in Belgium, Italy, and Spain. If the predominant immediate social group is not the class but, say, the region, then it is not clear that a shift to a national identity would generally imply less support for redistribution. Catalonia, for example, is a relatively rich region. Shifting from a Catalan to a national Spanish identity might therefore increase support for redistribution.Footnote 23 An alternative conjecture is that the difference in the patterns observed in advanced and in less advanced economies has to do with differences in the party system. Exploring these possibilities is a matter for future research.Footnote 24 The main finding at this stage is that in industrialized democracies, national identification tends to be associated with reduced support for redistribution (for a given income).
Finally, although it is impossible to assert that these surveys contain representative samples of the rich, it is interesting that there appears to be little evidence that national identity systematically enhances support for redistribution among the rich.Footnote 25
Another way of looking at these data is presented in Table 1, which reports OLS regressions of the support for redistribution on log income and dummies for level of national pride, controlling for sex, age, years of education, and log household size.Footnote 26 A separate regression is reported for each survey. The results show a negative relationship between income and preferences for redistribution in almost all countries. Furthermore, people who profess to be “very proud” of being members of their nation appear to support redistribution significantly less than people who profess to be “not proud” or “not at all proud,” controlling for income and schooling. The point estimates are negative in 26 out of 30 available surveys and appear very large when compared to the effect of income. If taken literally, the point estimates imply that moving from not being proud to being very proud of one's nation is equivalent in terms of attitudes toward redistribution, to having one's household income multiplied by a factor of between 1.5 and 3 in most western democracies. The estimated effect is exceptionally large in the two surveys from the United States. Consistent with the nonparametric estimations, the relationship between national pride and preferences for redistribution is statistically significant in most industrialized countries, but weaker in the less advanced countries. Finally, the third column of Table 1 shows that, as expected, the effect of being “quite proud” is generally smaller than that of being “very proud”—although it retains a negative sign in almost all surveys.
Support for Redistribution, Income, and National Pride

WVS data.
OLS, robust standard errors in parentheses.
Each row is a separate regression.
Dependent variable is support for redistribution, ranging from 1 (“We need larger income differences as incentives for individual effort”) to 10 (“Incomes should be made more equal”).
Reported are the estimated coefficients on log-household income and two dummies for national pride: “very proud” and “quite proud.” Omitted categories are “not proud” and “not at all proud.”
All regressions control for log of household size, years of schooling, sex, age, and age squared, except Turkey 1990, which does not control for schooling, and Taiwan 95, which does not control for household size. Missing values for household size and schooling are dummied out.
* Denotes significantly different from zero at the 10% level.
** Denotes significantly different from zero at the 5% level.
National Identification by Income
The model suggests that low-income individuals— having less to be proud of in their immediate social group compared with the rich and being more similar to the representative agent in their nation—will generally tend to identify more strongly with the nation. I now verify whether this claim is consistent with available data. I use detailed micro data from the ISSP 1995 National Identity module that contains surveys from 22 democracies. Results from the WVS—using the cruder measure of national identity employed in the previous subsection—are qualitatively similar. The ISSP includes the following six items that seem to capture our notion of national identity (see the discussion in the previous subsection).
How much do you agree or disagree with the following statements? [1. Agree strongly; 2. Agree; 3. Neither agree nor disagree; 4. Disagree; 5. Disagree strongly. “R” = Respondent]
1. I would rather be a citizen of (R's country) than of any other country in the world.
2. There are some things about (R's country) today that make me feel ashamed of (R's country).
3. The world would be a better place if people from other countries were more like the people in (R's country).
4. Generally, (R's country) is a better country than most other countries.
5. When my country does well in international sports, it makes me proud to be citizen of (R's country).
6. (R's country) should follow its own interests, even if this leads to conflicts with other nations.
Although all items gauge feelings of national pride, items 2 and 5 are conditional on transitory conditions (“things about my country today”), and may thus be less suitable to capture national identification. The estimated associations of each item with income are described in footnote 27. As a way of summarizing the data, I do the following. First, I construct a national identity scale from these six items. Answers to each item are scored from 0 to 4, with a higher score representing the more nationalist answer, and the items are then summed up with equal weights. The resulting scale (α = .61) takes values in {0,1,2,. . ., 24}. Second, I estimate a linear regression model using this scale as the dependant variable and log income as explanatory variable, controlling for log household size, sex and age. The results are presented in Table 2. The data seem overwhelmingly supportive of the notion that poorer people tend to identify more strongly with their nation. A negative relationship between income and the national identification scale is apparent in all countries surveyed. The relationship generally holds also when controlling for years of education (column 2). The results are even stronger when using a four-item scale that does not include items 2 and 5 to measure national identification (not shown).Footnote 27
National Identification, Income, and Years of Schooling
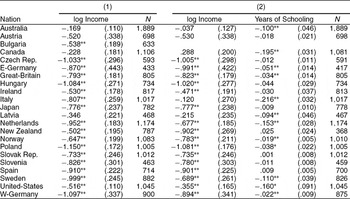
ISSP 1995 data.
OLS, robust standard errors in parentheses.
Dependent variable is national identification scale.
Each row reports the coefficient on the log of household income from two separate regressions. The regressions in column (1) do not control for years of schooling, whereas those in column (2) do, with the estimated coefficient reported. Samples do not include noncitizens. All regressions control for sex, age, and log of household size. Missing values for household size are dummied out.
*Denotes significantly different from zero at the 10% level.
** Denotes significantly different from zero at the 5% level.
Cross-Country Patterns
Finally, we come to the overall levels of redistribution and national identification. According to the model, in equilibrium we should expect high levels of redistribution to be accompanied by relatively low levels of national identification and vice versa. Because both variables are endogenous, this subsection only examines correlations.
To measure the extent of actual redistribution as defined by the model, we need data on both pretax and posttax income. The best available data that are reasonably comparable across countries are the LIS data compiled by Milanovic (Reference Milanovic2000). For each country participating in the LIS, these include the distributions of household percapita factor income and disposable income. Factor income is defined as pretransfer and pretax income, and includes wages, income from self-employment, income from ownership of physical and financial capital, and gifts. Disposable income is equal to factor income plus all government cash transfers minus direct personal taxes and mandatory employee contributions. As a measure of the extent of redistribution to the poor class, I use the “share gain” of the bottom quintile, defined as the difference between the share of the bottom quintile in factor and disposable income. For example, if the bottom quintile receives 1% of total factor income, while the same people receive 10% of total disposable income, the share gain is 9 percentage points.Footnote 28 I match these data with measures of national identification from the ISSP 1995 and the WVS, using the closest available LIS data point. Note that because individual income data are no longer required, we can use the entire set of democracies covered by the WVS between 1981 and 1998.
Figure 4 presents the association between redistribution levels and national identification using the ISSP 1995. The horizontal axis measures the median of the six-item national identity scale described previously. On the vertical axis is the share gain of the bottom quintile. Panel (a) presents all democracies participating in the ISSP with available data on the share gain. Panel (b) concentrates on established democracies, defined as democracies with at least ten years since the last substantive change in authority characteristics (defined as a 3-point change in the Polity score). This excludes countries that are less likely to have reached equilibrium by the time of these surveys (in this case, the transition countries of Eastern Europe). Both panels reveal a striking negative relationship. The association is particularly clean when we focus only on the long-established western democracies, with Germany exhibiting very low national pride and very high levels of redistribution, and the United States among the proudest and least redistributive countries. To get a sense of the strength of the association, the R 2 from regressing the share gain on national identification alone is .49 in the entire sample and .72 in the sample without the transition economies.
Redistribution and National Identity: ISSP Data
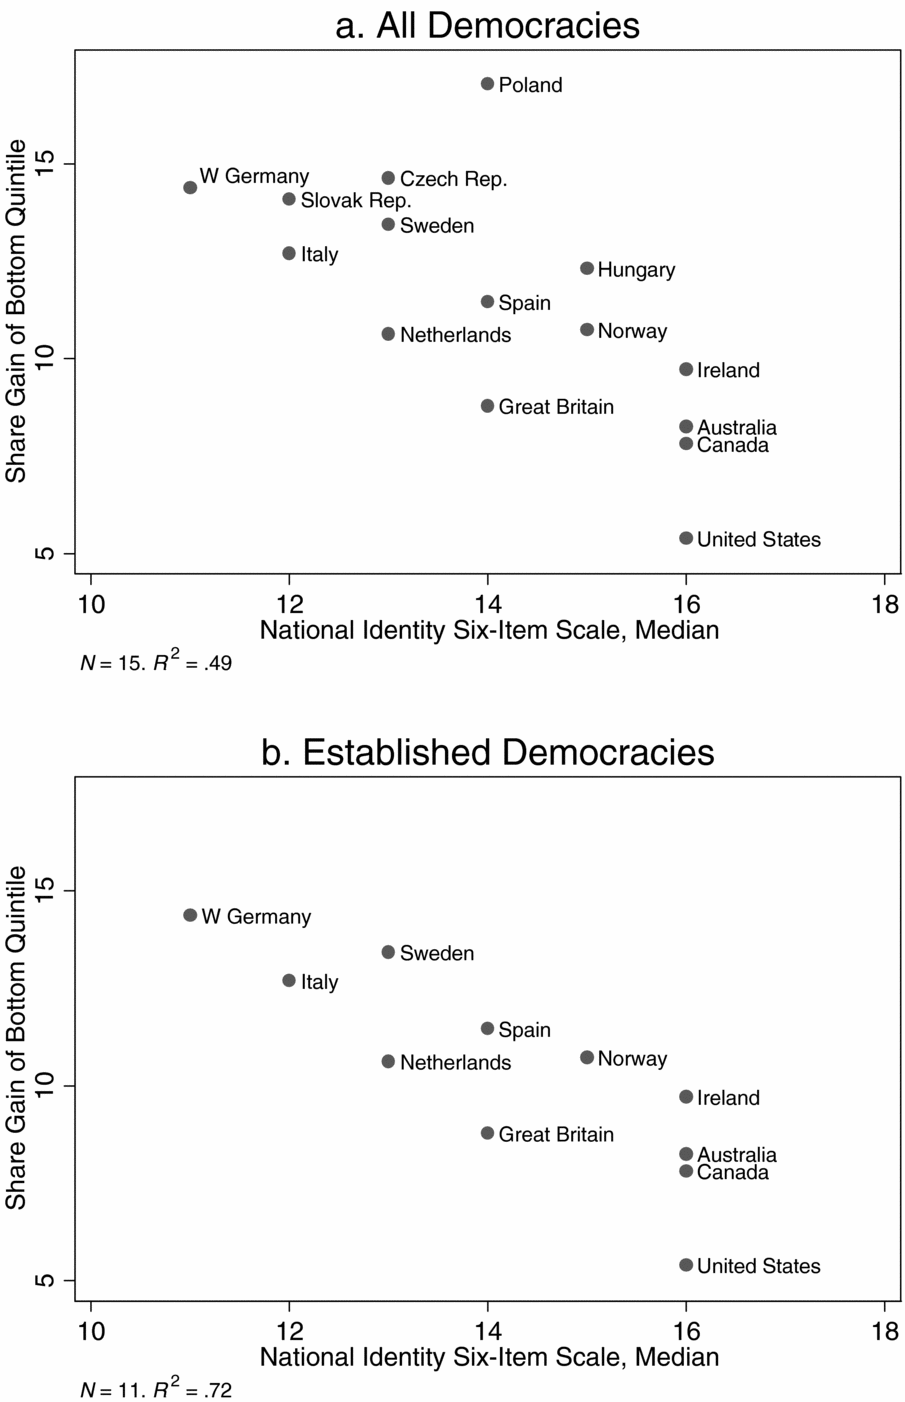
Figure 5 repeats this exercise with the larger set of surveys available from the WVS. On the horizontal axis, we now have the estimated fraction of the population in each country professing the highest level of national pride. The pattern is again extraordinarily clear, especially when focusing on established democracies. The R 2 is .6 for established democracies and .25 for the entire sample. It is important to note that the relationship is not simply driven by cross-Atlantic differences and is remarkably strong within western Europe. It is also noteworthy that this pattern holds despite the commonly held view that the welfare state makes Europeans proud of their country: the more redistributive countries are actually characterized by less national pride.Footnote 29
Redistribution and National Identity: WVS Data

Most of the negative relationship comes from cross-country variation and not variation within countries over time. Movements within countries—in both dimensions—are very small relative to the differences between countries. This suggests rather stable equilibria. To see this more clearly, Figure 6 presents the same data as in Figure 5b separately for each country on which we have more than one observation. It may be interesting to note that most of the movements accord well with the model. In particular, consider the movements that seem to have occurred between the early 1980s and the mid-1990s in Denmark, the Netherlands, Norway, and Sweden. In these countries, one observes an apparent shift to lower levels of redistribution coupled with higher levels of national identification. The reverse seems to have occurred in Canada and Spain (and perhaps also in France and Germany), where levels of redistribution increased and levels of national identification decreased during the 1990s. Why these changes occurred is a matter for further research. Indeed, some of these “changes” may be measurement noise. The finding to emphasize is the cross-country pattern.
Redistribution and National Identity Within Countries over Time

Another way of looking at the data is to add some control for ethnic diversity, which has long been implicated in reducing the taste for redistribution. Figure 7 breaks the data in Figure 5b by the proportion of ethnic minorities in the total population (the classification of countries is identical when using an ethnic fractionalization index, see footnote 30). Specifically, panel (a) shows countries where, according to Fearon's (Reference Fearon2003) data, the largest ethnic group made up at least 75% of the country population in the early 1990s. Panel (b) shows countries where the largest ethnic group comprised less than 75% of the population.Footnote 30 As Figure 7 shows, a negative relationship between national identification and redistribution exists both across relatively homogeneous countries and across heterogeneous ones.
Redistribution, National Identity, and Ethnic Diversity

Figure 7 also suggests another interesting pattern. Ethnic heterogeneity at the country level does not seem to be associated with reduced redistribution in this sample. Belgium and Spain are highly ethnically diverse; however, Spain's level of redistribution is about average, whereas Belgium's is the highest in the sample. Similarly, Australia, Finland, and (to a lesser extent) the UK are relatively homogeneous but have comparatively low levels of redistribution. This seems consistent with Proposition 4, which focuses on diversity concentrated in the lower class . This is a reasonable characterization of ethnic diversity in the United States, where the black (12%) and Hispanic (13%) minorities are concentrated in the lower class. But it does not fit the structure of ethnic diversity in Belgium (58% Flemming, 31% Walloon) or in Spain (68% Castillian, 17% Catalan, 6% Galician, 6% Basque).Footnote 31 To further investigate the effects of lower-class diversity, more systematic data on such diversity are required. Again, the main finding at this point is the overall correlation between national identification and redistribution.
As a final robustness check, Figure 8 looks at an indirect measure of redistribution, namely, social welfare expenditure as percentage of GDP (OECD data). Although this is a rather crude measure, a negative relationship is apparent using both measures of national identification. It is noteworthy that contrary to social welfare expenditure, military expenditure as a share of GDP is not negatively related to measures of national identification (in fact, the correlation is slightly positive using the WVS data).
Social Expenditure and National Identity

It is of course possible that the cross-country correlation is driven by some other factors that affect both national identification and levels of redistribution, without the direct link between the two postulated by the model. However, the micro level results presented previously somewhat limit the relevance of this possibility. As we have seen, the relationship between national identification and redistribution also holds at the individual level: within almost every western democracy, people who identify with their nation support less redistribution than people who do not. In almost every country, lower income is associated with more national identification. If the general interest long-run redistributive system reflects voters' preferences, then it would indeed be puzzling had the cross-country patterns not reflected the micro results. Overall then, in advanced and well-established democracies, the data are remarkably consistent with the model.
CONCLUSION
This article attempted to employ robust regularities observed by social psychologists and experimental economists in order to enhance our understanding of the complex processes of social identification and their interactions with economic and political variables. In particular, the article applied these regularities to study the interactions among national and class identification, income inequality, and political preferences.
The application to redistribution focused on the endogeneity of group status. Because policies affect group status, political preferences may reflect identity concerns and not just economic self-interest. Thus, identifying with the lower class increases support for redistribution, whereas identifying with the nation tends to reduce it. At the same time, the sociopolitical environment shapes the patterns of identification. In particular, low redistribution tends to make identifying with the lower class less appealing and can encourage identification with the nation. Both channels generate a negative relationship between levels of redistribution and levels of national identification. The model further allows us to analyze the likely effects of national threats and in-group heterogeneity on redistributive policies. It also points out that increased income inequality does not necessarily lead to more demand for redistribution, as it can shift the poor away from class identification.
Data from a large set of economically advanced democracies suggest that, for given income levels, national identification is associated with reduced support for income equalization. At the same time, low income is associated with national identification, even when controlling for years of schooling. These individual-level effects are in turn consistent with a remarkable cross-country relationship between income redistribution and national identification. This relationship is present in several data sources and is driven not just by the cross-Atlantic divide, but also by differences within Europe.
The analysis offered here can be extended in several directions. One is to endogenize the “supply” of perceived distance. In particular, it seems crucial to examine politicians' incentives to promote, say, a national language and culture versus advancing interclass differences (or, in the shorter run, to take actions that change the salience of national-specific or class-specific attributes). Another extension concerns the set of social categories examined—with ethnic identification being a particularly important subject.
However, although this article focuses on redistributive politics in democracies, the general framework developed here can, I believe, be fruitfully applied to a broad range of questions (see, e.g., Penn Reference Penn2008). Given the pervasiveness of identity issues in the political arena—from voting and partisanship to ethnic violence—it seems important to have a unified theory that can be used to study both the effects of group identification on political behavior and the endogenous formation of identification patterns. This article offers a step toward such a theory.
APPENDIX
A. Experimental Foundations
The theoretical framework proposed in this article attempts to capture empirical results from three strands of research that study behavior in groups: the minimal group paradigm, public goods experiments, and studies of social influence.Footnote 32 This appendix briefly reviews these results.
Minimal group paradigm
Consider the following allocation task. Subjects are assigned to one of two groups. Each subject then chooses an allocation of payoffs between two other randomly chosen subjects. The only information provided about these subjects is their group affiliation. The set of possible allocations is structured to examine whether subjects seek to maximize total payoffs, the absolute payoff of one participant, or the difference in payoffs between the two. Choices are made privately and simultaneously. There is no interaction between subjects, and they never know the decisions of other subjects, nor who is a member of what group. A crucial characteristic of the minimal group paradigm (MGP) task is that a subject's material payoff—the amount allocated to him or her by other subjects—is independent of his or her decision. Thus, material payoff maximization offers no sharp prediction of behavior.
Varying perceived distance. The MGP environment has been studied extensively in experiments initiated in the late 1960s (see especially Tajfel Reference Tajfel1970, Tajfel et al. Reference Tajfel, Billig, Bundy and Claude1971) and replicated hundreds of times (see Brewer Reference Brewer1979, and Bourhis and Gagnon Reference Bourhis, Gagnon, Brown and Gaertner2001, for reviews). Most commonly, the categorization into groups consists of making salient an attribute that differentiates members of one group from members of the other. In the terminology of this article, this manipulates perceived distances from the groups.Footnote 33 The robust result is that despite the very weak treatment, subjects systematically favor their in-group member. Furthermore, there is evidence that a majority of subjects choose allocations that maximize the relative gain in favor of the in-group member over allocations that maximize both the absolute payoff of the in-group member and the joint payoffs.
Varying group status. Consider now the effect of exogenously endowing one group with higher status. A substantial body of research, both experimental and correlational, exists on the implications. These studies consistently find that people tend to identify more with high status groups than with low status groups.Footnote 34 As measures of identification, many experimental studies use the MGP allocation task, whereas other studies use subjects' reported feelings and attitudes toward the in-group and the out-group. Similar effects of group status emerge from field studies.Footnote 35
Public goods experiments
Minimal group allocation decisions are useful for inferring identification and studying its determinants because they keep own material payoffs fixed. Public goods experiments examine behavior when siding with one's group involves a material cost. In a typical experiment, subjects need to decide how much of their endowment to contribute to a group account (the public good), where benefits accrue to all group members. Each group member has a clear incentive to contribute zero (this is the dominant strategy for a material payoff maximizer). However, overall payments are maximized if every subject contributes his or her entire endowment.
Experimental results show that, keeping material payoffs fixed, individuals tend to contribute more to their group when attributes that are common to all group members are highlighted, compared to treatments that highlight attributes that only some group members share.Footnote 36 Indeed, it has been shown that making the membership in a randomly assigned group sufficiently salient leads to higher contributions (Eckel and Grossman Reference Eckel and Grossman2005) and that contributions increase when the group is physically closer (i.e., seated in the same room rather than in another room) (Orbell, Van-de-Kragt, and Dawes Reference Orbell, Alphons and Dawes1988). Studies also suggest that contributions tend to decrease with in-group heterogeneity.Footnote 37
Finally, researchers have studied situations where the payoff structure is augmented to include a negative effect of one's contribution on the payoffs of out-group members. If agents are only interested in their own material payoffs, or even only in their group's material payoff (“parochial altruism”), this should make no difference to the amounts contributed. In practice, such intergroup competition substantially increases contributions.Footnote 38
Conformity
Conformity refers to the act of changing one's behavior to match the responses of others (Cialdini and Goldstein Reference Cialdini and Goldstein2004). A significant literature on social influence has shown that individuals are more likely to conform to views and behaviors of members of their own group than to those of out-group members.Footnote 39 Furthermore, people conform more to in-group norms of behavior when their group membership is made more salient, by highlighting group concerns, by making explicit comparisons between the ingroup and the outgroup, or by making group identity more salient than individual identity.Footnote 40
To sum up: When led to perceive themselves as similar to their group, or when their group is endowed with high status, subjects often reveal a preference for a high relative position of their group in comparison to other groups, and appear to be willing to sacrifice personal material gain to promote that goal. They also show a stronger tendency to conform to views and behaviors of members of their group than to those of out-group members.
B. Proofs
Proof of Proposition 1:
Consider an agent that identifies with the poor group. By Definition 1 and Equation (8), his or her utility is given by

Substituting for the status function from Equation (6) and using Equations (1) and (2) to substitute for πi, R and P, we have

where δ ≡ y r − y p > 0. Solving for the optimal tax rate under y i = y p, we obtain

Similarly, for an agent that identifies with the Nation, we have (using (7))

which, for y i = y p, yields the following optimal tax rate

Proof of Proposition 2:
Lemma 1.

Proof: From (9) we know that t P*(y p) > . Since maximizes πp, it must be the case that S P(t P*(y p)) > S P(). Furthermore, since  and t N*(y p) ≤ , we have

By a similar argument, S N(t N*(y p)) ≥ S N(). Furthermore,

Since the second term in the square brackets is always negative while the first term is negative for t > , we have  for all t > . Since t P*(y p) > this implies

Together, (11) and (12) prove the lemma.
I now prove the Proposition.
(1) Existence. Consider the following profile of identities and actions:

where g i* ∈ {R,N} is an optimal identity for agent i ∈ R given t = t P*(y p). Note all agents vote sincerely as assumed by the political mechanism. Suppose this profile is not an equilibrium. Since the poor are the majority, the chosen tax rate is t* = t P*(y p). Furthermore, no agent can change the chosen tax rate by unilaterally changing his or her vote (recall the number of poor is greater than the number of rich by more than one), and hence no agent i can unilaterally change either πi,S R,S P or S N. Since by construction the identities of the rich satisfy the equilibrium condition, if this profile is not an equilibrium it must be the case that for some poor agent, the choice of identity is not optimal. That is, at t P*(y p) identifying with P is strictly worse than identifying with N, which implies

But since there is no within-class heterogeneity, both d iN and d iP are identical for all i ∈ P. By Lemma 1, this implies

Therefore, identifying with the nation is optimal for poor agents under t = t N*(y p). Thus, the following profile is an equilibrium:

where g i** ∈ {R, N} is an optimal identity for agent i ∈ R given t = t N*(y p).
(2) If in equilibrium all the poor identify with their class then they all vote for t P*(y p), which, since they are the majority, is the chosen tax rate. Similarly, if all the poor identify with their nation, then the chosen tax rate is t N*(y p) < t P*(y p). I now show that except under two very specific conditions, these are the only types of equilibria that can occur. Note first that the equilibrium tax rate t* can only take one of two values. To see this, use equations (9) and (10) and similarly solve for the preferred tax rates of the rich to obtain

Since the rich are a minority, (13) implies that the median preferred tax rate must be either t P*(y p) or t N*(y p). This means that there are only two cases where it is possible to have an equilibrium where some poor identify with their class and some identify with the nation. That is, only if the following equality holds
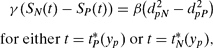
where lowercase p denotes a typical poor agent. In all other cases, all the poor strictly prefer one (and the same) identity to the other.
(3) Restrict attention to equilibria where all the poor identify with the same group. Thus, all the poor are identical, and we can denote a typical poor agent by lowercase p. Given that all agents vote sincerely, no agent can unilaterally change the tax rate. Hence, the equilibrium condition implies that

But in equilibrium t* = t g p* (y p). We thus obtain the following conditions:
(c1) t N*(y p) is an equilibrium tax rate if γ [S N(t N*(y p)) − S P(t N*(y p))] ≥ β (d pN2 − d pP2).
(c2) t P* (y p) is an equilibrium tax rate if γ [S N(t P*(y p)) − S P(t P*(y p))] ≤ β (d pN2 − d pP2).
From equation (5), we have

and

where w C = 1 −w y − w N. From equations (6) and (7), we have
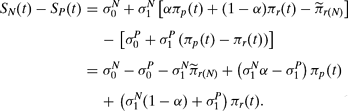
Conditions (c1) and (c2) together with equations (14) and (15) yield the comparative statics in part 3a of the Proposition, and with equation (16), yield the comparative statics in parts 3b and 3c.
(4) Consider a fall in the inter class difference in pretax income δ ≡ y r − y p, keeping all other parameters constant (including mean national income y and the proportion of the poor λ). This means pretax income inequality falls. To see that the effect on the equilibrium tax rate is ambiguous, consider the case where α = λ ∈ (.5,1), and suppose the economy is initially at a national identity equilibrium. Note first that by equation (14), a fall in δ reduces d pN2. Second, from equations (16), (1), and (2), we have
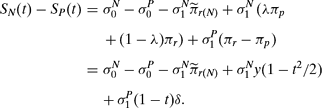
From (10), we obtain

Plugging (18) into (17) and differentiating with respect to δ yields
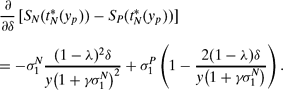
Now, if this derivative is negative in the range of δ we're considering (e.g., if σ1P is sufficiently small), then the fall in δ causes both an increase in S N − S P at t N*(y p) and a drop in (d pN2 − d pP2). Condition (c1) therefore still holds and the economy remains at a national identity equilibrium. Note however that the equilibrium tax rate is lower as a result of the lower δ (by equation (18)).
If the derivative in equation (19) is positive in the range of δ we're considering (e.g., if λ is sufficiently large), then as δ falls so does S N − S P at t N*(y p). If this change is large enough, condition (c1) no longer holds, which implies that the economy switches to a class identity equilibrium. Using (9), the tax rate in this case is
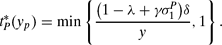
Let δ0 be the interclass difference in income before the change and δ0 − ϵ > 0 the interclass difference after the change. Then, using equations (18) and (20), the equilibrium tax rate has increased if

which holds if λ is sufficiently large.
(5) Fix all parameters of the model except σ0N. This implies that t N*(y p), t P*(y p) and d pN2 − d pP2 are fixed. By equation (17), there exists a σ0N ∈ ℝ such that S N(t N*(y p)) − S P(t N*(y p)) =  . By condition (c1) t N*(y p) is then an equilibrium. But by Lemma 1, we also have S N(t P*(y p)) − S P(t P*(y p))< . Hence, by condition (c2), t P*(y p) is an equilibrium.
Proof of Proposition 3:
Consider an SIE where some rich agent identifies with the nation. From the equilibrium condition, we have

where r is a typical rich agent. From equation (5), we have


Plugging (22) and (23) into (21) and rearranging, we get


Thus, unless  , the term in square brackets is positive; hence, γ S N − β d pN2 > γ S P − β d pP2 and the poor identify with the nation.
Consider an SIE where γ S N − β d pN2 = γ S P − β d pP2 and the poor identify with the nation. If the condition S R − S P >  holds, then the rich do not identify with the nation since γ S N − β d rN2 < γ S R − β d rR2.
Proof of Proposition 4:
Let q ix equal unity if agent i has attribute x and zero otherwise, and call these agents type 1 and type 0, respectively. Let w x > 0 be the associated attention weight and μ ∈ (0,0.5) be the proportion of poor agents that are type 1. All other attributes are as before.
Modifying equations (14) and (15) to include the new attribute, perceived distances of poor agents are
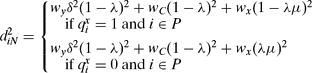

Define
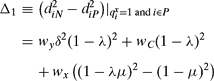

I now show that in any SIE, the chosen tax rate is the one preferred by the type 0 poor. From (26) and (27), we have

Thus, whenever type 0 poor identify with the poor class, so do type 1 poor. Since the poor are a majority, the chosen tax rate in this case is t P*(y p). If both type 0 and type 1 poor identify with the nation, then the chosen tax rate is t N*(y p). Finally, if type 0 poor identify with the nation and type 1 poor identify with their class, then by (13) and by the fact that neither the rich nor the type 1 poor are the majority, the median voter is again type 0 poor. The equilibrium conditions are thus still (c1) and (c2) from the proof of proposition 2, but with (d pN2 − d pP2) replaced with Δ0 in the statement of both conditions.
Next, note from (27) that Δ0 is decreasing in μ. Thus, starting from an SIE with t* = t N*(y p) an increase in μ does not change the equilibrium tax rate (condition (c1) still holds). Conversely, starting from an SIE with t* = t P*(y p) an increase in μ may imply that condition (c2) no longer holds, so that γ[S N(t P*(y p)) − S P(t P*(y p))] > β Δ0. This means t P*(y p) cannot be an equilibrium tax rate (type 0 poor strictly prefer to identify with the nation under this tax rate), and the unique equilibrium is t* = t N*(y p). A similar result obtains with respect to an increase in w x and a decrease in w y and w C.
C. WVS Household Income Data
Data are from the first three waves of the WVS (Inglehart et al. Reference Inglehart2000). The WVS reports a measure of total, pretax household income “counting all wages, salaries, pensions and other incomes that come in . . . before taxes and other deductions.” For most countries, household income is reported in ten categories, where the lowest and uppermost categories are open ended. (The United States in the second wave has several open categories at the top. This does not alter the form of the likelihood function used to estimate the distribution). These income categories are not deciles, Individual level analysis in this article uses only data from those countries where the income categories' cutoff points are known. A minor problem is that of assigning individuals a level of income based on the reported categories, that is, of assigning a specific point within the reported interval. This is done here by assuming a log-normal distribution of household income within each nation and wave, and estimating the parameters of the distribution by maximum likelihood. Once one has the distribution, each individual is assigned the median point conditional on the interval within which his or her income lies. All calculations were performed using the sampling weights in the different nations and waves.
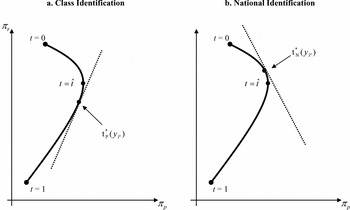
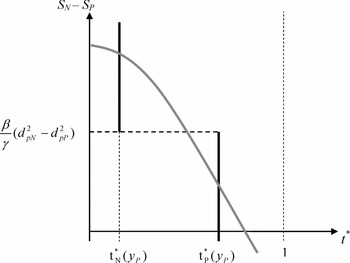
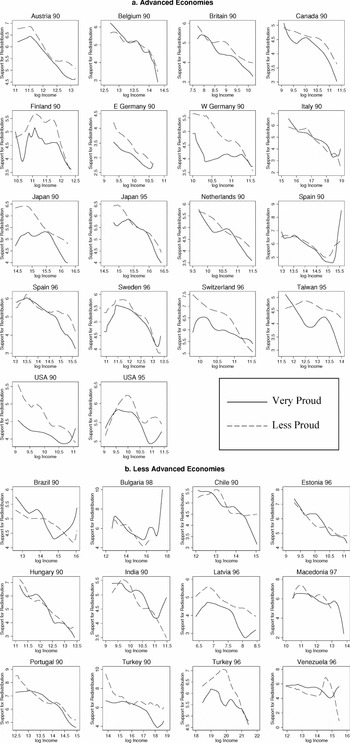
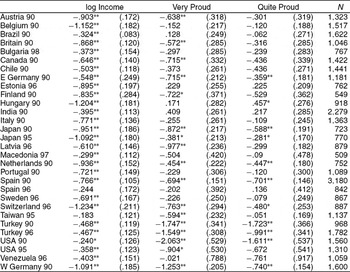
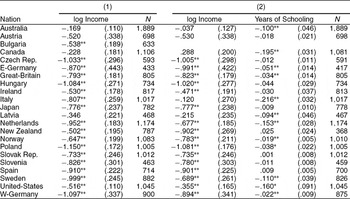
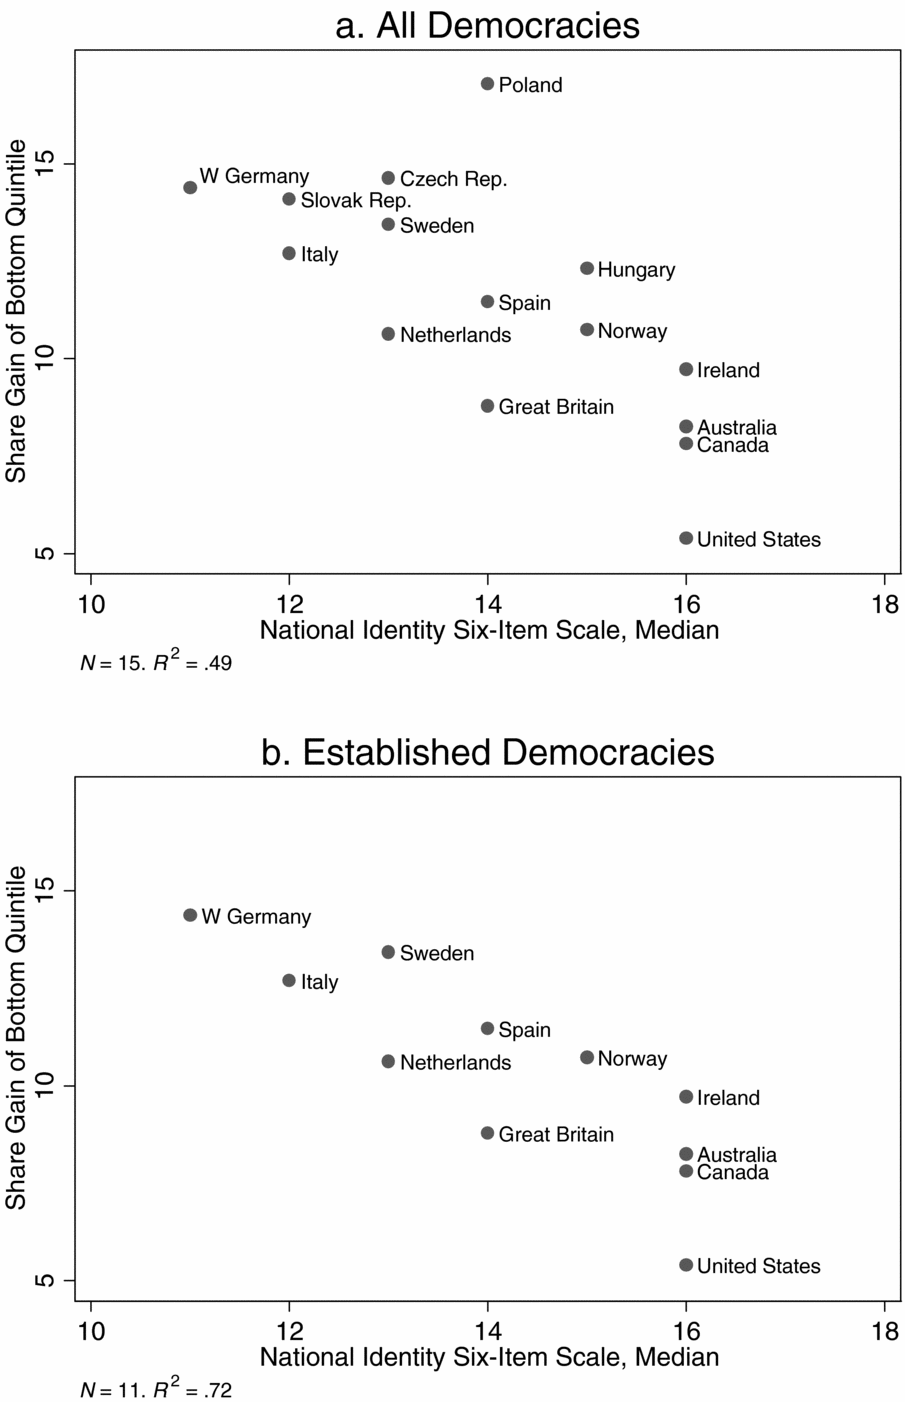
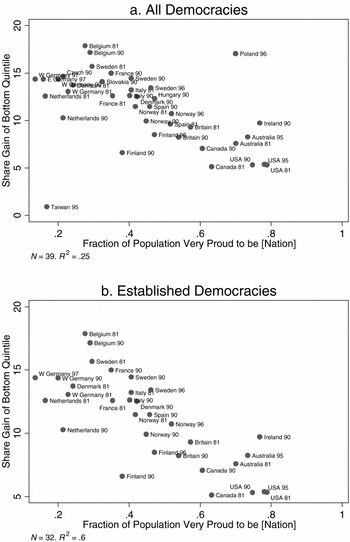
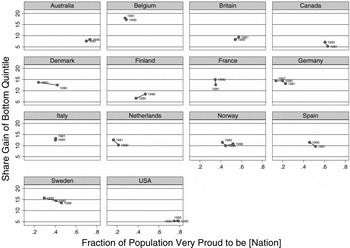
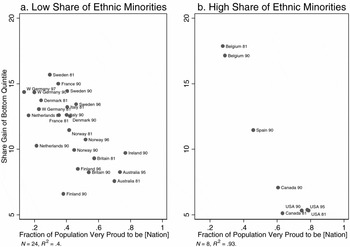
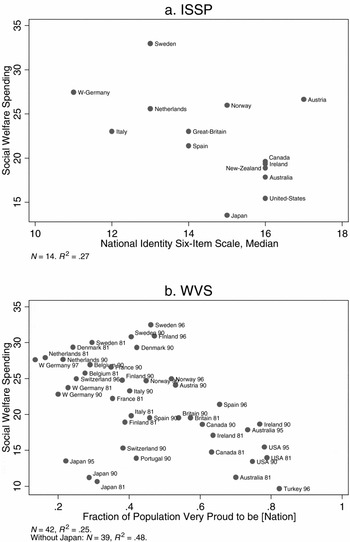



Comments
No Comments have been published for this article.