Introduction
Attention-deficit hyperactivity disorder (ADHD) is associated with alterations in brain development, including smaller total brain and subcortical structure volumes (Hoogman et al., Reference Hoogman, Bralten, Hibar, Mennes, Zwiers, Schweren and Franke2017; Shaw et al., Reference Shaw, Ishii-Takahashi, Park, Devenyi, Zibman, Kasparek and White2018). However, variability in findings is substantial (Frodl & Skokauskas, Reference Frodl and Skokauskas2012; Valera, Faraone, Murray, & Seidman, Reference Valera, Faraone, Murray and Seidman2007). Included in this uncertainty are the effects of gender due to a preponderance of male samples (Frodl & Skokauskas, Reference Frodl and Skokauskas2012), of medication due to often limited information on medication history (Frodl & Skokauskas, Reference Frodl and Skokauskas2012), and potential variation with development (Shaw et al., Reference Shaw, Ishii-Takahashi, Park, Devenyi, Zibman, Kasparek and White2018). Nonetheless, smaller total brain volume (TBV) appears to be a feature of ADHD, especially at younger ages (Castellanos et al., Reference Castellanos, Lee, Sharp, Jeffries, Greenstein, Clasen and Rapoport2002; Greven et al., Reference Greven, Bralten, Mennes, O'Dwyer, van Hulzen, Rommelse and Buitelaar2015). Crucially for etiological models, it remains unclear how structural changes in ADHD relate to the disorder's genetic liability. Moving that question forward is the central aim of the current study.
The genetic underpinnings of ADHD (and brain development) are complex, involving both common and rare genetic variants, as well as likely epigenetic effects (Faraone & Larsson, Reference Faraone and Larsson2019). While both total brain and subcortical volumes appear to have substantial heritability (Blokland, de Zubicaray, McMahon, & Wright, Reference Blokland, de Zubicaray, McMahon and Wright2012), whether the genetic factors influencing ADHD susceptibility also play a role in brain development related to ADHD is largely unknown.
Here we investigate the effects of common DNA variants using a polygenic risk score (PGS), an approach that has proven fruitful in studies of ADHD (Riglin et al., Reference Riglin, Collishaw, Thapar, Dalsgaard, Langley, Smith and Thapar2016) and other disorders (Wang et al., Reference Wang, Zhang, Li, Zhu, Liu, Qin and Liu2017; Whalley et al., Reference Whalley, Hall, Romaniuk, Macdonald, Lawrie, Sussmann and McIntosh2015). Recent large discovery datasets have enabled effective confirmation tests of pathophysiological models using neuro-biological features of ADHD, such as executive functioning (Nigg et al., Reference Nigg, Gustafsson, Karalunas, Ryabinin, McWeeney, Faraone and Wilmot2018).
TBV is a potentially important indicator of neurodevelopmental processes and provides the foundation for comparative brain development in childhood pathologies. Subcortical structures are potentially important for their specific functional associations, as well as clues to developmental timing. Differential volumetric loss may reflect regional differences in gene expression (Hess, Akutagava-Martins, Patak, Glatt, & Faraone, Reference Hess, Akutagava-Martins, Patak, Glatt and Faraone2018). Five meta-analyses (Ellison-Wright, Ellison-Wright, & Bullmore, Reference Ellison-Wright, Ellison-Wright and Bullmore2008; Frodl & Skokauskas, Reference Frodl and Skokauskas2012; Nakao, Radua, Rubia, & Mataix-Cols, Reference Nakao, Radua, Rubia and Mataix-Cols2011; Norman et al., Reference Norman, Carlisi, Lukito, Hart, Mataix-Cols, Radua and Rubia2016; Valera et al., Reference Valera, Faraone, Murray and Seidman2007) and one major mega-analysis and meta-analysis with over 1000 cases and controls (Hoogman et al., Reference Hoogman, Bralten, Hibar, Mennes, Zwiers, Schweren and Franke2017) have consolidated what is known about total brain and subcortical volumes in ADHD. Norman et al. reported that ADHD was associated with smaller volume in the putamen/globus pallidus and the right caudate nucleus (Norman et al., Reference Norman, Carlisi, Lukito, Hart, Mataix-Cols, Radua and Rubia2016). The ENIGMA consortium mega-analysis found that ADHD children under age 15 years had reliably smaller total brain (d = 0.14), putamen, caudate, amygdala, and nucleus accumbens volumes – again with small effect sizes (d = 0.13–0.19) (Hoogman et al., Reference Hoogman, Bralten, Hibar, Mennes, Zwiers, Schweren and Franke2017). They reported that sex differences and medication effects were not reliable. Although the ENIGMA study did not examine cerebellum, a large NIH study reported smaller cerebellar volume in ADHD (Wyciszkiewicz, Pawlak, & Krawiec, Reference Wyciszkiewicz, Pawlak and Krawiec2017), therefore we also examined cerebellum.
Yet for all of these findings, their relation to polygenic risk for ADHD is almost unstudied. One recent study examined ADHD polygenic risk and subcortical brain volumes in children with and without traumatic brain injury, but did not examine the correlation of polygenic risk with subcortical brain volume itself (Stojanovski et al., Reference Stojanovski, Felsky, Viviano, Shahab, Bangali, Burton and Ameis2019). Another recent study examined the relationship between polygenic scores for several psychiatric disorders and brain volumes in a population cohort, and found caudate volume associated with ADHD polygenic risk (Alemany et al., Reference Alemany, Jansen, Muetzel, Marques, El Marroun, Jaddoe and White2019). However, ours is the first report to examine the subcortical structures proposed in Hoogman et al. (Reference Hoogman, Bralten, Hibar, Mennes, Zwiers, Schweren and Franke2017) for ADHD, and TBV, in relation to ADHD polygenic risk in a large, well-characterized case–control study.
The small effect sizes seen in the ENIGMA meta-analysis may be due to heterogeneity in the disorder (Costa Dias et al., Reference Costa Dias, Iyer, Carpenter, Cary, Wilson, Mitchell and Fair2015; Fair, Bathula, Nikolas, & Nigg, Reference Fair, Bathula, Nikolas and Nigg2012) or heterogeneity in study designs (e.g. age, scanners, etc.). The studies pooled in the meta-analyses and mega-analysis mostly have relatively small sample sizes. There remains a need for more study of girls, and it is notable that none of the meta-analyses considered motion artifact as a potential source of variation (Savalia et al., Reference Savalia, Agres, Chan, Feczko, Kennedy and Wig2017), which we account for in the current study. However, the major gap we note, and our primary focus, is the need to clarify how common genetic risk for ADHD relates to putative ADHD brain correlates.
The dearth of studies that can consider sex-specific effects is important. Sex differences may be crucial for understanding the mediators of genetic influences on ADHD. ADHD is more common in males for unclear reasons (Martel, Reference Martel2013) and distinct features of development in girls are important, yet often overlooked (Hinshaw, Reference Hinshaw2018). Brain development differs normatively in boys and girls due in part to hormonal influences (Király et al., Reference Király, Szabó, Tóth, Csete, Faragó, Kocsis and Kincses2016; Martel, Reference Martel2013), suggesting that developmental vulnerabilities that differ by sex may be related to ADHD (Wang et al., Reference Wang, Xu, Li, Li, Zuo, Liao and Joshi2018). Yet, common genetic liability appears to be similar in boys and girls with ADHD as measured by a polygenic score (Martin et al., Reference Martin, Walters, Demontis, Mattheisen, Lee, Robinson and Neale2018). Taken together, these findings suggest that genetic risk for ADHD may operate via different mechanisms in boys and girls – exemplifying etiological heterogeneity in ADHD. Accordingly, we planned to evaluate sex-by-diagnosis interactions carefully.
Our primary aim was to discover whether TBV or any major subcortical volume is related to ADHD genetic risk, while secondarily considering sex effects and using updated motion correction methodology.
Methods
Participants
Participants were 501 children with reliable MRI data, of whom 312 were unrelated and of northern European ancestry. All reported results are from analyses conducted on this genetically homogeneous subset of 312 children. The children's average age was 10.2 years. ADHD was deliberately oversampled to ensure adequate clinical variation to detect the genetic signal and to enable us to examine ADHD heterogeneity. To preserve the representativeness of the sample, we did not oversample for sex or other demographics. Thus, we expected groups to differ on sex ratio and possibly on socioeconomic standing.
Recruitment and diagnostic assignment
Human subjects and ethics approvals were obtained from the local University Institutional Review Board. A parent/legal guardian provided written informed consent, and children provided written assent. After screening, a clinical evaluation was conducted using standardized, well-normed rating scales from parent and teacher, parent semi-structured clinical interview, child intellectual testing, and clinical observation. Best estimate research diagnoses and final eligibility were established by a team of two experienced clinicians (a child psychiatrist and a child psychologist) who independently arrived at the diagnosis. See the online Supplementary Materials for further details and exclusion criteria. The flow chart for participation eligibility is depicted in online Supplementary Fig. S1.
MRI acquisition and processing
Details of the MRI acquisition are in the online Supplementary Materials. All data were processed following slightly modified pipelines developed by the Human Connectome Project (Mills et al., Reference Mills, Miranda-Dominguez, Mills, Earl, Cordova, Painter and Fair2017; Miranda-Dominguez et al., Reference Miranda-Dominguez, Feczko, Grayson, Walum, Nigg and Fair2017). These pipelines require the use of FSL (Jenkinson, Beckmann, Behrens, Woolrich, & Smith, Reference Jenkinson, Beckmann, Behrens, Woolrich and Smith2012) and FreeSurfer (Fischl, Reference Fischl2012). Gain field distortion-corrected T1-weighted volumes were first aligned to the Montreal Neurological Institute (MNI) AC-PC axis and then non-linearly normalized to the MNI atlas. Later, the T1-weighted volume was re-registered to the MNI template (Fonov et al., Reference Fonov, Evans, Botteron, Almli, McKinstry and Collins2011) using boundary-based registration (Greve & Fischl, Reference Greve and Fischl2009) and segmented using the recon-all procedure in FreeSurfer.
The images went through a manual QC protocol developed by the Developmental Cognition and Neuroimaging Lab at Oregon Health & Science University. Post-FreeSurfer models were visually inspected, using the BrainSprite Viewer (https://github.com/surchs/brainsprite), to determine if the processing pipeline would accurately extract volumetric measurements. MRIs were included only if: (1) the T1 was properly aligned with the MNI registration atlas, (2) delineation between white and grey matter was achieved with minimal error, (3) blurriness and artifacts from movement did not distort segmentation, and (4) there was no significant warping of the T1 image.
We addressed the issue of motion during MRI acquisition in two ways. First, subjects whose scans did not pass the manual QC procedure were removed. Second, an estimate of the amount of motion during the scan [average framewise displacement (FD)] was included as a covariate in the regression models.
Motion estimation
Blood oxygen level-dependent (BOLD) data acquired after the structural scans were utilized as a best estimate of motion, based on a recently published procedure (Savalia et al., Reference Savalia, Agres, Chan, Feczko, Kennedy and Wig2017). Because participants tend to move at similar rates throughout a run (Dosenbach et al., Reference Dosenbach, Koller, Earl, Miranda-Dominguez, Klein, Van and Fair2017), motion during the BOLD scans can be utilized to estimate motion during structural scans. Details of the motion estimation procedure are in the online Supplementary Materials.
Polygenic score computation
The ADHD polygenic score was based on the results from a genome-wide association study (GWAS) meta-analysis of subjects of European-ancestry (19 099 ADHD cases, 34 194 controls) conducted by the Psychiatric Genomics Consortium (Demontis et al., Reference Demontis, Walters, Martin, Mattheisen, Als, Agerbo and Neale2019), and has been described previously (Nigg et al., Reference Nigg, Gustafsson, Karalunas, Ryabinin, McWeeney, Faraone and Wilmot2018). Polygenic scores for brain volume measures were based on a GWAS of 30 717 subjects of European-ancestry conducted by the ENIGMA Consortium (Hibar et al., Reference Hibar, Stein, Renteria, Arias-Vasquez, Desrivières, Jahanshad and Corvin2015). An intracranial volume polygenic score was also created from the combined ENIGMA + CHARGE consortium data (Adams et al., Reference Adams, Hibar, Chouraki, Stein, Nyquist, Rentería and Rundek2016).
The polygenic scores represent the cumulative effect of all trait-associated (GWAS p < 0.5) single nucleotide polymorphisms (SNPs) across the genome. The score for each individual is a weighted-average of all their trait-associated alleles, where the weight for each allele is the effect size (β or log of odds ratio) of the SNP association. Details of how the polygenic scores were constructed, as well as genotype processing and QC, are available in the online Supplementary Materials.
Data analysis
Regression models with TBV as the outcome were adjusted for age, sex, and average FD. Regression models with subcortical volumes (nucleus accumbens, amygdala, caudate, cerebellum, hippocampus, pallidum, putamen, thalamus) as the outcome were also adjusted for TBV (equations 1–3 below). Volume measures were the average of left and right volumes, following the ENIGMA study (Hoogman et al., Reference Hoogman, Bralten, Hibar, Mennes, Zwiers, Schweren and Franke2017), and were standardized for all analyses. Cohen's d measures, calculated using equation 10 in Nakagawa and Cuthill (Reference Nakagawa and Cuthill2007), are reported for the effect size of categorical variables (diagnosis and medication use). Standardized regression coefficients are reported for the effect sizes of the polygenic scores.
We included sex interaction terms for all variables of interest (diagnosis, PGS, medication) because of the evidence for differences in brain development between the sexes. We performed secondary sex-stratified analyses, regardless of whether a sex interaction was significant, to aid the interpretation of sex effects and for completeness of reporting. However, differences in sex-specific effects should be interpreted with caution when the sex-interaction term was not significant in the primary analysis. Given the limitations of sample size and the small effects being studied, we report effect estimates and 95% confidence intervals for all nominally significant effects. Unadjusted and FDR-adjusted p values, corrected for the 9 volumes tested, are reported in Tables 2 and 3. Results for the following regression models are reported (note: models 1–3 were also done with TBV as the outcome):
 $${\rm volume}\; \sim \;{\rm age} + {\rm sex} + {\rm FD} + {\rm TBV} + {\rm diagnosis} + {\rm sex} \times {\rm diagnosis}$$
 $${\rm volume\;\sim \;age}+{\rm sex} + {\rm FD} + {\rm TBV} + {\rm medication} + {\rm sex} \times {\rm medication}$$
 $${\rm volume\;\sim \;age}+{\rm sex}+{\rm FD} + {\rm TBV} + {\rm PG}{\rm S}_{{\rm ADHD}} + {\rm sex} \times {\rm PG}{\rm S}_{{\rm ADHD}}$$
 $${\rm TBV}\;\sim {\rm \;age}+{\rm sex} + {\rm FD} + {\rm PG}{\rm S}_{{\rm ICV}} + {\rm sex} \times {\rm diagnosis}$$
 $${\rm TBV}\;\sim \;{\rm age}+{\rm sex} + {\rm FD} + {\rm PG}{\rm S}_{{\rm ICV}} + {\rm sex} \times {\rm PG}{\rm S}_{{\rm ADHD}}$$
A statistical mediation analysis was performed to test the plausibility of the hypothesis that genetic risk for ADHD is mediated through differences in brain volume. The analysis was done with the mediation package in R (Tingley, Yamamoto, Hirose, Keele, & Imai, Reference Tingley, Yamamoto, Hirose, Keele and Imai2014), with 500 bootstrapped simulations used to estimate model parameters.
Results
Overview and sample description
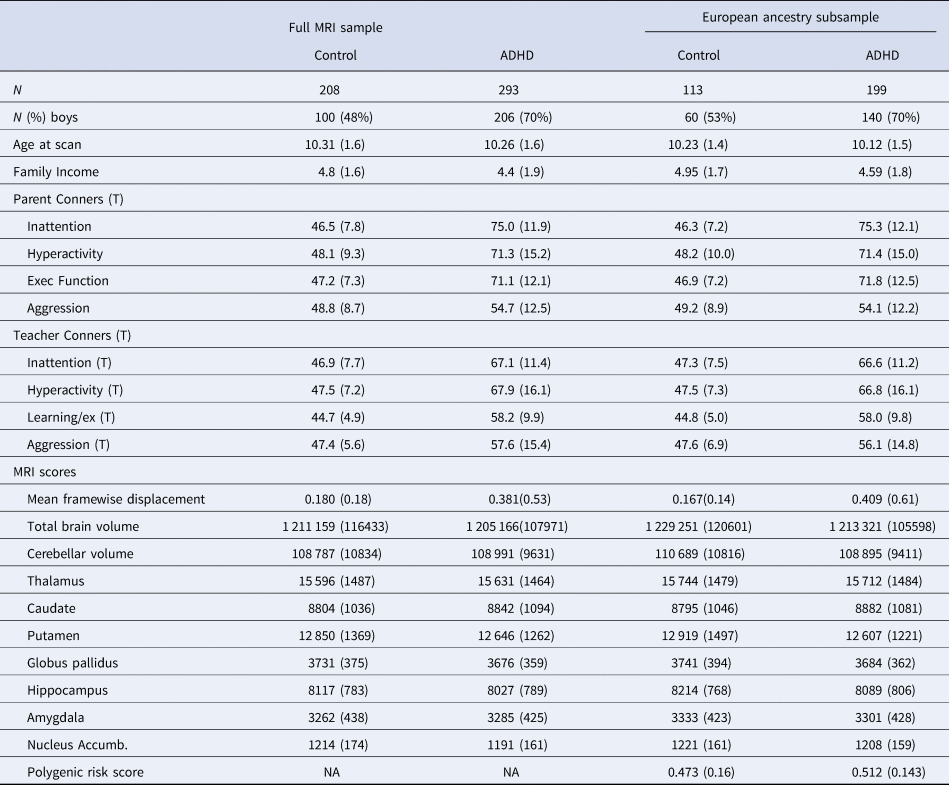
Table 1 provides the clinical and demographic description of the sample as well as the raw MRI data for all available single scans (N = 501) and the European ancestry subgroup (N = 312) utilized in the reported analyses. Diagnostic groups did not differ significantly in age or income (Wilcoxon p values >0.1). However, as expected, the ADHD group had a higher proportion of males (p < 0.05).
Raw data sample descriptions (mean, s.d.)

Conners scores are T-scores based on national norms; ADHD medications are listed in Supplemental Table S1. PGS = polygenic score as explained in the text. All volume measures are given in mm3. Family income measures are based on the following scale: 1 = less than $25 000, 2 = $25 000–$35 000, 3 = $35 000–$50 000, 4 = $50 000–$75 000, 5 = $75 000–$100 000, 6 = $100 000–$130 000, 7 = more than $150 000.
Primary analyses
Brain volumes associated with ADHD
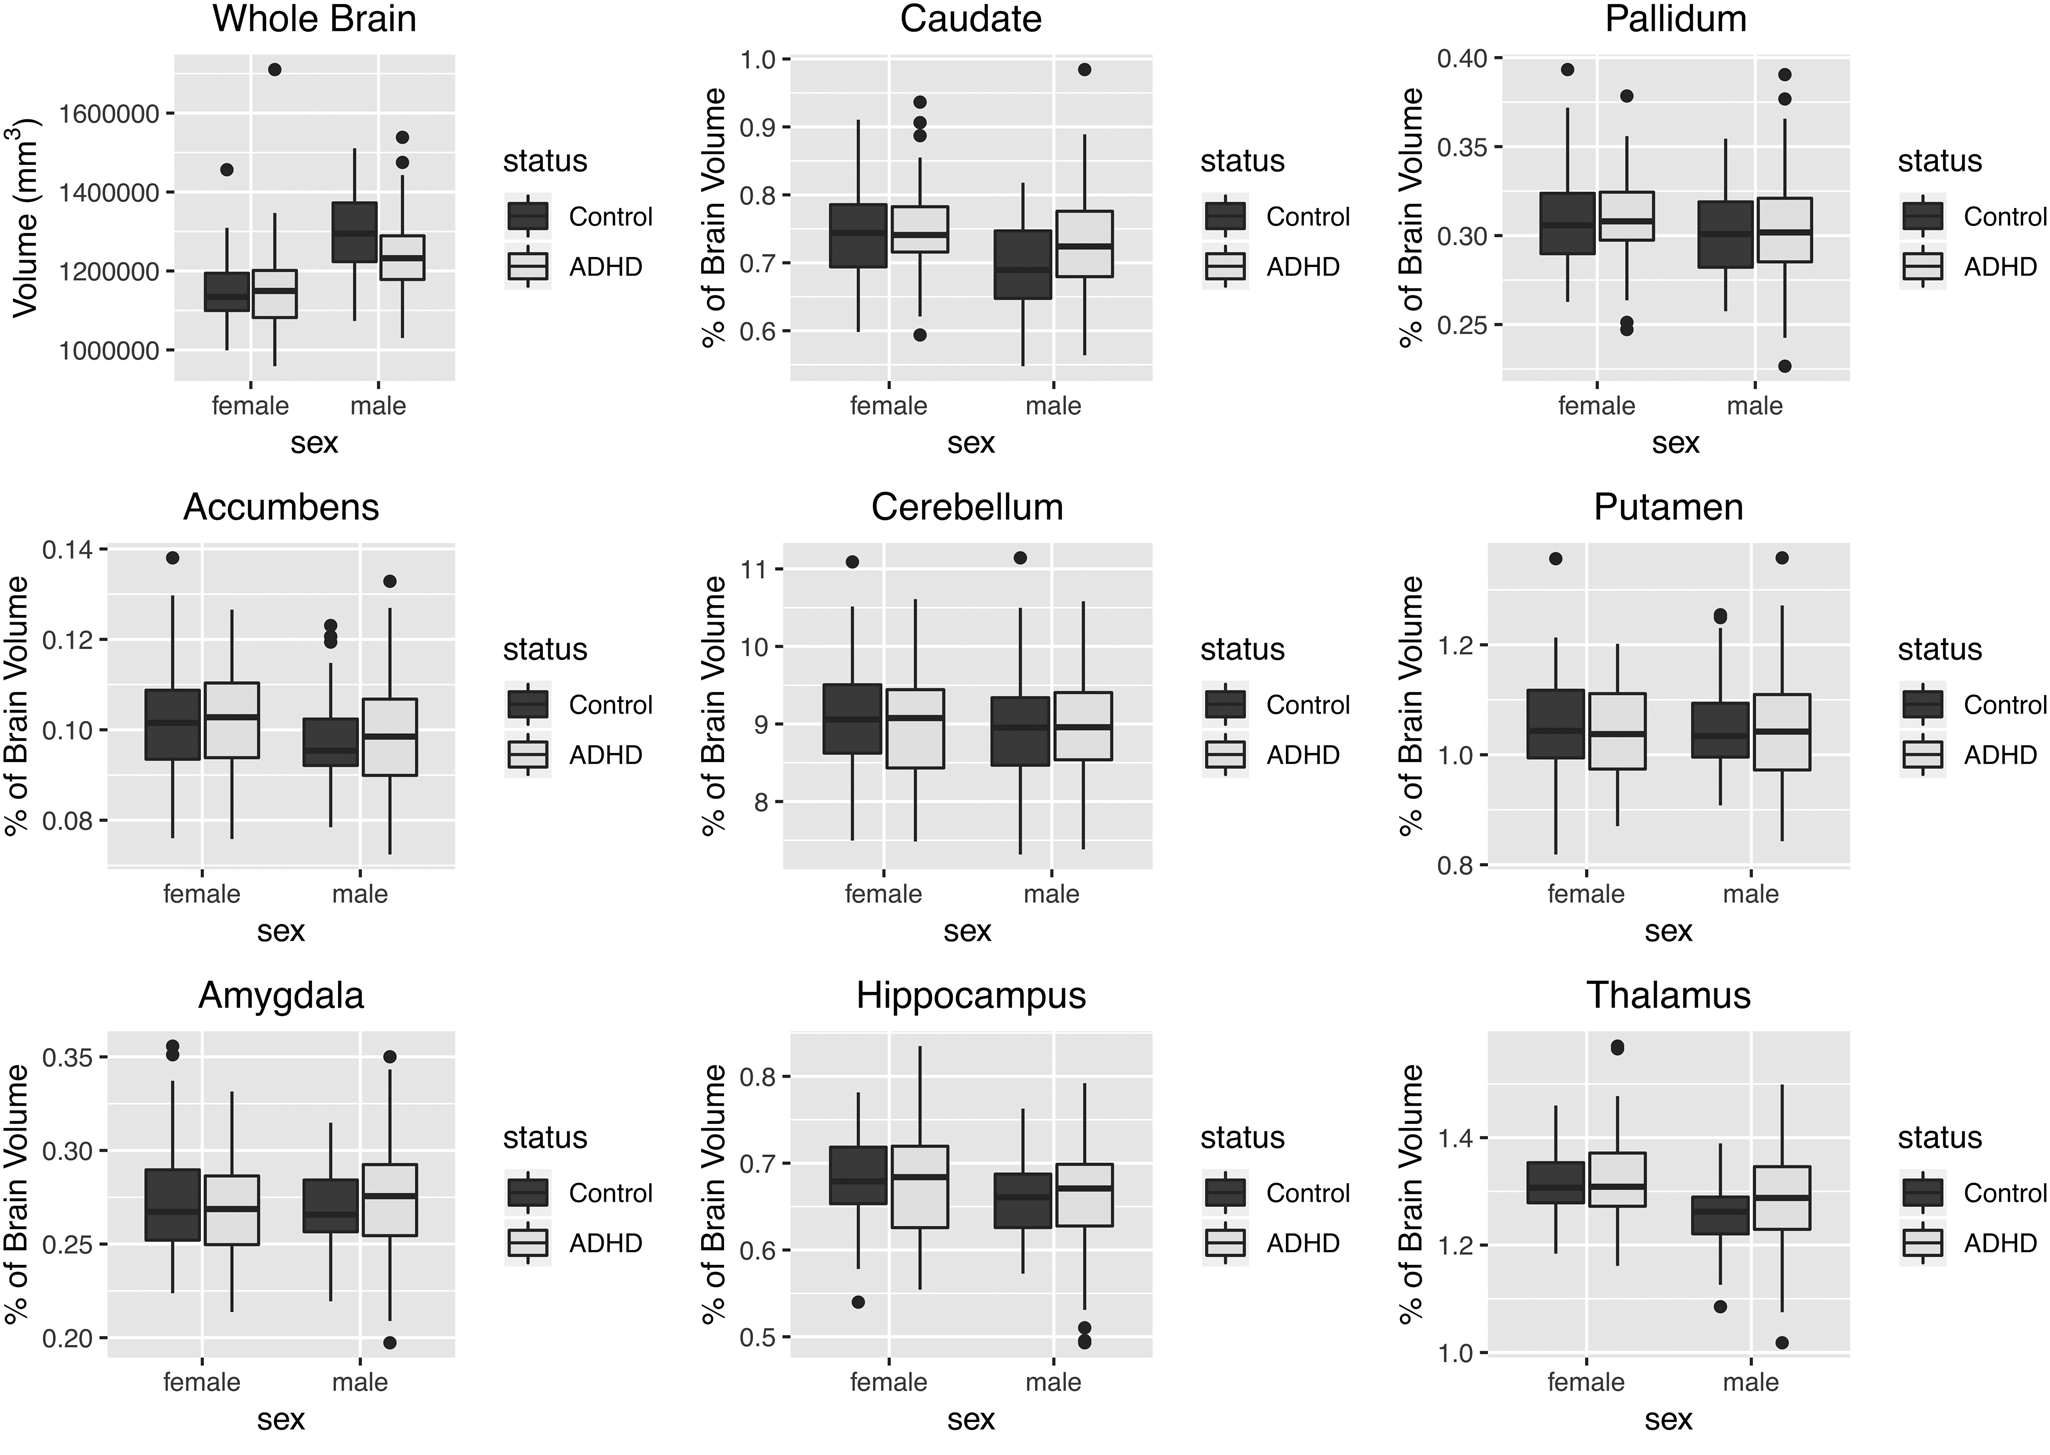
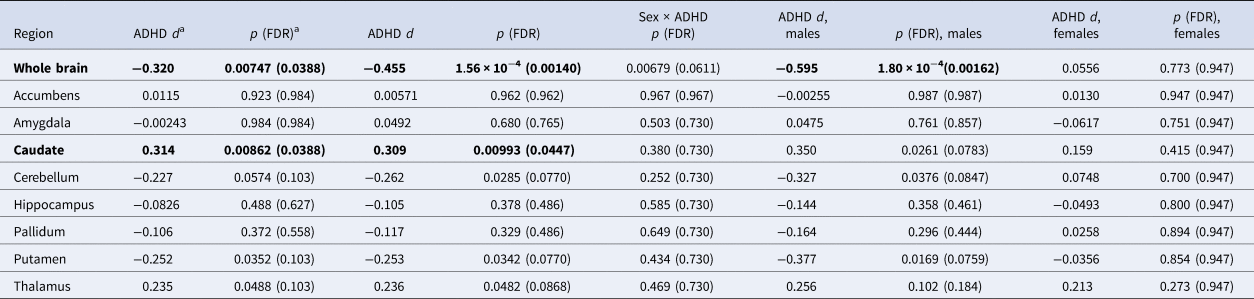
Distributions of whole brain volume and the percentage of TBV for each subcortical region are shown in Fig. 1. The distributions of the raw volumes for all structures are shown in online Supplementary Fig. S2. Whole brain volume was smaller in ADHD cases compared to controls, but only among males (sex-by-diagnosis interaction p = 0.0068, corrected p = 0.062); within males [d = −0.594 (−0.68 to −0.23)]. Table 2 shows the results of analyses testing the association between ADHD and brain volume measures in the entire cohort, as well as the results of sex-stratified analyses.
Whole brain and subcortical volumes (as a percentage of total brain volume) stratified by sex and ADHD status. For each subcortical region, the averages of left and right volumes are reported.

Brain volumes associated with ADHD status

a Effect and p value from the model without the sex interaction term (main effect).
Effects in bold are statistically significant after FDR correction (α = 0.05) for the 9 volumes tested.
Cerebellum and putamen volumes were smaller in ADHD cases compared to controls, after adjusting for TBV [cerebellum d = −0.262 (−0.49 to −0.04); putamen d = −0.253 (−0.48 to −0.03)].
Caudate and thalamus volumes were larger in ADHD cases [caudate d = 0.309 (0.09–0.53); thalamus d = 0.236 (0.01–0.46)].
Although a small literature has examined the association of ADHD medication use with structural brain volumes (Frodl & Skokauskas, Reference Frodl and Skokauskas2012; Nakao et al., Reference Nakao, Radua, Rubia and Mataix-Cols2011), the effect of medication use has not been investigated extensively in genetic-imaging studies of ADHD. Of our final sample of 312 children, 29% (46% of ADHD cases) had a history of ADHD medication use, consistent with previous community sampling rates (Visser, Blumberg, Danielson, Bitsko, & Kogan, Reference Visser, Blumberg, Danielson, Bitsko and Kogan2013); the majority either mixed amphetamine salts or methylphenidate preparations (online Supplementary Table S1). Total brain and thalamus volumes were smaller among ADHD patients with a history of medication use compared to medication-naïve ADHD patients (online Supplementary Table S2). For TBV, this medication effect was similar in males and females. However, for thalamus volume, the medication effect was significant only among boys (sex-by-medication use interaction p = 0.034). For both total brain and thalamus volumes, there was a slight trend toward smaller volume with longer duration of medication use, but these effects were not statistically reliable (online Supplementary Fig. S3).
Patients with a history of medication use are slightly older than medication-naïve patients (mean age = 10.4 v. 9.2 years), but age was included in the regression model and does not explain the medication effects. There was no difference in income between the groups.
Because the decision to treat ADHD patients is correlated with symptom severity, we examined whether the observed association might be due to higher symptom scores in the medicated subjects. [Note: both parent- and teacher-reported ADHD Rating Scale total symptom measures were significantly associated with whole brain volume (p = 2 × 10⁻⁴, β = −0.247 (−0.38 to −0.12), and p = 0.0021, β = −0.196 (−0.32 to −0.07), respectively).] Within ADHD cases, the effect size of medication history on brain volume remains essentially unchanged after accounting for parent-reported total symptom scores on the ADHD Rating Scale in the model, although significance of the TBV association is reduced [d = −0.255 (−0.54 to 0.03) for TBV, and d = −0.339 (−0.62 to −0.06) for thalamus volume]. The sex-by-medication use interaction remained significant for thalamus volume (p = 0.034).
As a second check on the possible effect of symptom severity, we accounted for lifetime comorbid psychiatric disorders in the model. The association between medication use and brain volumes remained significant [d = −0.321 (−0.60 to −0.04) for TBV, and d = −0.368 (−0.65 to −0.09) for thalamus volume], and again the sex-by-medication use interaction remained significant for thalamus volume (p = 0.036).
Finally, the association between TBV and ADHD status remains significant [males d = −0.439 (−0.78 to −0.10), sex-by-diagnosis interaction p = 0.012] when analyzing medication-naïve subjects only, indicating that the case–control differences are not due to medication use.
ADHD polygenic score analysis
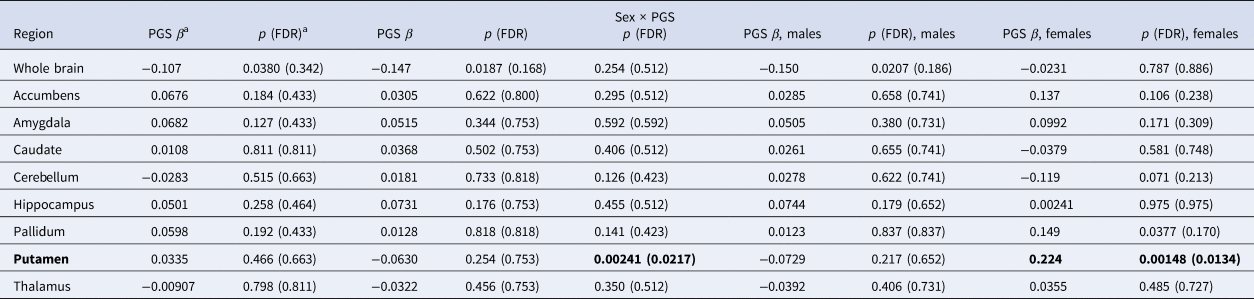
We have previously shown a PGS for ADHD to be significantly associated with ADHD diagnosis in a sample that largely overlaps the cohort studied here (N = 514, Nagelkerke R 2 = 0.045, p = 1.1 × 10⁻⁵) (Nigg et al., Reference Nigg, Gustafsson, Karalunas, Ryabinin, McWeeney, Faraone and Wilmot2018). We tested whether this ADHD PGS was associated with brain volume measures, and whether associations with this PGS were different between the sexes (Table 3). We observed an association of smaller whole brain volumes with higher polygenic risk for ADHD [β = −0.147 (−0.27 to −0.03)]. This association remains significant after accounting for ADHD diagnosis [β = −0.127 (−0.25 to −0.01)], suggesting the association is not simply explained by ADHD cases having higher polygenic scores, and is consistent with a liability threshold model of the disorder.
Brain volumes associated with PGC ADHD polygenic score

a Effect and p value from the model without the sex interaction term (main effect).
Effects in bold are statistically significant after FDR correction (α = 0.05) for the 9 volumes tested.
Whole brain volume statistically mediates a small but reliable proportion of the effect of the ADHD PGS on ADHD diagnosis (average ACME = 0.0087, p = 0.012; proportion of effect mediated = 0.157), when accounting for sex and age. The effect is most robust, however, within boys (average ACME = 0.019, p = 0.008; proportion of effect mediated = 0.42).
None of the subcortical volumes was associated with the ADHD PGS after adjusting for TBV (all p values >0.1), in our full sample. However, we did observe a significant sex-by-PGS interaction for putamen volume (p = 0.00241). Among females only, we observed a significant association of increased putamen volume with increased genetic risk for ADHD [β = 0.224 (0.09–0.36)]. Given that putamen volume was not associated with ADHD diagnosis in females, this result should be followed-up with a larger sample size.
Brain volume polygenic score analysis
TBV and intracranial volume are highly heritable traits (Blokland et al., Reference Blokland, de Zubicaray, McMahon and Wright2012). Therefore, it is possible that genetic factors unrelated to ADHD contribute to the observed associations between TBV and both ADHD diagnosis and the ADHD PGS. To test this hypothesis, we constructed a polygenic score for intracranial volume (ICV PGS) using results from the ENIGMA + CHARGE GWAS of brain volume in primarily healthy subjects (Adams et al., Reference Adams, Hibar, Chouraki, Stein, Nyquist, Rentería and Rundek2016).
As expected, TBV was significantly associated with the ICV PGS (p = 2.65 × 10⁻⁶; online Supplementary Table S5). However, the ADHD PGS and the ICV PGS were not significantly correlated (p = 0.958), suggesting that common genetic variants that influence brain volume differences in the general population are at least partially distinct from those that influence ADHD-related volume differences. Furthermore, after adjusting for the ICV PGS, both the association between TBV and ADHD diagnosis [males d = −0.613 (−0.90 to −0.33); sex-by-diagnosis interaction p = 0.00266] and the association between TBV and ADHD PGS [β = −0.148 (−0.27 to −0.03)] remain significant.
Polygenic scores for putamen (p = 0.00524) and thalamus (p = 0.0018) were also significantly associated with their corresponding volumes in our cohort. Results of the polygenic analyses for all subcortical volumes are reported in the online Supplementary Materials.
Discussion
Our results provide some of the first evidence related to common genetic risk and subcortical and TBV in ADHD. Overall, findings provide little support for the hypothesis that genetic effects drive subcortical volume effects in ADHD. On the other hand, more support was observed for genetic risk playing a role in overall brain development (represented by TBV) in ADHD pathophysiology. In the current sample, however, this effect was essentially confined to boys.
The genetic factors that contribute to ADHD susceptibility, and how those factors contribute to the pathophysiology of ADHD, are only beginning to be investigated using molecular genetic measures. Examining the relationship between genetic factors and disease endophenotypes, such as brain imaging measures, may help to uncover the mechanisms of genetic risk. We found that the association between ADHD polygenic risk and ADHD diagnosis may be due, in small part, to the effects of genetic variants on whole brain size. That said, the fact that the polygenic risk for ADHD explains only a small part of the variation in TBV, and was not associated with subcortical structure volumes, implies the need for further examination of the role of environmental exposures in ADHD-associated brain findings. Of course, it is also likely that other types of genetic variation, apart from common SNPs, and epigenetic variation influence disease endophenotypes and susceptibility.
Furthermore, the small mediation effect we observed shows that our data are consistent with the genetic risk being mediated through brain development processes, but do not prove a causal relationship between brain volume and ADHD. It is possible that genetic risk factors act through other mechanisms, and that smaller brain volume is a result of the disorder. Nonetheless, results are suggestive and consistent with an etiological model linking genetic risk with global neurodevelopment in ADHD.
We also observed a significant association between brain volume and an intracranial volume PGS derived from a GWAS of primarily healthy subjects. While this polygenic score was reassuringly associated with TBV in our cohort, it was not associated with ADHD. Although interpreting a null p value is hazardous, this finding suggests that common genetic variation that influences normal variation in brain volume is largely distinct from the genetics that influence volume differences related to the disorder. A recent analysis with large sample sizes did find a small but significant genetic correlation between ADHD and ICV, using the LD-score regression technique (Klein et al., Reference Klein, Walters, Demontis, Stein, Hibar, Adams and Franke2019). It is possible that we were simply underpowered to detect these shared polygenic effects in our cohort. Nevertheless, genetic factors associated with ICV did not explain the association between brain volume and the ADHD PGS in our dataset.
Sex-specific effects have not been much investigated in genetic-imaging studies of ADHD, and when studied, the results have been inconsistent. Some studies have shown fewer ADHD-associated volume differences among females (Qiu et al., Reference Qiu, Crocetti, Adler, Mahone, Denckla, Miller and Mostofsky2009), while others have shown no gender differences (Castellanos et al., Reference Castellanos, Lee, Sharp, Jeffries, Greenstein, Clasen and Rapoport2002; Hoogman et al., Reference Hoogman, Bralten, Hibar, Mennes, Zwiers, Schweren and Franke2017). The recent large ENIGMA consortium meta-analysis reported no differential sex effects for any of the brain volumes studied (Hoogman et al., Reference Hoogman, Bralten, Hibar, Mennes, Zwiers, Schweren and Franke2017), although it should be noted that the two male-only samples included in that meta-analysis showed the qualitatively largest ADHD-related differences in intracranial volume.
We observed a reliable sex-by-diagnosis interaction for TBV, with a much larger effect size in boys than in girls. While sex-by-diagnosis interactions for subcortical regions were not significant after controlling for TBV, it was potentially interesting that in stratified analyses, effects were qualitatively larger in boys, suggesting larger samples might detect such effects.
Overall, our results with a relatively large, homogenous group of girls and boys suggest that volumetric differences between ADHD cases and controls, as well as those associated with polygenic risk for ADHD, occur more clearly among males.
These sex-specific effects may provide a clue to the differential incidence, trajectories, and clinical presentations seen for male and female ADHD patients (Martel, Reference Martel2013), considering what is known about differences in brain development between the sexes (Király et al., Reference Király, Szabó, Tóth, Csete, Faragó, Kocsis and Kincses2016). Common genetic risk for ADHD may interact with other biological systems differentially in boys and girls, leading to ADHD by partially different pathophysiologies.
We observed a significant association between history of ADHD medication use and smaller whole brain volume. This appears to be conceptually explainable by the fact that medication use is associated with worse ADHD severity. However, correcting for ADHD symptom count did not eliminate the effect, suggesting that medication history may be a marker for some unaccounted-for aspect of disorder severity in our cohort. This finding contrasts with previous studies that have shown either no association of subcortical brain volumes with history of medication treatment (Hoogman et al., Reference Hoogman, Bralten, Hibar, Mennes, Zwiers, Schweren and Franke2017) or have shown that higher percentages of medicated subjects are associated with fewer differences between ADHD cases and controls (Frodl & Skokauskas, Reference Frodl and Skokauskas2012; Nakao et al., Reference Nakao, Radua, Rubia and Mataix-Cols2011). It should be noted, however, that these previous studies included patients with a much larger age range than ours. Castellanos et al. found that both medicated and unmedicated ADHD patients had reduced total cerebral volume compared to controls. Medicated patients showed a smaller difference in volume than unmedicated patients, but the difference between the two patient groups was not significant (Castellanos et al., Reference Castellanos, Lee, Sharp, Jeffries, Greenstein, Clasen and Rapoport2002). Importantly, however, the medication effect seen in our cohort did not account for our genetic findings on brain volume.
Consistent with previous findings (Hoogman et al., Reference Hoogman, Bralten, Hibar, Mennes, Zwiers, Schweren and Franke2017; Norman et al., Reference Norman, Carlisi, Lukito, Hart, Mataix-Cols, Radua and Rubia2016; Wyciszkiewicz et al., Reference Wyciszkiewicz, Pawlak and Krawiec2017), cerebellum and putamen volumes were smaller in ADHD patients, although the difference in cerebellum volume for ADHD patients seen here is smaller than that observed previously (Wyciszkiewicz et al., Reference Wyciszkiewicz, Pawlak and Krawiec2017). The effect size for putamen seen here (d = −0.252 for the full sample) was within the range seen among children in the recent ENIGMA study (95% CI −0.28 to −0.09) (Hoogman et al., Reference Hoogman, Bralten, Hibar, Mennes, Zwiers, Schweren and Franke2017).
In contrast with previous studies (Hoogman et al., Reference Hoogman, Bralten, Hibar, Mennes, Zwiers, Schweren and Franke2017; Wang et al., Reference Wang, Xu, Li, Li, Zuo, Liao and Joshi2018), however, we observed larger caudate and thalamus volumes in ADHD compared to controls. While this is puzzling, prior studies have shown heterogeneity in effect directions for ADHD and subcortical structures across populations with different etiologies (Stojanovski et al., Reference Stojanovski, Felsky, Viviano, Shahab, Bangali, Burton and Ameis2019), and it may be that our sample of cases differed in unknown ways from others. Nonetheless, these results should be interpreted with caution, and follow-up studies will be needed to clarify the direction and size of these effects or moderators of this effect.
The current study was larger than almost all prior single-sample, single-site studies of ADHD subcortical brain volumes. Thus, it was well-powered (80%) to detect moderate differences between ADHD cases and controls (Cohen's d > 0.38). Although a previous large meta-analysis found effects larger than this (e.g. d = 0.485 for total cerebral volume) (Valera et al., Reference Valera, Faraone, Murray and Seidman2007), other studies have suggested smaller effect sizes are likely (Hoogman et al., Reference Hoogman, Bralten, Hibar, Mennes, Zwiers, Schweren and Franke2017). In addition to its respectable sample size, several advantages of the current dataset add to the importance of the results and distinguish it from multi-site meta-analyses. First, the cohort analyzed (N = 312) is well-characterized and genetically homogeneous (Nigg et al., Reference Nigg, Gustafsson, Karalunas, Ryabinin, McWeeney, Faraone and Wilmot2018). Second, all imaging data were acquired and processed with consistent methods, and a validated technique to correct for motion during MRI acquisition was used. We believe our results provide an important additional resource for consideration in relation to meta-datasets, particularly in light of the uncertainty known to exist when combining genetically heterogeneous datasets (Ni, Moser, Wray, & Lee, Reference Ni, Moser, Wray and Lee2018).
Even so, several limitations to this study should be noted. First, our sample includes nearly twice as many males as females. This imbalance complicates our interpretation of sex effects, given that statistical power was reduced in our female-only analyses. However, this imbalance cannot account for the significant sex-by-diagnosis interaction for TBV or for the qualitatively larger effect sizes in boys. For subcortical structures, the large differences in effect estimates between sexes call for further studies. Second, given the non-randomized design, and the relatively small number of subjects with medication history, our study is not optimal for testing medication effects. Nonetheless, thorough testing of possible confounding with demographic variables, symptom severity, and comorbidities lends confidence to our findings. As already stated, causality cannot be assumed for any of the correlations noted.
Heterogeneity among patient samples is an ongoing challenge in ADHD research, particularly when studying the small effect sizes seen in imaging and genetic studies. The current study provides important insights into ways of reducing the impact of sample heterogeneity, as well as breaking new ground regarding genetic risk and ADHD brain development. First, we have shown that common genetic variants, associated both with ADHD and brain volume in the general population, are associated with TBV in an ADHD patient cohort. Accounting for genetic factors may help explain differences between studies and provide more accurate estimates of non-genetic effects. Second, our analyses include proper control of motion during MRI acquisition. Correction for motion bias has typically been lacking in ADHD imaging studies and may contribute to inconsistencies across studies.
Overall, our findings provide key insights into the mechanistic endophenotypes of ADHD. Importantly, we show an association between common genetic risk for ADHD and TBV, as well as significant differences between boys and girls when examining ADHD-associated brain volume differences. We believe these findings will help move the field toward a better understanding of brain development and genetic risk related to ADHD.
Supplementary material
The supplementary material for this article can be found at https://doi.org/10.1017/S0033291719004148
Acknowledgements
We thank Elizabeth Nousen and Jessica Tipsord for data processing and project management support.
Financial support
This work was supported by funding from the National Institutes of Mental Health (J.N., R01MH099064 and R01MH086654; D.F. and J.N., R01MH115357; D.F., R01MH096773).
Conflict of interest
Dr Nikolas has received research grants for non-pharmacological research from Shire (USA-000594). Dr Fair is non-shareholding Vice President and Chief Scientific Officer (CSO) of Nous Imaging Inc, and co-inventor of Framewise Integrated Real Time Motion Monitoring. Dr Nigg receives royalties from Guilford Press for two books, What Causes ADHD (2006) and Getting Ahead of ADHD (2017). In the past year, Dr Faraone received income, potential income, travel expenses continuing education support and/or research support from Lundbeck, Rhodes, Arbor, KenPharm, Ironshore, Shire, Akili Interactive Labs, CogCubed, Alcobra, VAYA, Sunovion, Genomind, and Neurolifesciences. With his institution, Dr Faraone has US patent US20130217707 A1 for the use of sodium-hydrogen exchange inhibitors in the treatment of ADHD. In previous years, Dr Faraone received support from: Shire, Neurovance, Alcobra, Otsuka, McNeil, Janssen, Novartis, Pfizer, and Eli Lilly. Dr Faraone receives royalties from books published by Guilford Press: Straight Talk about Your Child's Mental Health, Oxford University Press: Schizophrenia: The Facts, and Elsevier: ADHD: Non-Pharmacologic Interventions. Dr Faraone is the principal investigator of www.adhdinadults.com. Dr Faraone is supported by the K.G. Jebsen Centre for Research on Neuropsychiatric Disorders, University of Bergen, Bergen, Norway; the European Union's Seventh Framework Programme for research, technological development, and demonstration under grant agreement no 602805; the European Union's Horizon 2020 research and innovation program under grant agreement No 667302; and National Institute of Mental Health grants 5R01MH101519 and U01 MH109536-01. All other authors report no competing interests.
Ethical standards
The authors assert that all procedures contributing to this work comply with the ethical standards of the relevant national and institutional committees on human experimentation and with the Helsinki Declaration of 1975, as revised in 2008.