


INTRODUCTION
Plague (Yersinia pestis infection) is a rodent-associated, flea-borne zoonosis that persists throughout Asia, Africa and North and South America as a threat to public health [Reference Tikhomirov, Dennis, Gage, Gratz, Poland and Tikhomirov1]. In much of Central Asia, natural plague foci have been monitored as part of control programmes established in the late 1940s by the Chinese and former Soviet Union governments, where surveillance of plague in wild rodent populations led to flea control when the bacteria were isolated from samples of rodents or fleas captured close to human habitation. In sparsely inhabited areas the natural dynamics of plague were recorded and for one such focus – the pre-Balkhash plague focus in south-eastern Kazakhstan – the plague archives have been computerized, consolidated into bi-annual time-series and analysed [Reference Davis2, Reference Frigessi3]. To supplement these large but coarse-resolution datasets, monthly capture–mark–recapture (CMR) field work was initiated in the same focus at two sites where plague was present in wild rodents [Reference Begon4]. The analyses presented here are based only on the fine-resolution data.
In the pre-Balkhash focus the main reservoir host is the great gerbil, Rhombomys opimus, as it is throughout large tracts of Central Asia [Reference Pollitzer5, Reference Gratz6]. This is an ‘enzootic’ or ‘maintenance’ host [Reference Gage and Kosoy7] in that plague infection is frequently reported in this species, often at high prevalence (especially serologically), but diebacks (mass mortalities) of hosts are not observed. The vectors of plague in this system are mostly fleas in the genus Xenopsylla [Reference Kunitskiy and Gauztein8]. Great gerbils live in family groups – typically a single dominant male, one or a few females and their immature offspring – that inhabit and defend discrete, permanent burrow systems [Reference Naumov, Lobachev, Prakash and Ghosh9]. The size of a family group depends on the season but is typically around 10 individuals. The number, position, and size of the burrow systems generally do not change over time, but the proportion of burrow systems occupied by family groups (occupancy) may fluctuate dramatically [Reference Davis2].
The burrow systems of the great gerbil dominate the landscape in the sense that the vegetation is stripped from a roughly circular area surrounding the burrow entrances, even if the system has been abandoned for some time. Even though burrow systems are maintained and defended by a family group, it is not uncommon for adult gerbils to visit neighbouring, occupied systems up to 400 m away [Reference Rothschild10]. More permanent dispersal movements are also observed with male gerbils sometimes travelling long distances (up to 5 km) to form new family groups just before autumn (when food is collected and cached for winter) [Reference Rothschild10, Reference Randall and Rogovin11]. It may, therefore, be possible to view populations of great gerbils as metapopulations, consisting of well-defined subpopulations linked by movements of animals, using the following criteria: individual subpopulations (here, burrow systems) have a non-negligible probability of going extinct and being recolonized by dispersal; the extinction-colonization dynamics of subpopulations may thus be more important than dynamics occurring within subpopulations; and the dynamics of different subpopulations are independent in the sense of being non-synchronous.
Mathematical models for the spread of infectious disease in metapopulations tend to classify subpopulations into a single disease state (wholly infectious, recovered or susceptible, for example) with the justification that the rates of transmission and recovery within a subpopulation are much faster than the rate of movement between subpopulations [Reference Hess12–Reference McCallum and Dobson15] (although for exceptions see [Reference Keeling and Gilligan16, Reference Xia, Bjornstad and Grenfell17]). This effectively allows the modeller to take the useful, simplifying step of treating the subpopulation as the unit of study. CMR data allow us to examine directly the validity of this simplification for plague in great gerbil populations while also providing a rare opportunity to study the dynamics and natural history of sylvatic plague at the subpopulation level and in a maintenance host. The impact and spread of plague at this population scale are not yet well understood for either plague in Central Asia where the bacteria is thought to have evolved, nor in North America where it is a relatively recent wildlife disease [Reference Stapp, Antolin and Ball18, Reference Biggins and Kosoy19].
Hence, following the analysis by Begon et al. [Reference Begon4] at the individual level, we analyse the same data but at the burrow-system level of the main host to address three questions.
(1) Does rapid transmission of plague within a burrow system occur once plague enters a burrow system, such that whole burrow systems can be characterized meaningfully as susceptible, infectious or recovered?
(2) Given recent evidence of a negative impact of plague on individual survival [Reference Begon4], is there a measurable impact of plague on the chances of burrow-system extinction?
(3) Does the spatial arrangement of infected burrow systems suggest a pattern of transmission in which the risk of new infection in a burrow system is greatest in those closest to burrow systems containing infectious individuals?
METHODS
The two sites – Kizil-Dzar (‘Site 1’ – 500 m×600 m) and Shagildi (‘Site 2’ – 500 m×500 m) – were located, ∼40 km apart, in the area to the south-east of Lake Balkhash, eastern Kazakhstan, a desert area with sandy soil and a sparse vegetation dominated by black saxaul (Haloxylon aphyllum), white saxaul (Haloxylon persicum), and by a number of grasses (especially Anabasis ramosissima and Ceratocarpus turkestanicus) and sandy sedge (Carex physodes). All gerbil burrow systems at the sites were mapped, although not all are necessarily occupied at any one time. There were 76 burrow systems on site 1 and 87 on site 2. The populations at the two sites were sampled every month from January 2002 until July 2004, except when there were problems of access, mostly due to inclement weather, especially during winter 2003–2004. There were 25 sample occasions in all from each population. Unbaited wooden live traps were placed at entrances to occupied burrows (showing signs of recently disturbed sand) and checked twice daily over a 3- to 4-day period. Traps were not left in position over night. Gerbil abundance, as estimated by the proportion of burrow systems occupied [Reference Davis2], rose to a peak each mid-summer, was somewhat higher and more constant from year to year at site 1 compared to site 2, and was lowest at site 2 in 2003. Individuals on capture were sexed, weighed, and classified as juvenile, subadult or adult on the basis of size, weight and coat coloration. The fleas on them were collected with fine forceps, a blood sample was taken from the tip of the tail, and, if captured for the first time, gerbils were injected subcutaneously with a microchip transponder so that their unique identity (a nine-figure code) could be determined on recapture. Blood samples were analysed for active Y. pestis by culturing on Hottinger's agar with 1% haemolysed sheep red blood cells, colonies being confirmed as Y. pestis by colony morphology, sensitivity to diagnostic plague bacteriophage and to presence of the F1 capsular antigen. They were also tested serologically (for antibodies against the F1 antigen) by undirected haemagglutination (HA) and confirmed by inhibition of HA with F1 antigen (HI) [Reference MacIntyre, Knight, Fooks, Carniel and Hinnebusch20].
For each capture and recapture, individual great gerbils were categorized as susceptible (S), infectious (I) or recovered (R). Animals testing seronegative were categorized as susceptible, but a seropositive test result cannot distinguish between a present infection and a past infection from which the animal has since recovered. All juveniles and subadults that tested seropositive were categorized as infectious since it was unlikely for such young animals to have had the time to obtain the infection and then recover from it. Adults that were observed to have recently seroconverted (i.e. tested seronegative at a previous trapping occasion), or that had HI/HA ratios that were >4, were also classified as infectious. The remaining animals testing seropositive were classified as recovered.
A burrow system is referred to as infectious if one or more great gerbils trapped from it were classified as infectious. This term is also used for a burrow system from which an infectious gerbil was captured in the previous session. A burrow system is referred to as seropositive if one or more infectious or recovered animals were captured from it, and referred to as susceptible if only seronegative gerbils were captured. The two sites were analysed separately.
To test whether spread of plague within a burrow system occurred at a faster rate than within the population as a whole, the distribution of susceptible, infectious and recovered animals from burrow systems from which one or more infectious gerbils had been captured the previous visit was compared (Pearson's χ2 test) with that of the remaining burrow systems.
This was followed by a direct test of whether all individuals in a burrow system tended to be susceptible, infectious or recovered simultaneously. Data were first pooled by year and season (where the months of March–May were defined as spring, June–August as summer, September–November as autumn and December–February as winter) and the within-burrow-system distributions of susceptible, infectious and recovered individuals were computed. Those that were formed from less than three gerbils were discarded. The remaining distributions were then plotted on an equilateral triangle in the manner of a de Finetti diagram [Reference Ineichen and Batschelet21]:

The vertices of the triangle represent burrow systems that are wholly susceptible, infectious or recovered, sides represent two-class combinations located according to the contributions of those two classes, and so on. The whole-population distribution of susceptible, infectious and recovered individuals was also plotted on the diagram. The question at issue was whether the observed variance around the whole-population value was greater than expected by chance; that is, whether the burrow systems tended to be distributed around the edge of the diagram, where burrow systems either contain gerbils all in the same class (the vertices), or are in transition from wholly susceptible to wholly infectious, or from infectious to recovered (two of the sides), and so on. Hence, the observed variance was compared to the variances of 999 simulations, in which the frequency-distribution of burrow-system sizes was retained but gerbils were allocated a disease status by random sampling from a multinomial distribution with probabilities set to the observed population frequencies.
The tendency for animals from the same burrow system to have the same disease status is illustrated here by plotting the observed distributions of susceptible, recovered and infectious animals captured from the same burrow system on a de Finetti diagram [(b) and (e)]. The size of each point on the triangle represents the number of burrow systems having that particular distribution. Burrow systems with distributions lying on the vertices of the triangle represent those that are wholly susceptible, infectious or recovered. The mean distribution of susceptible, infectious and recovered animals for the population as a whole is denoted by an asterisk (*). At site 1 a total of 472 gerbils were sampled from 99 burrow systems and at site 2 it was 186 from 45. Simulation (where the sampling was mimicked but the population average used to generate the numbers of susceptible, infectious and recovered gerbils in each burrow system) was used to obtain frequency distributions [(a) and (d)] for the variance in the within-burrow-system distributions. This variance is that expected from the demographic stochasticity associated with the low numbers of gerbils trapped from each burrow system. The histograms are based on 999 simulations. One set of simulated distributions for each site are shown on a second pair of de Finetti diagrams [(c) and (f)].

The impact of plague on the probability that a burrow-system subpopulation would go extinct was examined simply by comparing (Pearson's χ2 test) the numbers of susceptible, infectious and recovered animals from burrow systems that had been abandoned on the next occasion they were trapped with those from burrow systems that remained occupied.
Whether the spatial arrangement of infected burrow systems suggested a pattern of localized spread, wherein the risk of new infection in a burrow system was related to the proximity of burrow systems known to contain infectious animals, was considered by constructing a nearest-neighbour distance cumulative distribution curve for the seropositive burrow systems. Upper and lower simulation envelopes were generated from 99 simulations of CSR (complete spatial randomness, see [Reference Diggle22]) where points were restricted to be a random subset of the occupied burrow systems. Significant departure from CSR occurs when the observed cumulative distribution curve falls outside either of the simulation envelopes (where rising above the upper envelope indicates spatial clumping). Data from visits to the same site in the same season were pooled, generating seven tests at site 1 but only six at site 2 since no seropositive animals were found there in the final season of the study.
This approach was complemented by a separate analysis of the distances between burrow systems known to contain infectious animals at trapping occasion t and newly infected burrow systems discovered on trapping occasion t+1. The set of distances was compared with those between all burrow systems trapped on occasion t and all those trapped on occasion t+1. A Kolmogorov–Smirnov test accompanied by a visual inspection of the cumulative distribution curves was used to establish whether there were was a difference between the two distributions. If plague is transmitted disproportionately to nearby burrow systems, a higher risk of plague entering the burrow system between occasion t and occasion t+1 would be expected for those burrow systems in close proximity to burrow systems found to be infectious on occasion t.
RESULTS
Measures of abundance and productivity
The overall density of burrow systems (i.e. empty or occupied) was higher on site 2 than site 1 (3·92 vs. 2·77 per ha.) but all other measures of gerbil abundance and productivity were higher on site 1 than site 2. The mean occupancies over the study period were 0·67 and 0·33, respectively, and the densities of occupied burrow systems were 1·82 and 1·29 per ha. The number of captures per burrow-system per session was higher (1·75 vs. 1·64) as was a crude measure of fecundity [the ratio of juveniles in the trapped population to ‘breeding’ (April–June) adults; 2·52 vs. 1·31]. Finally, empty burrow systems tended to be colonized more rapidly in square 1 than in square 2 [the mean number of occasions a burrow system was observed to be empty, counting all empty periods within the study period, was 5·6 (n=124) for square 1 and 9·8 (n=179) for square 2].
Within-burrow-system transmission
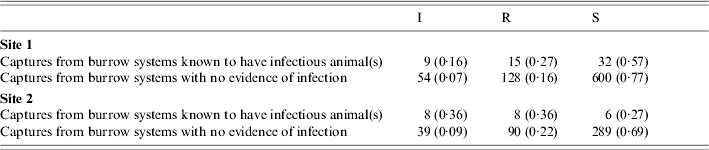
At both sites, the distributions of infectious, recovered and susceptible animals in previously infected and not-infected burrow systems (Table 1) were clearly different. Animals classified as infectious (or indeed simply seropositive) were more likely to be captured from burrow systems from which an infectious gerbil had been captured the previous session (at site 2 this was 0·36 vs. 0·09, see Table 1). However, the data also show many examples of infected burrow systems from which susceptible individuals (young and old) continued to be caught. This was more obvious for site 1, where 32 of the 56 animals captured from previously infected burrow systems tested seronegative.
Counts of infectious (I), recovered (R) and susceptible (S) gerbils (with proportions in parentheses), where captures were divided into those from a burrow system known to contain one or more infectious gerbils the previous trapping session (relatively rare) and those from burrow systems where there was no evidence of recent infection (Pearson's χ2 test: P=0·0027 and 1·8×10−5 for sites 1 and 2 respectively)
The distributions of susceptible, recovered and infectious individuals in burrow systems from which more than three gerbils were captured are shown as de Finetti diagrams in Figure 1 and are accompanied by a simulated set of distributions, also plotted as de Finetti diagrams, and by histograms of the simulated values of the variance together with the observed variance. For site 1, the observed variance was higher than the variance for all 999 simulations of the sampling process (implying a P value of <0·001). For site 2, the observed variance was higher than the variance for 952 of the 999 simulations (implying a P value of 0·048). At both sites there was a clear tendency for burrow systems to be closer to the edge of the de Finetti diagram than would be expected by chance.
Burrow-system survival
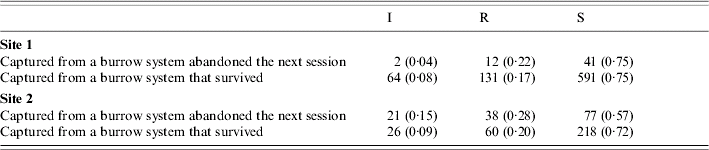
For site 1 there were 37 ‘burrow-system extinctions’ over the study period, and there was no difference in the distribution of infectious, recovered and susceptible animals between these and burrow systems that remained occupied (Table 2: χ2=2·14, P=0·34). At site 2, extinctions were more common (84 in total), and at this site the presence of plague was seen to have an impact on burrow-system survival – great gerbils trapped from burrow systems that subsequently went extinct were much more likely to be infectious (and indeed seropositive) than those from burrow systems that persisted (χ2=10·21, P=0·006).
Counts of infectious (I), recovered (R) and susceptible (S) gerbils (with proportions in parentheses) captured from burrow systems that subsequently went extinct and burrow systems that persisted
Spatial patterns in burrow-system locations
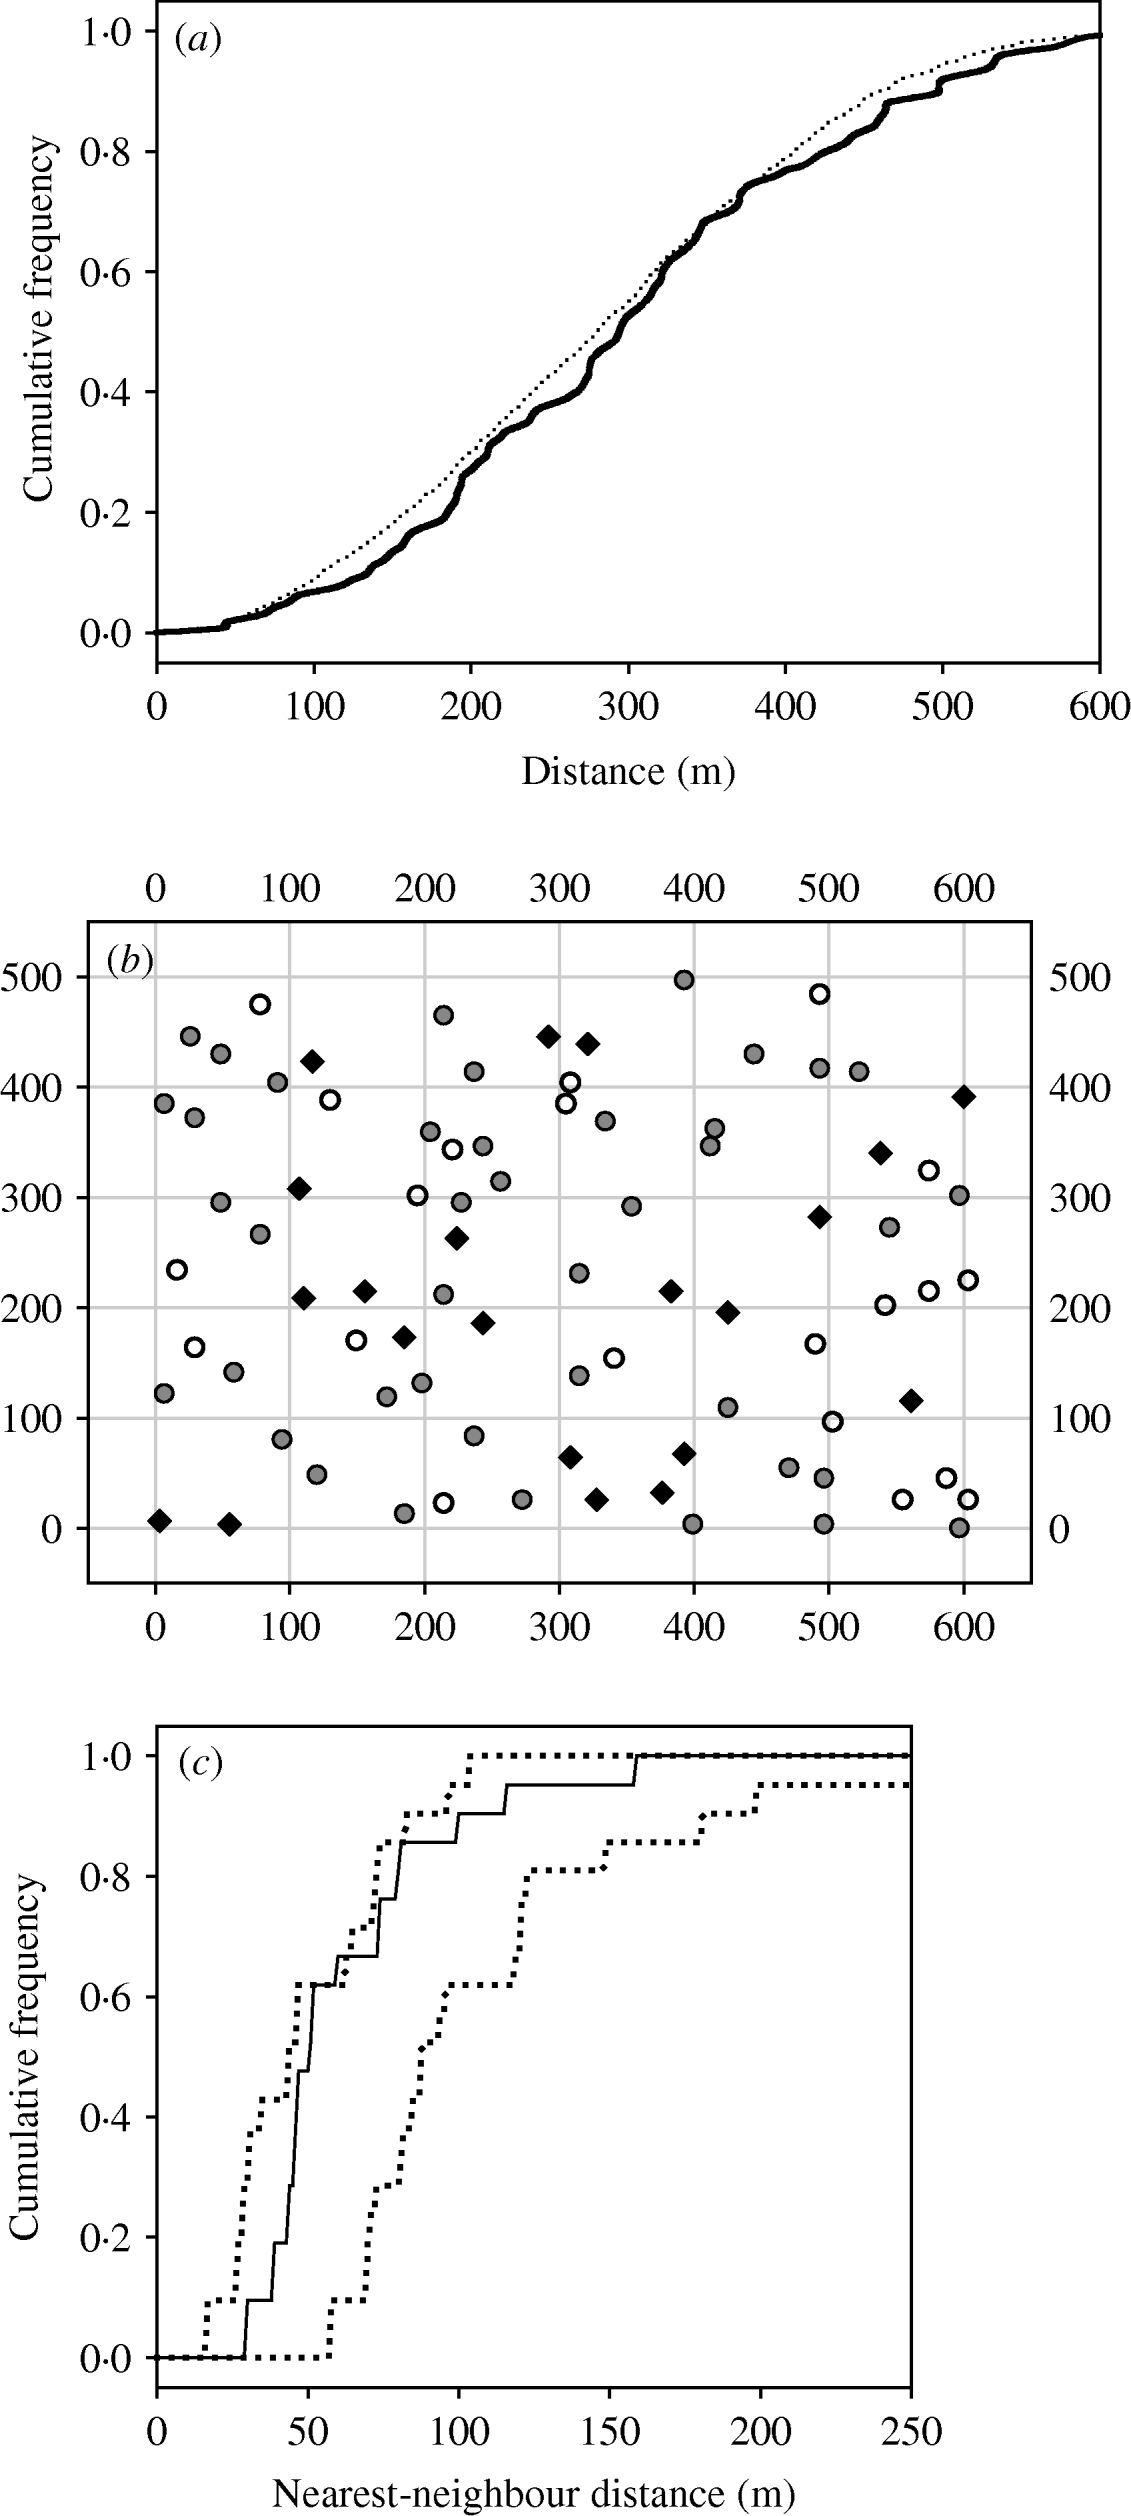
When data are pooled by year and season, the spatial maps of seropositive burrow systems provide no consistent or strong evidence that seropositive burrow systems are clustered together. For two of the 13 maps, the nearest-neighbour cumulative distribution curve escaped the upper simulation envelope (thus providing some evidence for clumping), but only briefly and only once for each site (at site 1 in winter 2002–2003, see Fig. 2 a, and at site 2 in summer 2002). Also, the appearance of newly infected burrow systems could not be related to the proximity of burrow systems found to be infectious the previous month (Fig. 2 a). There was no difference between the distribution of distances between burrow systems that were infectious in session t and those that were newly infectious in session t+1 and the distribution of distances between burrow systems trapped in session t and those trapped in session t+1 (Kolmogorov–Smirnov test, P=0·50 and 0·84 for squares 1 and 2 respectively).
(a) Cumulative frequency distributions for (i) the distances between newly infectious burrow systems and burrow systems known to contain infectious gerbils the previous month (—), and (ii) the distances between occupied burrow systems and burrow systems known to be occupied the previous month (········). (b) An example of the spatial arrangement of empty (○), susceptible ( ) and seropositive (◆) burrow systems at site 1 where data from the winter months of 2002 and 2003 were pooled to classify each burrow system. (c) The cumulative nearest-neighbour distribution function for the set of seropositive burrow systems shown in (b), together with upper and lower envelopes from 99 simulations of complete spatial randomness (points were restricted to be a random subset of the set of occupied burrow systems).
DISCUSSION
Several theoretical studies have pursued the idea of describing host–pathogen dynamics in terms of metapopulations in which either individual hosts [Reference Lawton, Edwards, May and Webb23, Reference Grenfell and Harwood24] or subpopulations of hosts [Reference Hess12, Reference Hess13, Reference Keeling and Gilligan16] are considered as patches to be colonized by a pathogen. In the latter case, some authors [Reference Hess12–Reference McCallum and Dobson15] have argued that the dynamics of the disease within a subpopulation are much faster than the processes of movement and transmission between subpopulations, and hence the subpopulation may be treated as having a single disease state. Evidence for the validity or utility of this perspective for natural populations has been rare. Broadly, support for the approach requires that an epidemiological classification into susceptible (S), infected/infectious (I), immune/recovered (R) and pathogen-deceased (D) classes can be undertaken at the subpopulation level at least as usefully as at the more conventional level of the individual host. Here, we have suggested that burrow systems supporting family groups of great gerbils might be considered subpopulations in a plague–host metapopulation. We have sought support for this through evidence that plague affects the survival of whole burrow systems (such that burrow systems move from the I to the D class, as occurs in prairie-dog towns [Reference Stapp, Antolin and Ball18]), and that burrow systems themselves are disproportionately wholly or near-wholly S, I or R, or are in transition from S to I, I to R or R to S – that is, the dynamics of processes occurring within burrow systems are rapid (and might for some purposes be ignored) relative to the dynamics of processes occurring between burrows. We have also investigated the most important between-burrow-system epidemiological process, transmission, with the aim of determining whether it is localized at a scale detectable at our study sites.
Plague appeared to spread more easily within burrow systems than between them; the probability that an animal was infectious or recovered was clearly higher if its burrow system was known to harbour infectious animals in the recent past than if there was no evidence of recent infection (see Table 1). Similarly, the distributions of infectious, recovered and susceptible animals showed that animals captured from the same burrow system tended to have the same disease status. It is not unexpected for a species with a social structure like that of the great gerbil that plague (or any other infection) should be clumped at the level of the burrow system rather than being distributed at random across the landscape, but this nonetheless remains a rare example of empirical support for this statement. More support comes from plague in prairie dogs [Reference Stapp, Antolin and Ball18], although plague appears to spread at such a rapid rate within a subpopulation (‘town’) that actually observing the transition from S to I or even I to D is difficult.
At the time of our study, one site was more productive than the other: occupancy rates were higher, the number captured per burrow system was higher, there were relatively few burrow-system extinctions, and fecundity (measured as the ratio of immature gerbils to breeding adults) was higher. Interestingly, on the more productive site where burrow-system-level extinctions were rare, there was no significant effect of plague on burrow-system survival, whereas on the less productive site where there were relatively more extinctions, plague did increase the chance that a subpopulation would go extinct (although, naturally, at both sites, extinctions will have occurred for a variety of reasons). Begon et al. [Reference Begon4], investigating recapture rate (as a proxy for survival) at the individual level, detected a (small) effect of plague infection on survival but found no evidence of an interaction between site and infection status and hence no evidence that virulence of plague differed between the sites. It seems likely, therefore, that either the extinction of subpopulations through infection at site 1 was ‘hidden’ by relatively high birth rates within subpopulations and/or high rates of re-colonization, or that an effect of plague on burrow-system survival is only detectable in low-productivity populations where individuals are in relatively poor condition. Such interactive effects have been described in several other host–parasite systems [Reference Gulland, Grenfell and Dobson25].
Overall, there was a lack of evidence that seropositive or infectious burrow systems were clumped together in the landscape, as would arise from a tendency for transmission to occur between neighbouring burrow systems. This echoes the findings of Stapp et al. [Reference Stapp, Antolin and Ball18] who reported that none of the measures of isolation or distance they used could help explain the extinction of prairie-dog towns caused by plague. Nevertheless, the lack of a spatial pattern is intriguing because plague spreads from gerbil to gerbil via fleas, which must move, or be carried by hosts, across the landscape, rather than being, say, air-borne. The transport and exchange of fleas between burrow systems has been studied in the desert foci of Central Asia [Reference Korneyev26, Reference Rudenchik27] by labelling fleas with radionuclides. With a 1- to 2-week period between marking the fleas and searching the surrounding burrow systems, the majority of fleas remained in the same burrow system or one within a 200 m radius, only a small percentage (<5%) were recaptured from burrow systems at distances greater than 200 m, and there were three cases of distant transportation (1000–1200 m) recorded (which were attributed to small carnivores rather than movement of great gerbils). It may be that this minority of long-distance dispersers is sufficient to preclude an easily recognizable pattern on our scale of observation, especially if infected fleas, or fleas on infected hosts, are disproportionately represented in this minority. Identifying the appropriate scale at which spatial spread of sylvatic plague in Central Asia can be established is an important challenge both methodologically and for its practical consequences.
ACKNOWLEDGMENTS
This work was supported by Wellcome Trust grant 063576/Z/01/Z.
DECLARATION OF INTEREST
None.



