INTRODUCTION
Plasmodium parasites alternate between replicating and invasive forms in their complex life cycle. The invasive forms, namely the ookinete, the sporozoite and the merozoite, are believed to use similar molecular mechanisms to achieve motility and invasion. Although we do not yet have the complete picture of how motility of the malaria parasite is achieved, a model for the motor complex, the so called glideosome, has been described for the related Apicomplexan parasite Toxoplasma gondii (for reviews see Opitz and Soldati, Reference Opitz and Soldati2002; Keeley and Soldati, Reference Keeley and Soldati2004). The glideosome is made up of several proteins. The motor itself is an acto-myosin motor, the myosin being anchored in the inner membrane complex via a complex of 3 proteins. Actin, on the other hand, is linked via the glycolytic enzyme aldolase to the transmembrane micronemal protein MIC2, which interacts with ligands of the substrate. The model predicts that the micronemal protein is secreted after a stimulatory burst of calcium, and this has been experimentally verified using a number of pharmacological agents that increase the intracellular calcium concentration (Carruthers et al. Reference Carruthers, Giddings and Sibley1999a, Reference Carruthers, Moreno and Sibleyb; Carruthers and Sibley, Reference Carruthers and Sibley1999; Vieira and Moreno, Reference Vieira and Moreno2000; Wetzel et al. Reference Wetzel, Chen, Ruiz, Moreno and Sibley2004). Furthermore, the involvement of Ca2+ release through channels with properties of the inositol 1,4,5-triphosphate and ryanodine receptor superfamilies, has been suggested (Lovett et al. Reference Lovett, Marchesini, Moreno and Sibley2002; Wetzel et al. Reference Wetzel, Chen, Ruiz, Moreno and Sibley2004).
We have chosen to study the effect of calcium in the P. berghei ookinete, which is formed in the mosquito midgut after the uptake of an infected bloodmeal. The ookinete displays gliding motility both in vivo and in vitro (Freyvogel, Reference Freyvogel1966; Zieler and Dvorak, Reference Zieler and Dvorak2000; Vlachou et al. Reference Vlachou, Zimmermann, Cantera, Janse, Waters and Kafatos2004; Siden-Kiamos et al. Reference Siden-Kiamos, Ecker, Nyback, Louis, Sinden and Billker2006b). In addition to invading epithelial cells in the mosquito midgut during its normal life cycle, in vitro it can also invade tissue-culture cells and develop into oocysts (Siden-Kiamos et al. Reference Siden-Kiamos, Vlachou, Margos, Beetsma, Waters, Sinden and Louis2000).
An interesting observation is that in vitro-cultured, purified ookinetes respond to the presence of insect culture cells. It was noticed in vitro that in the absence of insect cells the ookinetes did not move over a distance. However, when insect cells were added the ookinetes were stimulated to display gliding motility (Siden-Kiamos et al. Reference Siden-Kiamos, Ecker, Nyback, Louis, Sinden and Billker2006b). This response was also evident by a limited specific transcriptional response detected in a microarray-based RNA profiling experiment (Vontas et al. Reference Vontas, Siden-Kiamos, Papagiannakis, Karras, Waters and Louis2005). At present we know little of the signals that stimulate motility in the ookinete, although, 2 genes recently described may act in a signalling cascade that regulates motility. These genes encode the calcium-dependent protein kinase 3 (CDPK3) (Ishino et al. Reference Ishino, Orito, Chinzei and Yuda2006; Siden-Kiamos et al. Reference Siden-Kiamos, Ecker, Nyback, Louis, Sinden and Billker2006a) and a membrane-associated guanylate-cyclase (PbGCβ) (Hirai et al. Reference Hirai, Arai, Kawai and Matsuoka2006). Mutants, lacking either of these two gene products, display severe disruption of gliding motility and are unable to invade the midgut epithelium. The molecular functions of these two proteins and the signalling cascades in which they operate are presently unknown.
In this study we used pharmacological agents to manipulate intracellular calcium levels in P. berghei ookinetes in order to investigate whether these play a role in regulating survival and motility, as well as in oocyst formation in an in vitro system. Furthermore ookinetes were loaded with fluorescent indicators to directly visualize intracellular calcium in the ookinete.
Materials and Methods
Ookinete cultures
The P. berghei wild type parasite clone 2.34 was maintained in TO mice. The procedures for handling animals were in accordance with the local and national regulations. The culture and the purification of the ookinete stage of the parasite has been described previously (Siden-Kiamos et al. Reference Siden-Kiamos, Vlachou, Margos, Beetsma, Waters, Sinden and Louis2000).
Cell cultures
The cell line used in the study was Aedes aegypti Mos20 ((Singh, Reference Singh1971), ATCC # CCL-125), maintained in Medium 199 obtained from Gibco at 25°C. Co-cultures of cells and enriched ookinetes were grown at 20°C, in 8-well Lab-Tek chamber slides (Nalge Nunc). About 1×10⁴ enriched ookinetes were added to 2×10⁵ cells in each well.
Reagents and antibodies
BAPTA/AM (1,2-bis- (o-aminophenoxy)-ethane-N,N,N′,N′-tetraacetic acid, tetra-(acetoxymethyl)ester) and A23187 were obtained from Calbiochem; Calcium Green, Fluo-4 and 4-bromo A23187 were from Molecular Probes. These reagents were dissolved in DMSO and kept as stock solutions at −20°C. Nigericin was obtained from Sigma and the Calcium Calibration Kit from Molecular Probes. To visualize ookinetes we used the monoclonal antibodies 12.1, recognizing the surface antigen Pbs21 of P. berghei (Winger et al. Reference Winger, Tirawanchai, Nicholas, Carter, Smith and Sinden1988), and 4F.2.1.9 recognizing an ookinete protein of 70 kDalton (Siden-Kiamos et al. Reference Siden-Kiamos, Vlachou, Margos, Beetsma, Waters, Sinden and Louis2000). For analysis of the oocyst we used the 23.8.1 monoclonal antibody recognizing the CSP protein (Winger et al. Reference Winger, Tirawanchai, Nicholas, Carter, Smith and Sinden1988). The Alexa series of conjugated anti-mouse IgG antibodies from Molecular Probes were used as secondary antibodies.
Ionophore studies
The ionophore A23187 was used at a final concentration of 2 or 10 μm. The following experiments were performed. (a) “No cells added”: ionophore treatment of ookinetes without addition of cells. (b) “Pre-incubation with cells for 1 h”: ookinetes and Mos20 cells were mixed and incubated for 1 h at room temperature and then the ionophore was added. (c) “Treated with cells”: ookinetes and Mos20 cells were mixed immediately before addition of the ionophore. In all experiments the ionophore was diluted to 10 times the working concentration in M199 medium, and then added to a suspension of cells and/or ookinetes in the same medium, usually at a final volume of 200 μl. The mixture was incubated for 15 min at room temperature. The treated cells and/or ookinetes were then pelleted by centrifugation in a microfuge at 500 g for 5 min, washed once in M199 and finally resuspended in the same medium. Preliminary experiments using a Live/Dead Assay Kit (Molecular Probes) showed that the percentage of dead ookinetes was roughly similar between the differently treated parasites and the control samples, but that the number of intact ones (i.e. clearly recognizable in their characteristic shape as ookinetes) was lower in the treated samples. Therefore the survival of ookinetes by counting in a haemocytometer was determined 1 h after the end of the treatment. When in vitro oocyst formation was monitored, the treated ookinetes were added to fresh Mos20 cells in a Lab-Tek 8-well slide. The addition of fresh cells was necessary because the ionophore also affects the insect cells. Control ookinetes were mock-treated in parallel; they were incubated in M199 medium and subjected to the same centrifugation steps as the treated samples.
BAPTA/AM treatment
The intracellular chelator BAPTA/AM was used in a similar way as the ionophore. The chelator was diluted in the medium, added to the ookinetes and the mixture incubated for 15 min at room temperature. The chelator was removed by centrifugation and washed once as described for the ionophore. The ookinetes were then resuspended in the medium and added to non-treated cells in the 8-well plate.
Antibody staining
Samples were dried down on the slides, heated on a slide warmer for about 10 min and fixed in 50% methanol/50% acetone. After rinsing the slide in phosphate-buffered saline (PBS), the antibody was added diluted in PBS and 5% normal goat serum (NGS). The samples were incubated at room temperature for 30 min, after which the antibody was removed and the sample washed twice during 5 min with PBS. The secondary antibody, diluted in PBS and 5% NGS, was then added and the sample was incubated and washed as for the primary antibody, mounted in Vectashield and viewed under an Axioskop 2 microscope from Zeiss.
Motility studies
Motility was assayed in a quantitative way using a published protocol (Siden-Kiamos et al. Reference Siden-Kiamos, Ecker, Nyback, Louis, Sinden and Billker2006a). Briefly, purified ookinetes were treated with different reagents in parallel with mock-treated controls for 15 min, after which the ookinetes were spun down at 500 g for 5 min, and washed once in M199 medium. The washed ookinetes were then mixed with cells in an 8-well plate and incubated for 24 h at 20°C, after which they were stained with the antibody to the Pb70 antigen. Each sample was then examined under the microscope and the number of ookinetes in aggregates (aggregates contained at least 3 ookinetes) and individual ookinetes were counted separately. At least 100 ookinetes were counted in each experiment.
Calcium measurements
Approximately 5×10⁵ purified ookinetes were spun down and washed once in ookinete loading medium (OLM) medium containing PBS, 20 mm HEPES, 20 mm glucose, 4 mm sodium bicarbonate, 1 mm EGTA and 0·1% (w/v) BSA. The ookinetes were resuspended in 500 μl of OLM and 50 μl was removed and taken through the same procedure; this was the background control. To the remaining 450 μl was added 2 μl of 1 mm Calcium Green diluted 1:1 with Pluronic (Molecular Probes). The ookinetes were incubated at room temperature for 30 min on a rolling wheel. The parasites were then divided into 8 tubes, pelleted in a microfuge and washed once with calcium calibration buffer (CCB) at the respective calcium concentration, or medium M199. The background control was washed with the 0 nm Ca2+ CCB. The samples were resuspended in CCB, at various calcium concentrations as shown in Fig. 4; it contained 10 μm 4-bromo A23187, a non-fluorescent derivative of A23187. In some experiments, nigericin was additionally added to the buffers at a final concentration of 5 μm. Aliquots of the loaded parasites were also resuspended in M199 tissue-culture medium in the absence or presence of roughly 2×10⁵ Mos20 cells. No ionophore was added in these samples. The samples were spotted on slides and photographs were taken with an Axiovert camera mounted on a Zeiss microscope, using the same exposure time for all samples in one experiment. Fluorescence intensities of individual ookinetes were measured on the photographs using the Image J software (http://rsb.info.nih.gov/ij/). Alternatively, the samples were viewed using a Bio-Rad confocal microscope.
Results
Treatment of the ookinetes with the Ca2+ ionophore A23187
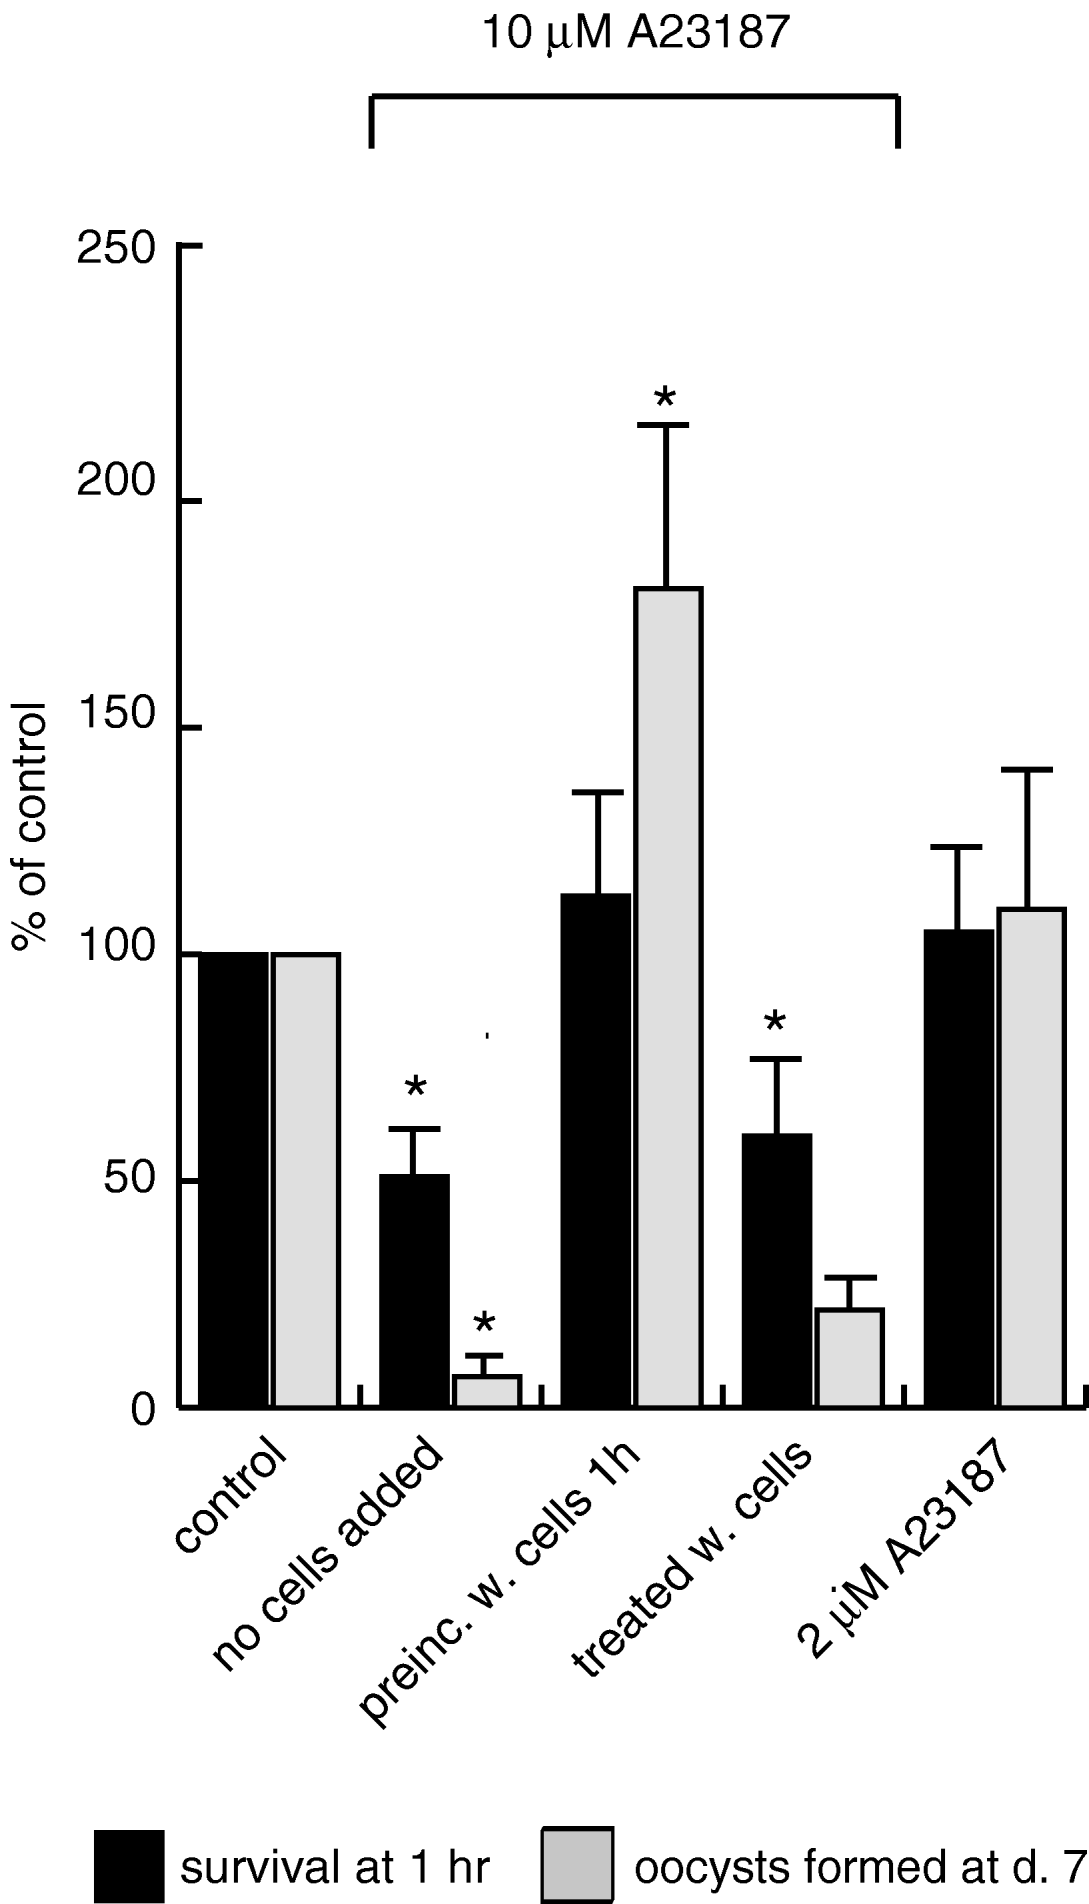
It has been shown previously in T. gondii that treatment with Ca2+ ionophores leads to a decreased ability to invade host cells and death of the parasite (Mondragon and Frixione, Reference Mondragon and Frixione1996; Black et al. Reference Black, Arrizabalaga and Boothroyd2000; Arrizabalaga et al. Reference Arrizabalaga, Ruiz, Moreno and Boothroyd2004). We determined whether an increase in intracellular Ca2+ concentration would have a similar lethal effect on P. berghei ookinetes. In vitro-cultured, purified P. berghei ookinetes were treated with 10 μm A23187 ionophore, and the ookinetes were allowed to recover for 1 h after removal of the ionophore. Survival was determined by counting ookinetes which were still recognizable in their characteristic shape (‘intact’ ookinetes) in the haematocytometer. The results (Fig. 1, black bars, ‘no cells added’) showed that the treatment with the ionophore indeed resulted in a decrease in the number of ‘intact’ ookinetes, indicating that treatment of the parasites with the ionophore eventually resulted in lysis of the ookinetes. In parallel, samples were also treated with only 2 μm A23187; in these samples viability was not compromised (Fig. 1).
Viability of ookinetes after treatment with the ionophore A23187. Survival of treated ookinetes is expressed as the percentage of non-treated parasites (non-treated=100%). Black columns represent survival measured in a haemocytometer 1 h after treatment, grey columns show the percentage of oocysts formed in vitro 7 days after treatment. ‘no cells added’: ookinetes were treated with 10 μm A23187 in the absence of Mos20 insect cells. ‘preinc. w. cells 1h’: the ookinetes were pre-incubated with Mos20 cells for 1 h, before the addition of 10 μm A23187. ‘treated with cells’: the ookinetes were mixed with cells immediately before the addition of 10 μm A23187. ‘2 μm A23187’: ookinetes were treated with 2 μm of the ionophore in the absence of cells. The columns represent the mean of at least 3 independent experiments and s.e.m. is indicated as error bars. An asterisk indicates a significant difference of the sample compared to the control (P<0·05; two-tailed Student's t-test).

We also investigated whether the surviving A23187-treated ookinetes could form oocysts in vitro. For this we used the in vitro co-culture system described previously (Siden-Kiamos et al. Reference Siden-Kiamos, Vlachou, Margos, Beetsma, Waters, Sinden and Louis2000). Briefly, ookinetes were added to Aedes aegypti Mos20 cells, which are invaded by the parasites after about 24 h. Intracellular oocysts developed and expressed the circumsporozoite protein (CSP) after 1 week of co-culture. As shown in Fig. 1 (grey columns), the ability to form oocysts was decreased more than 10-fold for ookinetes pre-treated with 10 μm A23187, compared to the roughly 2-fold reduction in surviving ookinetes after 1 h of the same treatment, as described above. The treatment with 2 μm A23187, on the other hand, did not have a measurable effect on oocyst formation.
Next we determined whether the presence of insect cells during treatment with the ionophore would protect the ookinetes from the toxic effect of the drug. Four aliquots of parasites were examined in parallel using the following design. The first aliquot was treated as described above, with no insect cells added during treatment. In the second aliquot, ookinetes were mixed with Mos20 cells and incubated for 1 h before the ionophore was added. In the third, the ookinetes and cells were mixed immediately before addition of A23187. Finally, a control was included consisting of non-treated parasites. Survival of the ookinetes was measured in the haemocytometer after 1 h of recovery and oocyst formation in vitro was also monitored. The results are shown in Fig. 1. When ookinetes were pre-incubated with the cells, before the addition of ionophore, they were not only protected from the effect of the drug but, remarkably, a roughly 2-fold stimulation of the number of oocysts formed compared to the untreated control was observed. On the other hand, when ookinetes and cells were mixed at the time of the ionophore addition (i.e. no pre-incubation of ookinetes and cells) the results were similar to the samples where no cells were added; there was a significant decrease in survival after 1 h and also a reduction in oocyst formation. These results indicate that during 1 h of pre-incubation in the presence of cells the ookinetes become resistant to the effect of the ionophore and the ability of the treated parasites to form oocysts is enhanced.
Intracellular chelation of calcium ions leads to increased oocyst formation
Next we investigated the effects of a decrease of intracellular Ca2+. For this, ookinetes were treated with the intracellular chelator BAPTA/AM. The chelator was removed from the medium and the treated ookinetes were added to Mos20 cells for in vitro oocyst cultures as described above. The number of CSP-expressing oocysts in the co-culture was determined after 7 days of co-culture. The result, shown in Fig. 2, was an increase of the number of oocysts in the samples seeded with ookinetes treated with the chelator; this increase in the number of oocysts formed ranging from 1·5-fold to 5-fold compared to the control was consistently observed in 6 independent experiments.
Treatment of ookinetes with BAPTA/AM enhances oocyst formation in vitro. (A, B) Representative microscopy fields of CSP-stained oocysts orginating from non-treated (A) and BAPTA/AM-treated ookinetes (B) after 7 days of co-culture with Mos20 cells. (C) Oocysts formed by BAPTA/AM treated ookinetes expressed as a percentage of oocysts derived from non-treated control ookinetes. The graph represents the mean of 6 independent experiments and the range of mean values for each experiment is indicated below the column for BAPTA/AM. Error bars: s.e.m. The asterisk denotes a significant difference compared to the control samples (P<0·01; two-tailed Student's t-test).

Gliding motility is affected by the intracellular calcium concentration
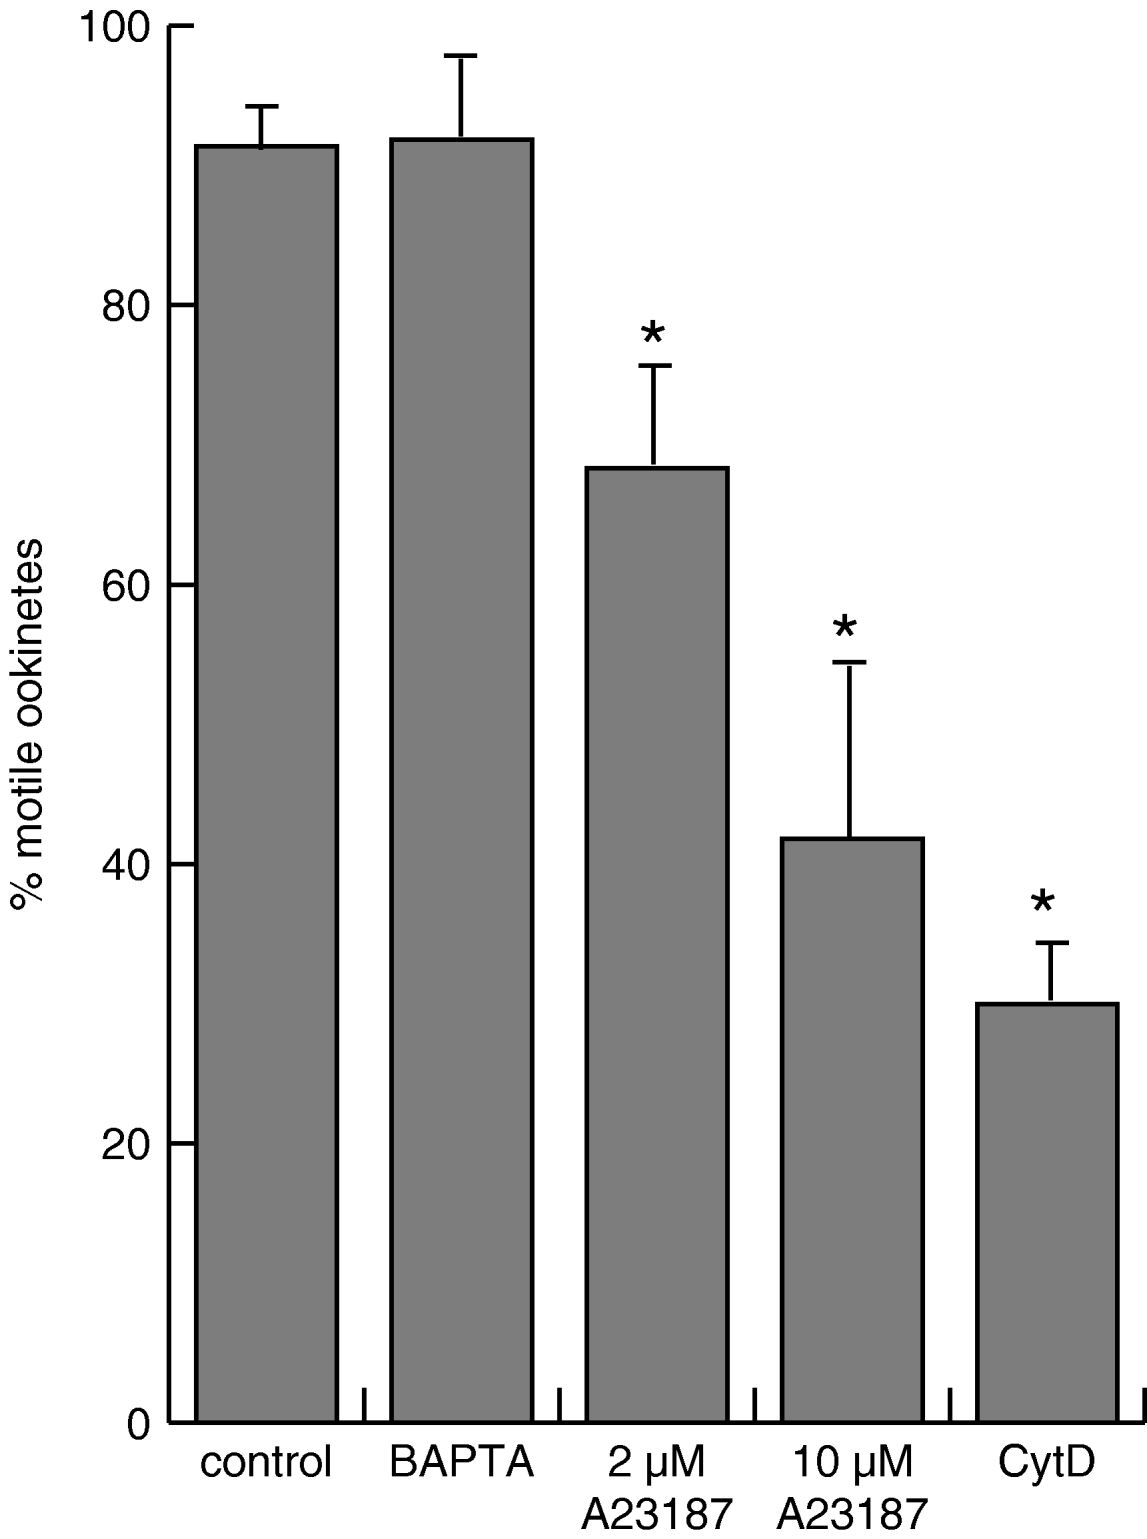
Several studies in T. gondii have shown that intracellular calcium plays a role in regulating motility of the parasite (Lovett et al. Reference Lovett, Marchesini, Moreno and Sibley2002; Wetzel et al. Reference Wetzel, Chen, Ruiz, Moreno and Sibley2004). We asked whether a similar effect could be detected in the ookinetes. To answer this, ookinetes were treated with A23187 and BAPTA/AM, washed to remove the reagents and then incubated with Mos20 insect cells, the latter being necessary for stimulation of productive motility. We used an assay previously described (Siden-Kiamos et al. Reference Siden-Kiamos, Ecker, Nyback, Louis, Sinden and Billker2006a, Reference Siden-Kiamos, Pinder and Louisb) to achieve a quantitative estimate of the effect of the agents. Briefly, this assay is based on the fact that purified ookinetes are mostly aggregated but, when mixed with insect cells, they actively move out of the aggregates during a 24-h period. The experiments (Fig. 3) showed that ookinetes, which had been treated with the BAPTA/AM chelator, were not affected in their motility compared to control ookinetes under these conditions. The treatment with the ionophore, on the other hand, resulted in an inhibitory effect, which was more pronounced at the higher concentration of A23187. This was not unexpected as the ookinetes are compromised in their viability at this concentration. However, treatment at the lower concentration of 2 μm A23187 also significantly decreased the number of motile ookinetes from an average of 91 to 68%, although at this concentration there was no effect on the viability of the parasites.
Motility of ookinetes. The percentage of individual ookinetes compared to the total number of ookinetes in the sample was determined after 24 h of co-culture with Mos20 insect cells. Ookinetes were pre-treated with 2 μm A231872, 10 μm A231872 and 50 μm BAPTA/AM, respectively. Cytochalasin D (10 μm) was added continuously during culture as a control for scattering of ookinetes during seeding; ookinetes are non-motile in the presence of the actin inhibiting drug. The numbers represent the mean of 3 different experiments and error bars show s.e.m. The asterisks denote a significant difference compared to the control samples (P<0·05; two-tailed Student's t-test).

Calcium imaging reveals a decrease in intracellular calcium levels after exposure of ookinetes to cells
We also assessed directly the calcium levels in intact ookinetes using fluorescent calcium indicators. Preliminary experiments employing 2 non-ratiometric indicator dyes, namely the widely used Fluo-4 and Calcium Green, identified Calcium Green as the more suitable indicator as the calcium concentration in ookinetes incubated with cells was low (see below). For the experiments, in vitro-cultured ookinetes were loaded with the indicator at room temperature and after washing they were incubated either with insect cells in their M199 medium or in the medium alone. The Mos 20 insect cells, as mentioned above, stimulate ookinete motility. To quantify the intracellullar calcium concentration samples of the same batch of loaded ookinetes were incubated in buffers with different calcium concentrations in the presence of the ionophore 4-bromo A23187. A background control was also included, which consisted of ookinetes taken through the same procedure but without the addition of the indicator; this did not give rise to any fluorescence at the wavelength used for detection of Calcium Green. The samples were spotted on slides and viewed under an epifluorescence microscope. The intensity of individual ookinetes was measured from photographs as described in the Materials and Methods section.
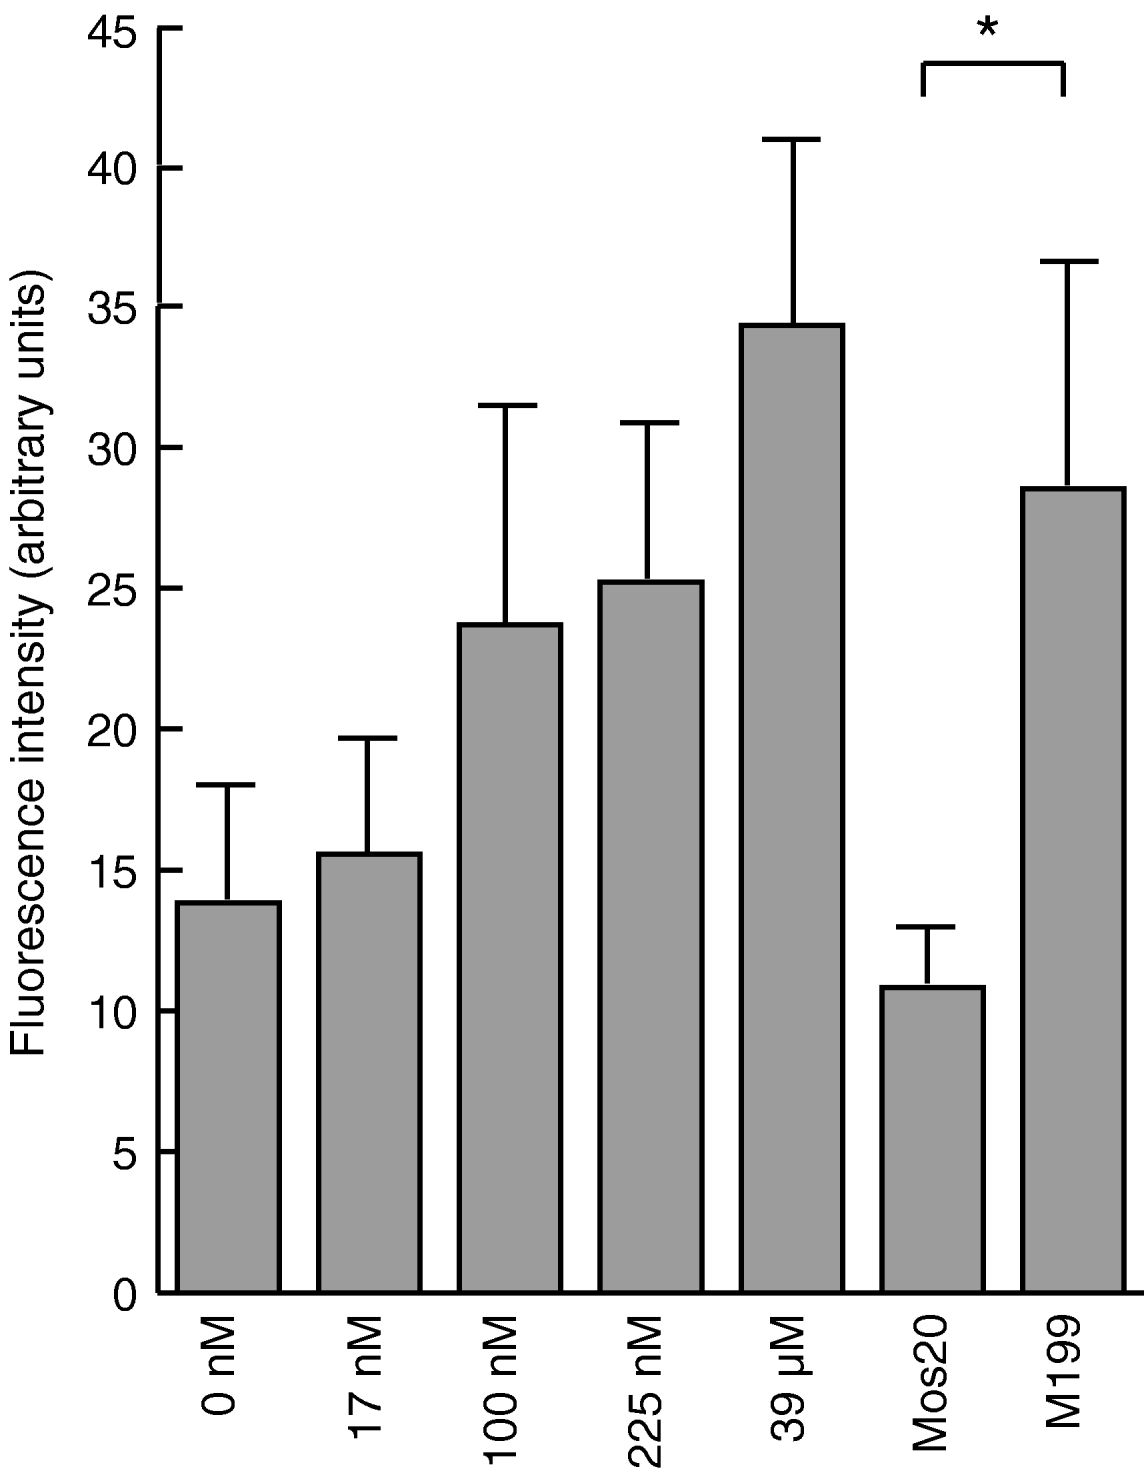
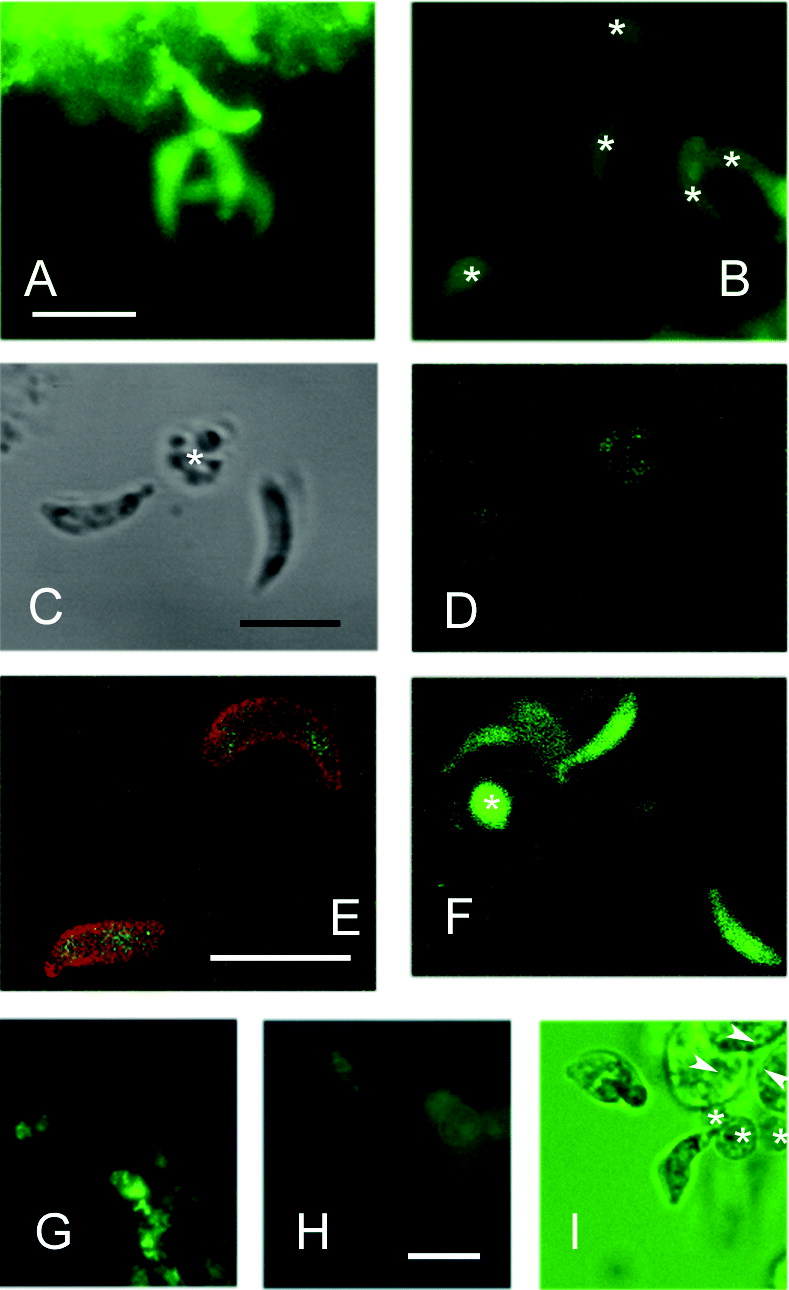
The result of a typical experiment is shown in Fig. 4. Ookinetes incubated in the buffers with increasing concentrations of calcium in the presence of ionophore showed an increased fluorescence, as was expected using this kind of calcium indicator, showing that Calcium Green was suitable for viewing intracellular calcium fluctuations in this range of concentrations. Although this kind of analysis does not allow an accurate measurement of the calcium concentration, a comparison with the values obtained in the Ca2+ calibration buffers (left side of the histogram in Fig. 4) implies that purified ookinetes incubated in tissue-culture medium have an intracellular calcium concentration comparable to other eukaryotic cells, i.e. in the range of 100 nm. Unexpectedly, the calcium levels in the ookinetes that were visualized in the presence of cells were substantially lower than when they were incubated in M199 alone (Fig. 4, 5 A, B). We estimated that the concentration of calcium in the presence of cells was in the very low nanomolar range and very close to the minimum level of detection. The fluorescence was seen uniformly in the cytoplasm, although, usually, less intensely over the nucleus (Fig. 5 A, B). The lower calcium concentration in ookinetes incubated with cells was seen reproducibly over at least 10 different experiments using Calcium Green and the same result was obtained using Fluo-4. In the latter case, however, the fluorescence levels in the parasites incubated with cells were extremely low and a signal could only be detected by using high laser settings in a confocal microscope (Fig. 5 C–F).
Estimation of intracellular calcium using fluorescent calcium indicators. Flurorescence intensity measured from individual ookinetes loaded with Calcium Green and incubated in buffers with different concentrations (indicated below each column) of calcium in the presence of 4-bromo-A23187 (left 5 columns). Calcium Green-loaded ookinetes were also visualized in Medium M199 alone or in the presence of Mos20 cells in M199 (right 2 columns); in this case no ionophore was added. A representative graph from 3 different experiments is shown, with the mean intensity of at least 10 individual ookinetes measured for each data point. Error bars show standard deviation. The asterisk denotes a significant difference between ookinetes in medium alone or in the presence of cells (P<10−4; two-tailed Student's t-test).

The presence of insect cells lowers intracellular calcium concentration in ookinetes. (A, B) Photographs of Calcium Green-loaded ookinetes in M199 medium (A) or in the presence of Mos20 cells (B). The two pictures are from the same batch of loaded ookinetes and were exposed for the same time. The stronger fluorescence mass seen (A, top) is an aggregate of parasite and blood cells originating from the ookinete culture. The ookinetes in (B) are indicated by asterisks. (C–F). Ookinetes loaded with Fluo-4 and viewed with the confocal microscope. (C) Two ookinetes incubated in the presence of cells and viewed with transmission optics and using the 488 nm settings for detection of the green fluorescence (D). No fluorescence can be detected emerging from the ookinetes, while a signal is detected from a blood cell originating from the ookinete preparation (asterisk). (E) Two ookinetes, in the presence of Mos20 cells, which has been loaded with Fluo-4 and counterstained with the 12.1 antibody recognizing the surface antigen Pbs21. Using a high laser setting a weak signal can be detected in the cytoplasm. (F) Ookinetes from the same batch of loaded ookinetes as in (D) and viewed using the same settings, but incubated without insect cells being present. Strong fluorescence is seen. C, D and F are of the same magnification. (G–I). The lower intensity of the ookinetes in the presence of cells is not due to a pH effect. Ookinetes were loaded with Calcium Green and incubated in M199 medium alone (G) or in the presence of Mos20 cells in M199 medium (H); in both cases nigericin was added to the medium. The pictures were captured using the same settings. (I) Transmission view of the same field as in H. Three cells (asterisks in I) originating from the ookinete culture are also visible in (H), while insect cells (arrowheads in I) do not display fluorescence, as they were added to the ookinetes after the loading of the fluorescent dye. The scale bars indicate 10 μm.
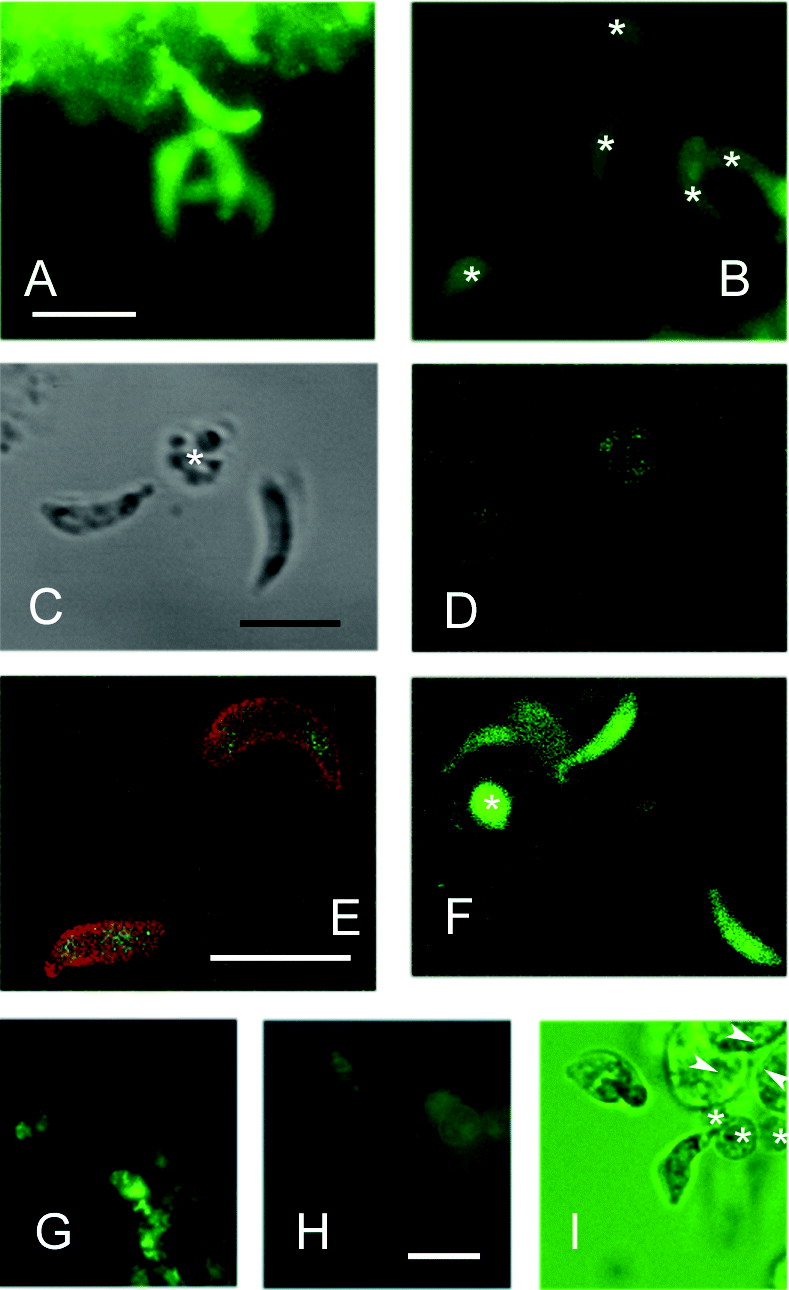
It has been shown for the food vacuole in Plasmodium trophozoites, the stage into which merozoites differentiate after the invasion of red blood cells, that the fluorescence signal of Fluo-4 is pH dependent (Rohrbach et al. Reference Rohrbach, Friedrich, Hentschel, Plattner, Fink and Lanzer2005). Therefore, we repeated the experiments with Calcium Green under the same conditions but added nigericin, which acts as a H+ ionophore, to the assay buffer. Under these conditions the calcium signal was seen in a pattern suggesting that the indicator was compartmentalized and the ookinetes showed effects of stress. However, the effect of decreased fluorescence signal in the presence of cells could still be clearly seen (Fig. 5 G–I).
Calcium fluctuations in the cell during motility have been described for Toxoplasma gondii (Lovett and Sibley, Reference Lovett and Sibley2003; Wetzel et al. Reference Wetzel, Chen, Ruiz, Moreno and Sibley2004). Attempts to detect fluctuations in ookinetes loaded with Calcium Green were unsuccessful. Neither ookinetes incubated in medium alone, nor in the presence of cells showed any detectable calcium fluctuations during observations ranging from seconds to 10 minutes.
Discussion
Intracellular calcium can be directly imaged using fluorescent indicators and an estimate of intracellular calcium concentration can be achieved using this approach. We used this method to estimate intracellular Ca2+ levels in ookinetes and the result revealed that this is in the range of around 100 nm in enriched in vitro cultured ookinetes, i.e. within the range of what is found for most eukaryotic organisms. Unexpectedly, when these same ookinetes were incubated with insect cells, and thus stimulated in their motility, the intensity of the fluorescence decreased to a very low level, indicating that the intracellular calcium concentration decreased. This would be an unusual effect, although not completely unknown among eukaryotic organisms, one example being the fall in cytoplasmic Ca2+ after light-induced stimulation of rhodopsin (Alberts, Reference Alberts, Lewis, Raff, Roberts and Walter2002).
Another series of experiments made use of agents perturbing intracellular calcium levels and these further supported the low level of calcium in ookinetes after mixing with insect cells. First, ookinetes were rescued from lethality induced by treatment with the calcium ionophore A23187 through a pre-incubation with insect cells. Second, motility of ookinetes was not affected by treatment with the BAPTA/AM chelator, while treatment with the ionophore had a slight, yet significant, negative effect on it. Experiments on T. gondii tachyzoites have shown that motility is increased after treatment with an ionophore but our results indicate that the situation in the P. berghei ookinetes is different. Finally, when the ookinetes were allowed to invade insect cells and form oocysts in vitro there was a considerable stimulatory effect of the pre-treatment with the chelator. Attempts to further investigate the effect on ookinetes of the treatment with the two calcium-perturbing agents by microarray RNA profiling experiments were uninformative (data not shown but available upon request).
The low calcium environment in the motile ookinete is seemingly contradictory to the phenotype of the CDPK3 mutant (Ishino et al. Reference Ishino, Orito, Chinzei and Yuda2006; Siden-Kiamos et al. Reference Siden-Kiamos, Ecker, Nyback, Louis, Sinden and Billker2006a). The wild type gene product is a member of a family of kinases that are usually activated by the binding of calcium, while the mutant displays reduced productive motility. We can only propose some possible explanations for this discrepancy. First, no biochemical experiments have been performed to determine whether the CDPK3 protein indeed is activated by calcium, nor do we know the threshold of such Ca2+ activation. Second, the method used for detecting calcium can only measure global calcium levels in the cell, and it is quite possible that in specific parts of the parasite cell the calcium concentration is different from the overall levels detectable. One such subcompartment may be the space between the plasmalemma and the inner membrane complex where the active glideosome is presumably localized. Finally, Ca2+ fluxes in a low concentration interval within the parasite may be taking place during motility, although they would go undetected using the conventional means at our disposal. Indeed, experiments in T. gondii lend support to the importance of rapid Ca2+ fluxes, and not of the absolute Ca2+ concentration, in sustaining motility (Wetzel et al. Reference Wetzel, Chen, Ruiz, Moreno and Sibley2004). Clearly, further investigations using more advanced tools are necessary to fully understand the role of calcium during ookinete motility and its development into the oocyst.
We are grateful to Oliver Billker for interesting discussions and support. John Vontas provided valuable expertise for the transcriptomic analysis. We thank Giorgos Vrentzos for expert help with the cell culture and Robert E. Sinden and Hans Dessens for gifts of antibodies. This work, also supported by the Hellenic Secretariat General for Research and Technology, is part of the activities of the BioMalPar European Network of Excellence supported by a European grant (LSHP-CT-2004-503578) from the Priority 1 ‘Life Sciences, Genomics and Biotechnology for Health’ in the 6th Framework Programme.