During the Age of Mass Migration (1850–1913), more than four million people moved from Ireland to the United States. This period of intense emigration was sparked by the Great Famine in the 1840s and persisted for more than half a century. Although the Irish emigrated in force to England, Canada, and Australia, the United States became the primary destination for overseas Irish settlement. Emigration contributed to the decline of the Irish population from more than eight million in 1840 to less than four and a half million by 1913 and was precipitated by sluggish domestic economic development and expanding opportunity in the United States. The stagnation of opportunity in Ireland not only exacerbated emigration but was thought to have made matters worse by pushing Ireland’s “best men” to leave (Royal Commission on Labour 1893, p. 49).
This article provides new insight on Irish migration by examining exactly who left Ireland for the United States. Despite the profound importance of Irish emigration to the economic development and social history of Ireland, Britain, and the United States, we know surprisingly little about how the people who emigrated compared to those they left behind (“migrant selection”). Using new longitudinal data linking migrants and non-migrants back to their childhood homes in Ireland at the turn of twentieth century, I shed new light on who self-selected into emigration.
Whether or not emigration hindered Irish economic development is hotly debated. Published reports over 50 years claimed that Irish agricultural and industrial growth was stymied by the emigration of Ireland’s most capable people (Carter et al. Reference Carter, Duncan, Nevin and O Buachalla1956; Royal Commission on Labour 1893). These claims have been rejected by economic historians who argue that emigration actually relieved pressure on Irish labor markets and permitted otherwise unattainable growth in wages (Begley, Geary, and Stark Reference Begley, Geary and Stark2016; Boyer, Hatton, and O’Rourke Reference Boyer, Hatton, O’Rourke, Hatton and Williamson1994). Knowing exactly who left Ireland can provide new insight on this issue.
It is also probable that migrants’ characteristics affected economic development in the United States. Immigration benefits the receiving economy when the skills of immigrants compare favorably to natives, or when migrants change institutions for the better (Borjas Reference Borjas2014). Evidence suggests that immigration from Europe benefited the U.S. economy, and highly-skilled Irish immigration may have contributed to such outcomes (Ager and Brückner Reference Ager and Brückner2013; Rodrúguez-Pose and von Berlepsch Reference Ager and Brückner2014). It is also claimed that migrant selection has direct implications for the economic trajectories of immigrants and their children in the United States (Borjas Reference Borjas1994). Few studies of immigrant economic mobility, however, reliably observe immigrants’ socioeconomic backgrounds in the country of origin (see Connor (2018a) for exception).
To measure migrant selection, I assemble new data on Irish-born males who decided to stay in Ireland or move to the United States in the early twentieth century. I assembled this dataset by modifying the methods pioneered by Joseph Ferrie (Reference Ferrie1996) to link a large sample of males between the 1901 and 1911 censuses of Ireland or to the 1910 decennial Census of the United States.Footnote 1 By integrating new measures of the migrant networks and agricultural characteristics of 158 source communities, I examine whether migration decisions vary with the characteristics of origin places.
Contrary to official reports, I find that Ireland’s highly-skilled and wealthier sons were underrepresented in the flow across the Atlantic. Irish emigrants were more likely to be the children of illiterate men and farmers in poorer communities. I estimate that the sons of farmers were 2 percentage points more likely to emigrate than their more highly-skilled counterparts, and the sons of literate men were 1.2 percentage points less likely to emigrate than the sons of illiterate men (from a base probability of 4.3 percent). My findings are, therefore, at odds with claims that Ireland was primarily losing highly-skilled workers to emigration. The fact that emigrants, on average, appear to have been particularly low skilled compared to migrants within Ireland suggests that the United States provided opportunities for people whose prospects were otherwise bleak.
Origin communities may have played a key role in determining who left Ireland. Emigrants were more likely to leave rural than urban areas, and farmers’ sons emigrated at higher rates than the sons of agricultural and non-agricultural laborers. I show the high rate of emigration from households headed by farmers and illiterate men to be closely linked to their disproportionate residence in less productive agricultural communities. Further, by interacting household characteristics with a new name-based measure of historical community emigration, I show that migrant networks were particularly important in facilitating emigration for the poor and lower skilled. This likely reflects the influence of migrant networks in ameliorating poverty constraints on emigration (Spitzer and Zimran Reference Spitzer and Zimran2018).
These findings contribute to a growing literature on the economics of migrant selection (Borjas Reference Borjas2014; Grogger and Hanson Reference Grogger and Hanson2011). The influence of international politics and borders in shaping contemporary migration flows makes it difficult to study who self-selects into emigration today (Boustan and Abramitzky Reference Boustan and Abramitzky2017). Thus, recent studies from the Age of Mass Migration—a largely unregulated era of transatlantic migration—yield valuable new insights (Abramitzky, Boustan, and Eriksson Reference Abramitzky, Boustan and Eriksson2012, Reference Abramitzky, Boustan and Eriksson2013; Kosack and Ward Reference Kosack and Ward2014).Footnote 2 This article contributes to this emerging historical work by examining selection from the country with the highest emigration rate during the Age of Mass Migration, and by highlighting that community conditions can shape national-scale selection patterns.Footnote 3 Although this study does not directly address female migration or migrant selection to Britain, these topics would be valuable future areas for study.Footnote 4
Irish Emigration in the Age of Mass Migration
There are three overlapping explanations for why so many people were leaving Ireland at the turn of the twentieth century. These interpretations highlight how poverty and colonial oppression pushed people to emigrate (Miller Reference Miller1988), the overarching pull of economic opportunity in the United States, and the more intermediate role of migrant networks in creating a path dependency of emigration (O’Rourke Reference O’Rourke1995). Although these interpretations suggest that emigration was higher among the poor, they disagree on the role of individual and community characteristics in influencing who decided to leave Ireland.
Historians typically emphasize the role of poverty and diminishing opportunity in Ireland as the key driver of emigration. The decline of labor-intensive farming and the consolidation of farm holdings, for example, limited land ownership and agricultural laboring opportunities (Fitzpatrick Reference Fitzpatrick1980). These adjustments affected the availability of economic opportunity, and, in turn, demographic outcomes such as marriage and emigration (Guinnane Reference Guinnane1997). In these accounts, people were effectively pushed off the land, with particularly acute effects on the emigration of laborers, peasant farmers, Catholics, and Irish-speakers in poorer agricultural communities (Miller Reference Miller1988).
Access to overseas opportunity also affected migration decisions. Time-series analyses for Irish counties from 1877–1913 suggests that emigration decisions were made through an evaluation of economic opportunity in the United States relative to origin communities (Hatton and Williamson Reference Hatton and Williamson1993). The correlation of emigration rates with rising overseas wages could imply that the pull of opportunity was a more important driver of emigration than push factors in Ireland (O’Rourke Reference O’Rourke1995). If this is the case, individuals with personal characteristics that were relatively better rewarded in the United States may have been particularly attracted to emigration (Abramitzky, Boustan, and Eriksson Reference Abramitzky, Boustan and Eriksson2012).
Migrant networks also likely played a significant role in eliminating economic constraints on migration. Although travel costs declined substantially over time, the price of passage to the United States at the end of the nineteenth century could be similar to the annual rent of a farm in a poorer Irish county, or the weekly wage of an unskilled worker in the United States (Fitzpatrick Reference Fitzpatrick1984; Guinnane Reference Guinnane1997). Given these sizeable costs, it may not be surprising that from 1904–1910, at least 35 percent of Irish steerage passengers crossed the Atlantic on tickets paid by somebody known to them in the United States (Harkness Reference Harkness and Willcox1931). Having access to migrant networks likely depended on whether one grew up in a community highly exposed to emigration, which may in turn have affected who decided to leave Ireland.Footnote 5
Although some earlier literature suggests that Irish emigrants came from poorer backgrounds (Miller Reference Miller1988), there has been no direct examination of migrant self-selection in the later decades of the Age of Mass Migration. Evidence from ship manifests from the Great Famine period (1845–1852) shows emigrants to be poorer and less educated relative to the Irish population (Anbinder and McCaffrey Reference Anbinder and McCaffrey2015; Mokyr and Ó Gráda Reference Mokyr and Ó Gráda1982). Emigration in this period was, however, unusual in both volume and the motivations of migrants. This study is, therefore, the first micro-analysis of Irish migrant selection during the more typical early twentieth century period of emigration.Footnote 6 I specifically examine who moved, and how community and individual characteristics interacted to influence the composition of the emigration flow.
DATA AND ANALYTICAL STRATEGY
To study migrant selection from Ireland, I used record linkage techniques to construct samples of Irish-born males whom I could observe in their homes in Ireland as children (“Child Sample”) or as young working men (“Adult Sample”). By linking these males to later censuses, I can ascertain whether they decided to stay in Ireland or move to the United States.Footnote 7 Although the Adult Sample allows me to assess how migrants were selected from the Irish labor force as of 1901, the Child Sample provides the cleanest estimates of selection as fathers’ occupation is not likely to have been affected by their sons’ childhood expectations regarding migration.Footnote 8
The Child Sample is comprised of sons aged 6–18 in 1901. Because the occupations of adults may have been jointly determined by their expectations regarding emigration, I prefer the Child Sample for comparing emigrants to non-migrants by their economic backgrounds. That is, to avoid the issue of joint determination, I focus on the occupations of co-resident fathers while their sons were in childhood. Focusing on fathers’ characteristics while the sons are young also helps avoid reverse causality in fathers’ wealth through the earlier migration of their children.
The Adult Sample is comprised of men aged 15–25 who reported holding an occupation of their own in Ireland in 1901. It is important that I observe these men in the Irish census prior to migration, as immigrants may hold occupations below their true level of skill in the new country.Footnote 9 While I cannot overcome the fact that the occupations of these men in 1901 may have been affected by expectations regarding subsequent emigration or that these cohorts may have been partially depleted by prior emigration, the migration decisions of these men provide new insight on which segments of the working-age population decided to leave Ireland.
Background to Record Linkage
The last ten years has seen fast progress in the use of automated record linkage to construct longitudinal samples. One of the main challenges in following individuals across censuses is distinguishing between individuals with similar names, years of birth, and birthplaces. In pioneering work, Ferrie (Reference Ferrie1996) manually linked 5,000 individuals from the Public Use Micro Sample for the 1850 Census of the United States to the 1860 federal census manuscript schedules. He did this by developing a set of decision rules to minimize the possibility of incorrectly linking different individuals with similar names and ages. While this linkage approach provides some (pre-defined) leeway in the reporting of years of birth and names to adjust for transcription and reporting error, individuals with more closely matching years of birth are preferred as “successful links.” By exploiting advances in computing power and data availability, economic historians have continued to build on the logic of Ferrie’s (Reference Ferrie1996) approach to construct larger and more diverse longitudinal samples (e.g., Abramitzky, Boustan, and Eriksson Reference Abramitzky, Boustan and Eriksson2012; Abramitzky, Mill, and Pärez Reference Abramitzky, Mill and Pärez2018; Feigenbaum Reference Feigenbaum2016a; Kosack and Ward Reference Kosack and Ward2014).
Recent evidence suggests that the quality of linked samples varies by their linkage criteria: the phonetic standardization of names and low quality data are particularly likely to generate incorrect matches or “false positives” (Bailey et al. Reference Bailey, Cole and Henderson2017). This is concerning as high rates of false positives can bias estimates from linked samples (Massey Reference Massey2017; Ruggles, Fitch, and Roberts Reference Ruggles, Fitch and Roberts2017). Although the evidence is thin on whether false positives have led to distorted research conclusions, these findings demand new vigilance when constructing linked samples.
Such care is particularly important when linking migrants across international borders. Because censuses typically only report the country of birth of immigrants (e.g., “Ireland”) rather than their county or state of birth, we have less information to distinguish between individuals with similar names and birth years. Losing detailed birthplace information can lower sample sizes and increase false positives. False positives are of particular concern here, as they inflate the error in observed origin and destination locations, which could bias measures of selection and weaken the estimated effect of origin community characteristics on migration outcomes.
To improve the quality of my linked sample from Ireland to the United States, I develop a new linkage procedure (the “Geographical Name Match”). I augment the linkage approaches of Ferrie (Reference Ferrie1996) and Ran Abramitzky, Leah Boustan, and Katherine Eriksson (2012) in two ways.Footnote 10 First, based on recent findings that name standardization or excessive cleaning can increase false positives, I rely mainly on names as they were reported in the census. Second, and of great novelty, the Geographical Name Match exploits the fact that many Irish last names are strongly tied to counties and provide meaningful information for analyzing migration (Matheson Reference Matheson1901).
For a sizeable share of the Irish-born population in Ireland in 1901, their birth county could be inferred with reasonable accuracy from their last name. I used the 1901 Census of Ireland to calculate how concentrated last names were to specific counties of birth and then limit the original census records to the 15 percent of men with county-specific last names. A county-specific last name is one that is 60 percent confined to a single county of birth. I chose this cut-off as it reflects the point at which, after imputation, four out of five men have an identical county of birth reported in the census as that implied by their last name.Footnote 11 As the county of birth is imputed for individuals in each of the data sources, even an incorrect imputation of birthplace will not preclude a successful or correct link from the 1901 Census of Ireland to later census years.
Having limited the sample to men with geographical last names, I linked individuals aged from 6–25 in the 1901 Census of Ireland to either the 1911 Census of Ireland or the 1910 Census of the United States, based on their full name and approximate age.Footnote 12 I accounted for age misreporting and differences in the enumeration dates of the censuses by using the iterative age matching procedure employed by Abramitzky, Boustan, and Eriksson (Reference Abramitzky, Boustan and Eriksson2012).Footnote 13 In using this approach, I first searched for individuals from the 1901 Census of Ireland with an identical name and an exact matching year of birth.Footnote 14 If no match could be found, I iteratively broadened the search criteria to people that are up to two years younger or older. Cases matched to multiple individuals by name and age are ineligible for inclusion and dropped from the sample.
In total, there are 125,317 men with a name above the 60 percent threshold in the 1901 census. I successfully linked 36,060 or 29 percent to an Irish-born person with the same name and approximate age in Ireland or the United States in 1910/1911. Of these linked men, 1,953 lived in the United States in 1910, corresponding to an annual emigration rate of around six per thousand for males aged 6–25 in 1901.Footnote 15 Overall, for the Geographical Name Match the “forward linkage” rate from the 1901 census to the later censuses is 29 percent for males aged 6–25 in 1901.Footnote 16 Although some of the non-matched cases are due to linkage failure or name commonness, a non-negligible share of the missing individuals will have either died or moved to countries like England, Canada, or Australia. While migration to these other destinations or selective mortality are topics worthy of further study, they are beyond the scope of this article.
Nonetheless, the Geographical Name Match appears to be a significant improvement on samples generated by other common approaches. Despite employing quite a stringent matching criteria (i.e., matching on full names), the linkage rate of 29 percent is high compared to previous studies. The estimates of inter-county migration generated by this sample are also much more plausible than those generated by other linkage approaches.Footnote 17 In the Online Appendix, I compare estimates generated from samples matched with different levels of stringency. These results suggest that my analyses are not being heavily biased by false positive matches.
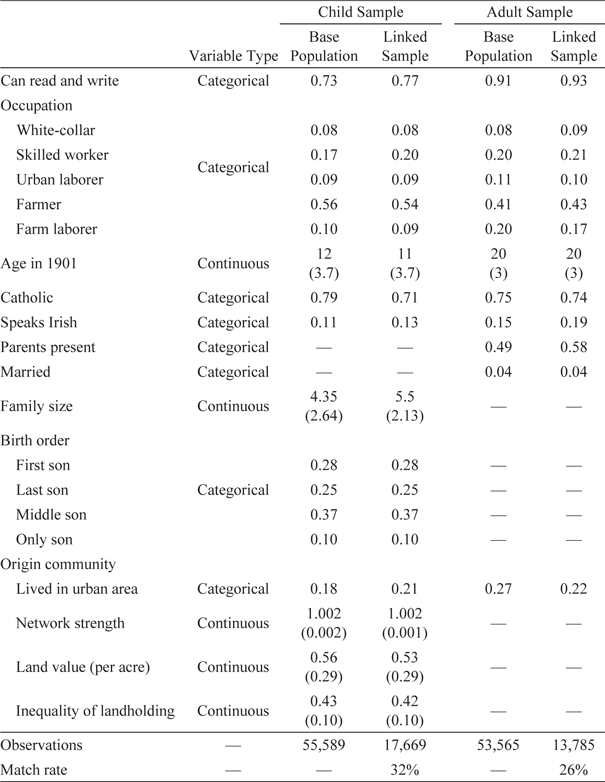
Table 1 presents the basic summary statistics from the Geographical Name Match and the base census data from which they were produced. This table shows the population share for categorical variables, and the mean values with standard deviations in parentheses for continuous variables. The average son in the Child Sample is 11 years old in 1901 and is growing up in a farming household with more than four siblings. Although the characteristics of the linked sample generally resemble those for the base population, the linked sample contains lower shares of Catholics, rural dwellers, and sons of illiterate men, suggesting that higher status households are slightly overrepresented in the linked sample.
SUMMARY STATISTICS FOR LINKED SAMPLES AND THE 1901 CENSUS OF IRELAND

Notes: The match rate for the Birthplace Sample is calculated from a base population with a last name above the 60 percent threshold. The standard deviations of continuous variables are shown in parentheses. The Child Sample is aged 6–18 in 1901 and live with their fathers in 1901. The Adult Sample is aged 15–25, report an occupation of their own and may or may not live with their parents. In the Child Sample, occupation and literacy are measured for the fathers (heads of household) and in the Adult Sample, these characteristics are measured for the men in the sample.
Source: Author’s calculations using 1901 Census of Ireland and linked census data.
Comparisons of the Adult and Child Samples also indicate the presence of intergenerational change. The literacy rate—the share of individuals reporting an ability to read and write—is substantially higher for sons in the Adult Sample than for their fathers in the Child Samples. This difference between the two samples reflects rising literacy levels in Ireland in the late nineteenth and early twentieth century. Although there is a much lower share of farmers in the Adult Sample than farmers’ sons in the Child Sample, this partly reflects that men in the Adult Sample were still quite young (average age of 20) to have acquired land by 1901. This is suggested by the fact that around half of the Adult Sample were still living with their parents in 1901. Thus, the analyses that follow include a control variable for whether individuals were co-resident with their parents.
Estimating Migrant Selection
To measure migrant selection, I estimate how personal and household characteristics are correlated with migration decisions. The selection variables of interest are measures of occupation, literacy, religion, Irish-speaking ability, family size, and birth order.Footnote 18 As neither variable is recorded in the censuses of the United States, the religion and Irish-speaking variables have not typically been available for examination. Economic historians regard the individual-level reports of Irish-speaking ability as quite clean measures of whether or not an individual possessed Irish fluency (Ó Gráda Reference Ó Gráda2006).Footnote 19 It is worth keeping in mind, however, that most young Irish-speakers would have spoken English. As the census did not ask about earnings, I used recent work from Alan Fernihough, Cormac Ó Gráda, and Brendan M. Walsh (2015) to classify occupations according to a modified version of the Historical International Social Class Scheme (HISCLASS) (van Leeuwen and Maas Reference Leeuwen and Maas2011). This permits me to infer skill, class, and land ownership from the occupational returns.
I estimate migrant selection for the Adult and Child Samples using linear probability models. These models predict whether migrants and non-migrants differed from each other with respect to the selection variables of interest. The basic regression equation is specified as:
 $$Y\left( {Migrate} \right) = {\beta _0} + {\sum _{k = 1 \cdots K}}{\beta _k}{X_k}{\beta _k}{X_k} + {u_j},$$
where Y refers to whether an Irish male in 1901 moved to the United States by 1910/1911. Thus, βk can be interpreted as the percentage point difference in the probability of an individual moving to the United States with a one-unit change in the kth independent variable. Selection is inferred from the differences in the probability of migration by occupation and literacy, where the reference group are individuals still living in Ireland in 1911.
Characterizing Origin Communities
Rural Irish communities may have influenced migration decisions by providing economic opportunity or affecting access to migrant networks (Hatton and Williamson Reference Hatton and Williamson1993). As such, I use Poor Law Unions (“PLU”) as my units to measure conditions in origin areas.Footnote 20 Poor Law Unions were local government units formed under the Irish Poor Law Act of 1838 and owing to their administrative function, a wide range of social and economic data were collected for these locales. As the digitized census records do not contain information on households’ PLU, I used the Topographical Index of Ireland to link the 3,000 enumeration districts from the 1901 census to one of the 158 PLUs listed in the land census (Matheson Reference Matheson1908). This PLU link allowed me to characterize communities according to inequality in landholding, the productivity of land, and the strength of emigrant networks. To derive comparable estimates, I standardize these measures so that a one-unit increase in any of these variables is associated with a one standard deviation change.
Measuring Migrant Networks
I use a new name-based approach to measure the strength of emigrant social networks in Irish PLUs. Extending on previous work using last names as proxies for chain migration (Wegge Reference Wegge1998, Reference Wegge2008), I measure community-based migrant networks by comparing how similar the last names of each PLU in 1901 are to the Irish-born population in the United States in 1900.Footnote 21 To measure name similarity, I calculate the average number of letter replacements that it would take to transform one name into all others. The Jaro-Winkler string distance has become a widely used method for calculating the similarity of names based on letter replacements.Footnote 22
I begin by computing the Jaro-Winkler distance between every pair of names observed in Ireland in 1901 and the United States in 1900. Using this matrix, I calculate two statistics for individuals. Statistic 1 is the average distance between each last name in Ireland in 1901 to all last names held by Irish-born people in the 1900 Census of the United States. This captures the average string distance of each last name in Ireland to the names held by Irish-born people in the United States. Statistic 2 is like Statistic 1 but is, instead, calculated relative to the last names held by all Irish-born people in the combined 1901 Irish Census and the 1900 U.S. census. Thus, Statistic 1 represents the average similarity of each name in Ireland to the distribution of names in the United States, while Statistic 2 measures the similarity of each name to the complete distribution of names in Ireland and the United States.
I use Statistic 2 to adjust for baseline similarities between names. Take, for example, the names Connor, McCarthy, and Duffy, which were held by similar numbers of people in the United States in 1900. While the name Connor is similar to common names such as Connelly and O’Connor, and McCarthy resembles names like McGrath and McCauley, there are fewer names like Duffy. As a result, names like Connor and McGrath are mechanically more similar to emigrant names irrespective of actual migration patterns. I overcome this problem in Equation (2) by taking the average string distance of each individual’s name i to the Irish-born population in the United States (Statistic 1) and dividing by the average distance to names in the combined population (Statistic 2). This produces a measure of how overrepresented each individual’s name is in the United States relative to the full Irish-born population in Ireland and the United States. I average these measures across every j PLU to measure community network strength.Footnote 23
 $${{{{\sum {\left( {{\matrix{ network{\mkern 1mu} strentgt{h_j} = \cr Name{\mkern 1mu} similarity{\mkern 1mu} to{\mkern 1mu} Irish{\mkern 1mu} population{\mkern 1mu} in{\mkern 1mu} USA{\mkern 1mu} {\left( {Statistic{\mkern 1mu} 1} \right)_i} \cr} \over {Name{\mkern 1mu} similarity{\mkern 1mu} to{\mkern 1mu} Irish{\mkern 1mu} population{\mkern 1mu} in{\mkern 1mu} Ireland{\mkern 1mu} or{\mkern 1mu} USA{\mkern 1mu} {{\left( {Statistic{\mkern 1mu} 2} \right)}_i}}}} \right)} }_j}} \over {{N_j}}}$$
This network strength measure can be interpreted as a measure of the social proximity of Irish communities to the Irish population in the United States. By comparing emigrant names to those of people still living in origin communities, my measure plausibly captures existing ties, reflecting the strength of a community’s migrant network.Footnote 24 With respect to interpretation, it should be noted that this network measure partially captures the persisting local conditions that generated historical migration.
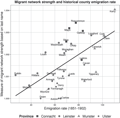
The performance of this variable in measuring migrant network strength is supported by its strong positive correlation (+0.61) with the official estimate of the county-level emigration rate from 1851–1902.Footnote 25 Figure 1 shows higher emigration rates and migrant network strength in the western Irish counties of Munster and Connacht including Cork, Kerry, Clare, Galway, and Limerick. Emigration rates and network strength are lower in eastern counties in the provinces of Leinster and Ulster including Dublin and the Belfast counties of Antrim and Down. These strong correlations provide credence for the validity of the network measure, with its main strength being that it can be flexibly derived at different spatial scales (i.e., PLUs).
MIGRANT NETWORK MEASURE AND COUNTY EMIGRATION RATE 1851–1902

Land Structure and Productivity
The measures of the distribution and value of landholdings were transcribed from the Irish land census of 1901. These registers detail the valuation and number of families living on agricultural holdings within each PLU.Footnote 26 The census classified valuations into 11 categories ranging from s4 or less to greater than £300. I used this information to measure the average per acreage value of landholdings and to construct a Gini index of inequality for each PLU. These data from the land census are only applicable to rural areas.
The value of landholding per acre may be best interpreted as a measure of productivity rather than wealth. Because the history of tenancy in Ireland makes it difficult to draw sharp distinctions between owners and occupiers (Turner Reference Turner2002), the valuation of land may better reflect agricultural rents (Burt Reference Burt1986; Featherstone and Baker Reference Featherstone and Baker1987) and the capitalization of land use (Borchers, Ifft, and Kuethe Reference Borchers, Ifft and Kuethe2014). Thus, this measure provides a general proxy for rural economic productivity. I also use these data to indirectly measure the economic position of farming households. To overcome the lack of information on household wealth in the indexed census, I use the per acreage land values of PLUs to classify farmers and laborers based on whether they lived in high, medium, or low productivity areas.Footnote 27
IRISH MIGRANT SELECTION FROM 1901–1911
Describing Irish Emigration Patterns
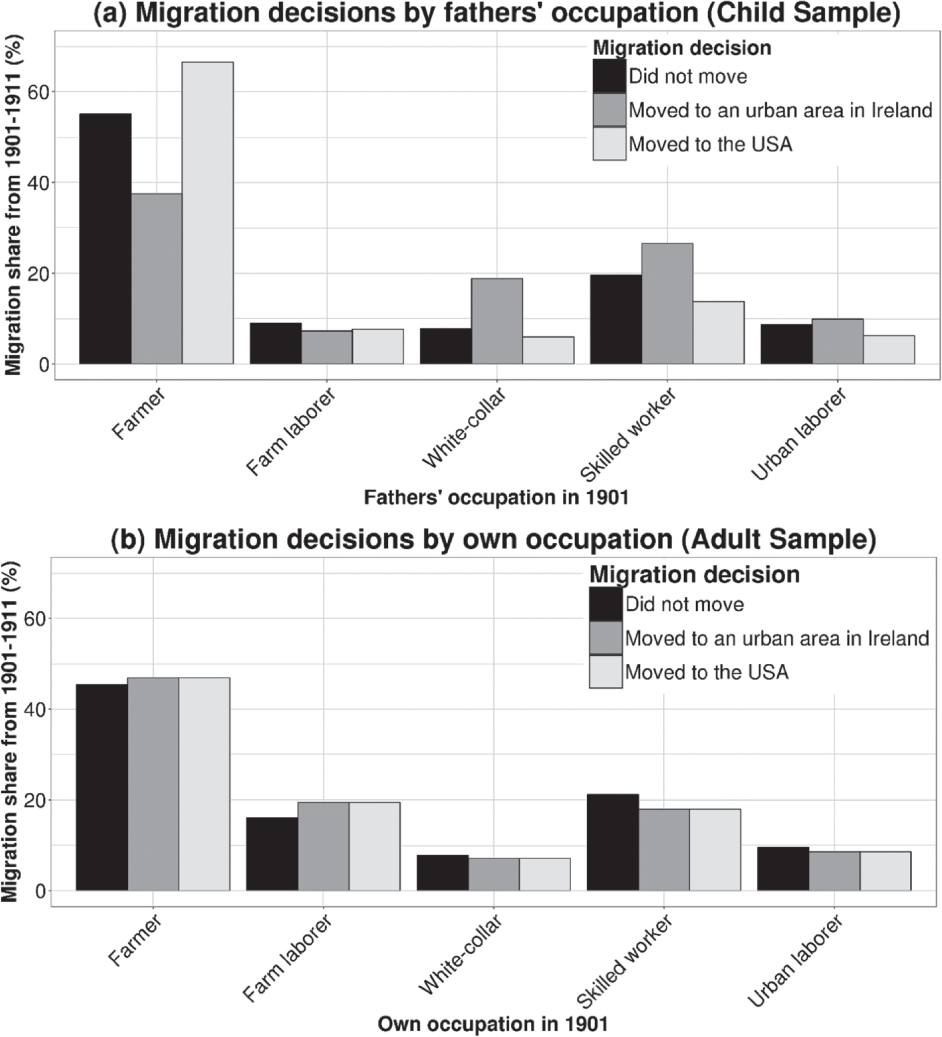
I begin by using these data to describe the occupational backgrounds and origin locations of emigrants. Figure 2 decomposes the linked sample of males by whether they stayed in their origin county, moved county within Ireland, or moved to the United States between 1901–1911. Panel A segments migration decisions by fathers’ occupation (Child Sample) and Panel B presents differences by own occupation (Adult Sample). The shares presented in Figure 2 sum to 100 percent by the categories of migration decision.
OCCUPATIONAL BACKGROUND IN IRELAND AND MIGRATION DECISIONS 1901–1911

It is evident from Figure 2 that migration decisions did, in fact, vary by occupational background. Panel A shows that although around half of non-migrants in the Child Sample are the sons of farmers, they are still highly overrepresented in the flow to the United States: farmers’ sons account for 55 percent of the population staying in their home communities, 38 percent of migrants to Irish urban areas, but 67 percent of the emigration flow. Moreover, the sons of farmers are the only occupational group overrepresented among emigrants, highlighting the importance of farming origin in the story of Irish emigration.
Although the patterns based on own occupation (Panel B) mostly mirror those for fathers’ occupation (Panel A) with respect to emigration, the main points of divergence are within the agricultural sector. Panel B shows that farmers themselves equally account for around 45 percent emigrants, inter-county movers, and non-migrants. Farm laborers, in contrast, are overrepresented among inter-county movers and emigrants when compared to the non-migrant population. Thus, the Adult Sample appears to diverge from the Child Sample in that farmers (landholders) are relatively less likely to emigrate than farm laborers (landless), suggesting that landholding itself affected emigration decisions. Moreover, the similarity of migration shares by occupation in 1901 in the Adult Sample suggests emigration was widely spread, and selection by own occupation was relatively weak.
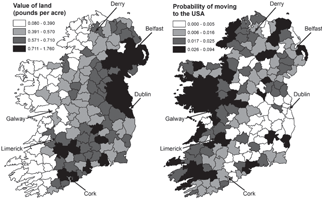
Individuals and families in rural Ireland not only differed by landholding status but also with respect to productivity. As such, the occupation of “farmer” masks much heterogeneity. By mapping the land value of PLUs (left) and their emigration rates (right), Figure 3 offers further insight on the backgrounds of migrants. Land values tended to be high in proximity to the major port cities of Dublin, Belfast, and Cork, and in more productive landlocked agricultural regions across the south of the island. Land values were lower, in contrast, in less productive rural communities along Ireland’s western Atlantic coast.Footnote 28
EMIGRATION TO THE UNITED STATES AND LAND VALUES IN THE EARLY TWENTIETH CENTURY BY PLU

It is telling, therefore, that emigration was most pronounced from less productive rural communities. Figure 3 shows that up to 10 percent of the sample emigrated from some of these western communities: such emigration rates are more than ten times higher than those in the areas surrounding Dublin. Thus, the juxtaposition of these maps indicates that emigration may not only have been affected by landholding status, but was also most acute in Ireland’s least productive rural communities. The following sections use regression frameworks to more directly measure and test the robustness of these patterns of migrant selection.
Selection from the Adult and Child Samples
How did emigrants compare to the people they left behind? This section addresses this question by estimating migrant selection using linear probability models (Equation (1)). As fathers’ characteristics provide the cleanest measures of selection, I begin by estimating the probability that sons left Ireland based on their fathers’ occupation and literacy. As occupation and literacy are correlated with one another, this stage of the analysis focuses on their univariate effects on emigration decisions, which are conditional only on age (modelled with a fixed effect).
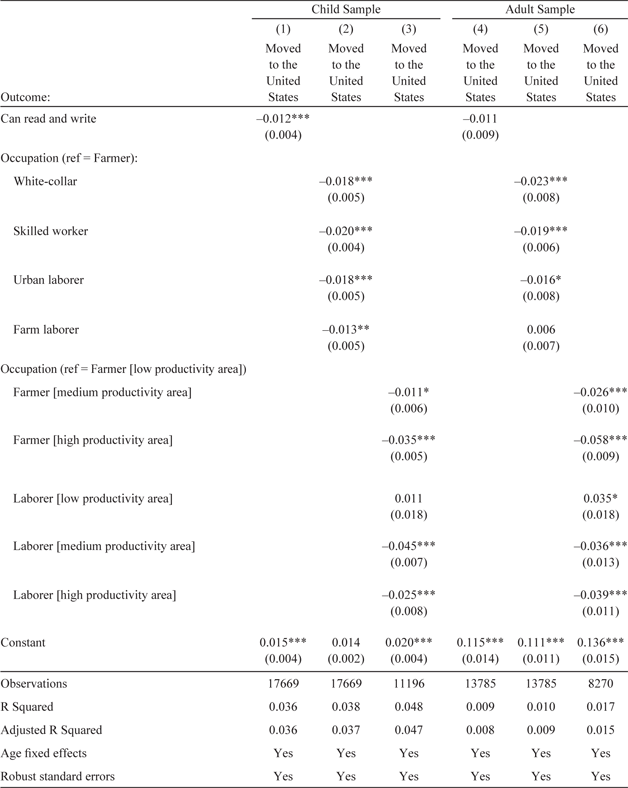
Columns 1–3 of Table 2 present the models pertaining to emigrant selection within the Child Sample. The estimates in Column 1 show the sons of literate men to be 1.2 percentage points less likely to move to the United States than the sons of illiterate men (from a base probability of 4.3 percent). The estimates in Column 2 also confirm the finding of relatively higher emigration rates for farmers’ sons: the sons of white-collar and skilled workers, and urban laborers, are around 1.8 to 2 percentage points less likely to emigrate than the reference group in the regressions (the sons of farmers). As farm laborers’ sons are also less likely to emigrate than farmers’ sons, these estimates do not just reflect emigration differences between urban and rural areas.
OCCUPATION, LITERACY, AND EMIGRATION TO THE UNITED STATES 1901–1911

Standard errors in parentheses. Significance levels: * p < 0.10, ** p < 0.05, *** p < 0.01
Notes: The Adult Sample is confined to males aged 15–25 in 1901 and the Child Sample is confined to sons aged 6–18 in 1901. In the Child Sample, occupation and literacy are measured for the fathers of the individuals in the sample from the 1901 census. The measures of productivity are imputed using PLU measures from the land census that were linked to the 1901 census of population. The outcome variable refers to whether an individual moved to the United States relative to all individuals in the sample who stayed in Ireland from 1901–1911. The baseline probabilities of emigration for these samples are: 0.043 (C1, C2), 0.05 (C3), 0.083 (C4, C5), 0.09 (C6).
Source: Author’s calculations using linked census data.
By decomposing farming and laboring households by local per capita land value, Column 3 provides evidence regarding the economic backgrounds of emigrants from agricultural areas. As a baseline, 6.5 percent of the sons of farmers in low productivity areas—the reference group in the regressions presented in Column 3—moved to the United States. The estimates in Column 3 show farmers’ sons in medium and high productivity areas were 1.1 and 3.5 percentage points less likely to emigrate, implying that the sons of poorer farmers were more likely to leave Ireland. In Column 3, there is also no significant difference in the probability of emigration for farmers’ and laborers’ sons within low productivity areas (p < 0.10), suggesting stronger patterns of selection on origin location than occupational background. Further evidence for this claim is provided by Columns 3 and 6, which show that farm laborers and their sons were also relatively less likely to leave medium and high productivity areas than their farming and laboring counterparts in low productivity areas. These results suggest that the overrepresentation of farmers’ sons in the emigration flow partly stemmed from their concentrated residence in less productive areas.
If intergenerational mobility was high in Ireland in the early twentieth century, fathers’ occupation and literacy could be misleading measures of emigrants’ characteristics.Footnote 29 Thus, Columns 4-6 of Table 2 use the Adult Sample to estimate the probability of emigration by own occupation and literacy. These estimates are also only conditional on age. The estimated negative coefficient for literacy on emigration in Column 4 is similar in magnitude and direction to the coefficient for fathers’ literacy (Column 1), but is imprecisely estimated, perhaps due to the relatively small number of illiterate young men in the 1901 census. In the case of occupation, Column 5 shows farmers (the reference group) to be significantly more likely to emigrate than urban laborers and skilled workers. Within agriculture, Column 6 shows that emigration was also higher from low productivity areas. These estimates suggest that patterns of migrant self-selection are generally similar whether they are measured based on emigrants’ own characteristics or those of their fathers. The only notable discrepancy between the samples is that farm laborers were as likely to emigrate as farmers in the Adult Sample, but this likely reflects reduced emigration for men who had acquired land.
These baseline estimates suggest that emigrants were more likely to be the sons of lower educated and farming men in the least productive rural communities. As these places were relatively poor on average, these estimates lead me to conclude that emigrants tended to be drawn from the less educated and poorer tails of the Irish population, with the caveat that they were more likely to grow up in landholding households (albeit poorer ones). These estimates are generally consistent across the Adult and Child Samples. The fact that farmers’ and farm laborers’ sons were similarly likely to leave low productivity areas indicates that origin communities may have affected emigration decisions above and beyond fathers’ occupation.
Measuring Selection with Control Variables
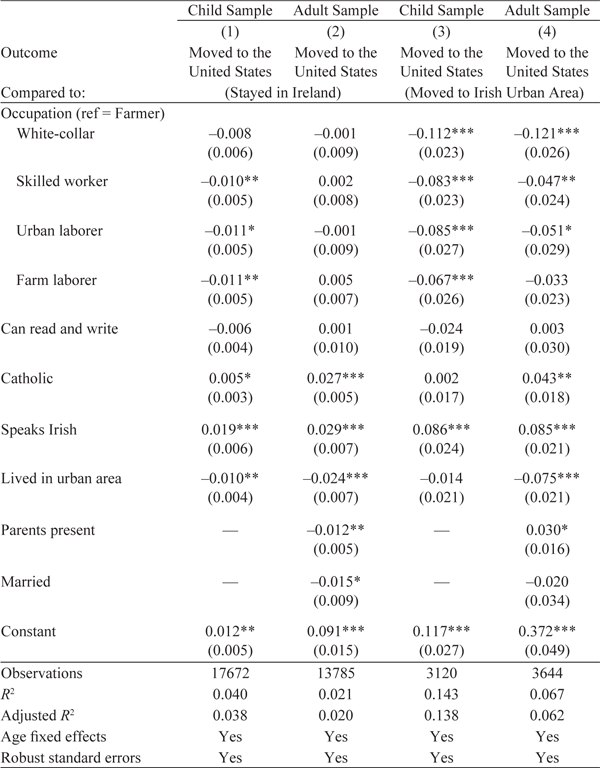
Occupation is not only correlated with geography, but also a range of other individual and household characteristics. Thus, Table 3 estimates the conditional correlation of occupation and literacy with emigration while controlling for religion, Irish-speaking ability, urban origin, and household characteristics.Footnote 30 But for the addition of these control variables, the estimates presented in Column 1 (Child Sample) and Column 2 (Adult Sample) were generated from models identical to those presented in Table 2. These models also provide a means of testing whether religion or Irish-speaking ability may have had effects on emigration that were independent of occupation and literacy.
OCCUPATION, LITERACY, AND EMIGRATION WITH CONTROL VARIABLES TO THE UNITED STATES 1901–1911

Standard errors in parentheses. Significance levels: *p < 0.10, **p < 0.05, ***p < 0.01
Notes: The Adult Sample is confined to males aged 15–25 in 1901 and the Child Sample is confined to sons aged 6–18 in 1901. In the Child Sample, occupation and literacy are measured for the fathers of the individuals in the sample from the 1901 census. The outcome variable is whether an individual moved to the United States relative to all individuals in the sample who stayed in Ireland (Columns 1 and 2) or who moved to an urban area in Ireland (Columns 3 and 4). The baseline probabilities of emigration for these samples are: 0.043 (C1), 0.083 (C2), 0.30 (C3), 0.37 (C4).
Source: Author’s calculations using linked census data.
The estimates in Columns 1 and 2 of Table 3 provide a robustness test of the initial findings regarding selection on occupation and literacy. Although the main finding from the Child Sample—the high emigration rate of farmers’ sons—persists in Column 1 with these additional controls variables, there is a sizeable attenuation in the estimated differences between farmers’ sons and the sons of urban laborers, and skilled and white-collar workers. While the latter were 2 percentage points less likely to emigrate in the initial univariate models (Table 2), they are around 1 percentage point less likely to do so once the conditional controls are added. Further, the controls account for almost the entire effect of own occupation and literacy on emigration (Column 2).
Much of this attenuation is driven by the added control variable for living in an urban area. Urban residence is associated with a 1 percentage point reduction in the probability of emigration in the Child Sample and more than a 2 percentage point reduction from the Adult Sample. This is roughly commensurate with the attenuation in the occupational coefficients between Tables 2 and 3, and holds when urban residence is modeled as the only control variable (see Section 13 of the Online Appendix). Thus, around half of the association between fathers’ occupation and emigration, and almost all of own occupation, can be accounted for by urban residence, providing further evidence for the role of origin location in affecting emigration decisions by occupational background.
Despite the attenuation of migrant selection by occupation in these models, Irish-speaking ability and religion are revealed to have a strong correlation with emigration. Depending on whether the Adult or Child sample is used, Catholics are from 0.5–2.7 percentage points more likely to move to the United States than non-Catholics. Likewise, Irish-speakers are around 2–3 percentage points more likely to emigrate. Irish-speakers were heavily concentrated in the Gaeltacht communities across Ireland’s emigration-prone west coast. While these data do not allow me to reveal the direct source of the correlation of religion and Irish-speaking with emigration, these models show these correlations to persist even after accounting for occupational background, literacy, and urban residence.
Comparison of Emigrants to Movers to Urban Areas in Ireland
High rates of rural emigration could reflect poor conditions in rural areas driving emigration or, conversely, the reluctance of individuals with highly-valued skills to leave Irish towns and cities. I examine this by testing for occupational differences between emigrants and men who moved across counties to an urban area over the 1901–1911 period. If occupational differences in emigration simply reflect stronger “push” forces from rural than urban areas, we would expect high rates of rural emigration, but weaker occupational selection across destinations. In contrast, if Irish towns and cities provided relatively better opportunities for highly-skilled workers, we would expect greater differentiation in the pre-migration occupations of inter-county movers and emigrants.
I make this comparison in Columns 3 and 4 of Table 3, where I compare the characteristics of emigrants to their counterparts moving to urban areas in Ireland over the same period. Column 3 shows strong differences in the occupational background of emigrants relative to movers within Ireland: the sons of farmers are significantly more likely to choose the United States than to move to Irish towns and cities. The relative probability of moving to urban areas in Ireland over the United States also appears to increase with skill. This is most pronounced for the sons of white-collar workers who are 11–12 percentage points less likely than farmers to move to the United States than to move to an urban area in Ireland. As these models control for urban origin and a range of other characteristics, these destination differences by occupation are even more striking.
The magnitude and robustness of these destination choices suggest that urban areas in Ireland were attracting particularly highly-skilled workers. As the occupational differences between emigrants and inter-county movers (Column 3 and 4) are substantially larger than when made to the full population staying in Ireland (Column 1 and 2), this implies that men moving within Ireland were disproportionately drawn from the higher skilled tail of the Irish population. As highly-skilled workers were generally less economically constrained in their migration decisions, the most plausible explanation for high skilled inter-county migration is the greater availability of skilled opportunities in Irish towns and cities. Articulated in reverse, the relatively high rate of emigration from lower skilled and poorer farming households likely reflects limited opportunities in home communities and in Irish urban labor markets.
COMMUNITY AND HOUSEHOLD COVARIATES AND MIGRANT SELECTION
The previous analyses highlight that who left Ireland depended heavily on where they grew-up and which families they were born into. While skill-selective migration within Ireland may reflect the higher domestic demand for skilled labor, origin communities may have affected the balance of emigration from farming or laboring households. This section explicitly examines the role of rural conditions and access to migrant networks in accounting for emigrant self-selection.
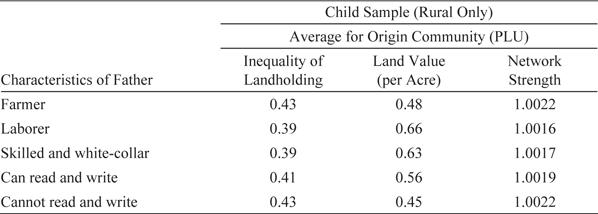
Table 4 describes the variation in origin community characteristics that could impact migrant selection by fathers’ occupation. In this table, I present average values of community landholding inequality, land value, and migrant network strength by fathers’ characteristics. The main pattern evident from Table 4 is that, on average, the sons of farmers and illiterate men—individuals found to be more likely to emigrate—were more concentrated in unequal communities with lower land values and stronger migrant networks than their counterparts from literate, laboring, or highly-skilled households. This descriptive table provides a clear indication that fathers’ characteristics are correlated with origin community attributes, which could account for occupational and literacy differences in migration decisions.
AVERAGES OF ORIGIN COMMUNITY CHARACTERISTICS BY FATHERS’ OCCUPATION AND LITERACY

Notes: Table 4 presents the average values of PLU characteristics for sons in the rural Child Sample based on their fathers’ characteristics.
Source: Author’s calculations using linked census data.
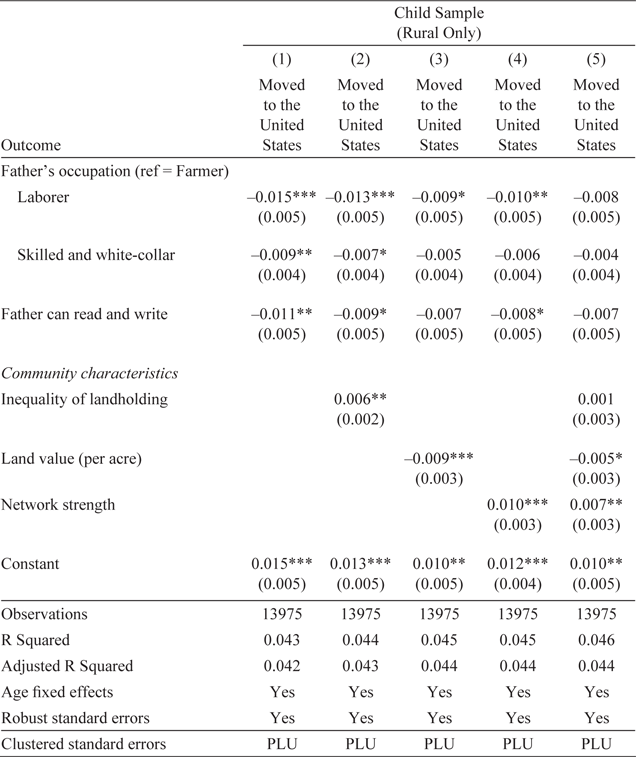
My first objective is to ascertain whether these origin community differences can account for which sons left rural areas to move to the United States. I do this by estimating baseline differences in the probability of emigration by fathers’ literacy and occupation in Column 1 of Table 5, and then individually adding community control variables. Before simultaneously modeling the relationships of landholding inequality, land value, and network strength with emigration (Column 5), I estimate each relationship in isolation in Columns 2–4, as sequentially adding these variables may lead to misinterpretation in the correlation of community covariates with emigration (Gelbach Reference Gelbach2016).
The estimates presented in Columns 2–4 show strong significant coefficients for each of these community characteristics. Controlling for parents’ characteristics, emigration was more likely from low productivity and more unequal communities with stronger migrant networks. Individually, a standard deviation increase in migrant network strength is associated with a 1 percentage point increase in the probability of emigration, while a similar increase in landholding inequality predicts 0.6 of a percentage point increase (from a base probability of 4.7 percent). As expected, emigration decreases where land values are higher.
COMMUNITY CHARACTERISTICS AND EMIGRATION FROM RURAL AREAS TO THE UNITED STATES 1901–1911

Standard errors in parentheses. Significance levels: * p < 0.10, ** p < 0.05, *** p < 0.01
Notes: This sample is confined to sons aged 6–18 and living in a rural area in 1901. In this sample, occupation and literacy are measured for the fathers of the individuals in the sample from the 1901 census. The outcome variable is whether an individual moved to the United States relative to all individuals in the sample who stayed in Ireland. I adjust the standard errors to account for the clustering of observations across PLUs (e.g., Moulton Reference Moulton1990). The baseline probability of emigration for this samples is 0.047 (C1–C5).
Source: Author’s calculations using linked census data.
When all of the local covariates are included in Column 5, network strength and land value have persisting and similarly sized coefficients. While the landholding inequality coefficient tends toward zero in this saturated model, a standard deviation increase in network strength is associated with a significant 0.7 percentage point increase, and for land value a 0.5 point decrease, in the probability of emigration. This suggests that the economic productivity and migrant network strength of origin communities had substantial effects on emigration decisions.
These origin community characteristics also account for much of the variation in emigration across occupational categories. In the baseline model in Column 1, the sons of laborers and literate men are 1.5 and 1.1 percentage points less likely to emigrate, respectively. By controlling for the land value and network strength of communities in Columns 3 and 4, the coefficients on occupation attenuate by around one-third, and when modeled together, these occupational coefficients almost halve from Column 1 and are no longer significant. These changes imply that much of the difference in the emigration of the sons of farmers and non-farmers stems from the residence of farming households in less productive communities with stronger emigrant networks.
Networks
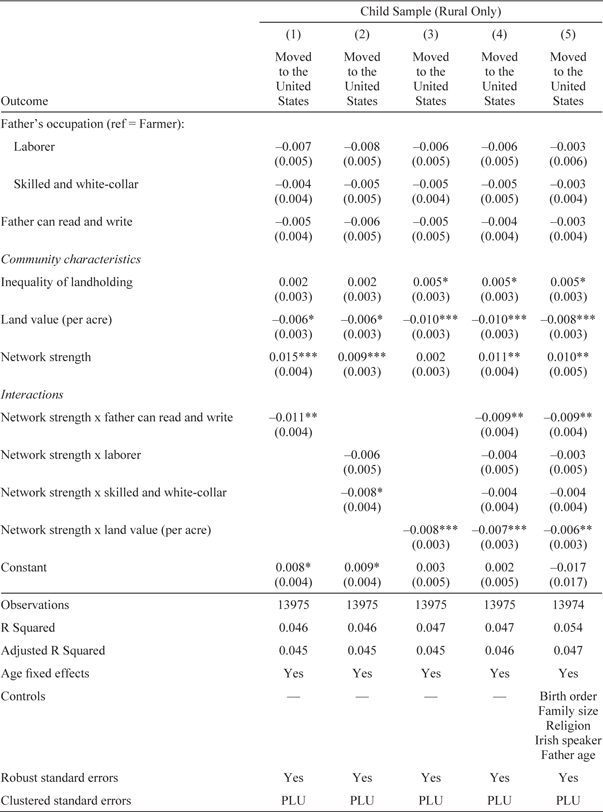
While landholding and economic conditions may have affected where people emigrated from, the strength of migrant networks could also be a source of heterogeneity in who self-selected into migration across different communities. Access to emigrant networks may help the poor to overcome cost constraints on migration, which could in turn reduce the average skill- and wealth-level of the migration flow (see Belot and Hatton Reference Belot and Hatton2012; McKenzie and Rapoport Reference McKenzie and Rapoport2010; Spitzer and Zimran Reference Spitzer and Zimran2018; Wegge Reference Wegge2008). In Table 6, I test these propositions across origin communities by interacting the key economic indicators of selection with the name-based measure of network strength for the rural subsample.
NETWORK INTERACTION EFFECTS AND EMIGRATION FROM RURAL AREAS TO THE UNITED STATES 1901–1911

Standard errors in parentheses. Significance levels: * p < 0.10, ** p < 0.05, *** p < 0.01
Notes: This sample is confined to sons aged 6–18 and living in a rural area in 1901. In this sample, occupation and literacy are measured for the fathers of the individuals in the sample from the 1901 census. The outcome variable is whether an individual moved to the United States relative to all individuals in the sample who stayed in Ireland. I adjust the standard errors to account for the clustering of observations across PLUs (e.g., Moulton Reference Moulton1990). The baseline probability of emigration for this sample is 0.047 (C1–C5).
Source: Author’s calculations using linked census data.
Columns 1 and 2 begin by testing for heterogeneity in selection by interacting fathers’ literacy and occupation with network strength. In both cases, network strength has a strong positive main effect, suggesting that networks were associated with higher rates of emigration. There are, however, also strong negative interactions for the sons of men who can read and write or who hold highly-skilled occupations, suggesting that the effect of networks in promoting emigration was relatively weaker for sons from more literate and non-farming households. That is, the sons of less skilled men are relatively more likely to leave communities with stronger migrant networks.
Does the variation in migrant selection with network strength reflect the alleviation of cost constraints? Column 3 tests this interpretation by interacting land value with network strength to check whether networks are associated with heightened emigration from less productive (or poorer) communities. In this regression, the main effect for land value is negative, as is the interaction between land value and network strength, implying that emigration is lower from more productive communities, with the effect of networks on emigration being relatively weaker in these contexts. Thus, consistent with hypotheses that networks eased cost constraints, networks appear to matter most for emigration from communities with fewer economic resources. These results strengthen in more saturated models (Column 4) and are robust to a suite of control variables (Column 5).
Birth Order and Land
The high rate of emigration among the sons of landholding farmers contrasts with historical findings from Norway showing that land acquisition opportunities discourage migration (Abramitzky, Boustan, and Eriksson Reference Abramitzky, Boustan and Eriksson2013). Due to traditional customs and the imposition of different inheritance laws on Catholics and non-Catholics, Ireland has a complicated history with respect to inheritance.Footnote 31 We know that while Ireland did not have a rigid system of primogeniture (first-born inheritance) in the early twentieth century, it was not typical to heavily subdivide land among heirs, with middle sons also being less likely to be the sole inheritors (Guinnane Reference Guinnane1997; Ó Gráda Reference Ó Gráda1980). I exploit these inheritance practices as a means of understanding whether land inheritance—as implied by birth order—affected emigration decisions.
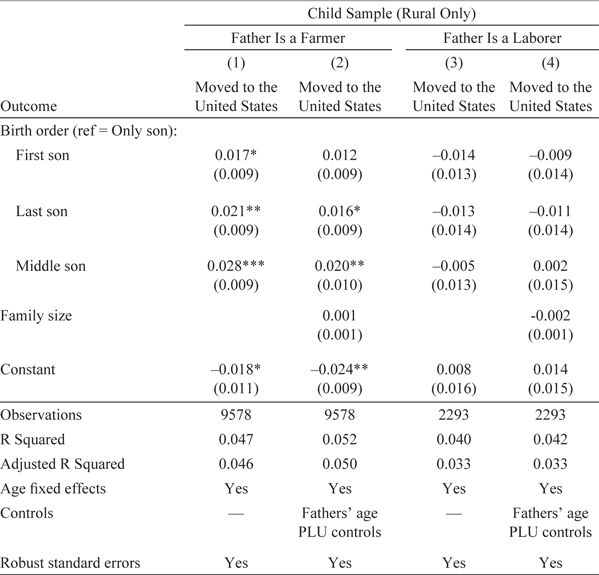
In Table 7, I test the association between emigration and birth order across households headed by farmers (Column 1 and 2) and landless laborers (Column 3 and 4). The estimates in Column 1 show middle sons in farming households to be 2.8 percentage points more likely to emigrate than the only sons of farmers. The middle sons of farmers are also up to 1 percentage point more likely to emigrate than their first- and last-born counterparts, suggesting that sons less likely to inherit land were more likely to emigrate.Footnote 32 There may be concern that emigration and birth order are correlated because families were larger in emigration-prone areas (Fernihough Reference Fernihough2017). Column 2, however, shows these birth order correlations to be robust to family size and other controls.
BIRTH ORDER IN FARMING AND LABORING HOUSEHOLDS AND EMIGRATION TO THE UNITED STATES 1901–1911

Standard errors in parentheses. Significance levels: * p < 0.10, ** p < 0.05, *** p < 0.01
Notes: This sample is confined to sons aged 6–18 and living in a rural area in 1901. The sample is split between households headed by laboring or farming fathers. The measures of birth order and family size are measured by examining the sibling composition of the households in the 1901 census. The PLU controls refer to the measures of network strength, land value, and inequality in landholdings used above. The outcome variable is whether an individual moved to the United States relative to all individuals in the sample who stayed in Ireland. The baseline probabilities of emigration for these samples are 0.052 (C1–C2) and 0.035 (C3–C4).
Source: Author’s calculations using linked census data.
The study of birth order and emigration within rural laboring families provides further insight. Column 3 shows no significant birth order association with emigration within households headed by landless laborers, and this result persists after adding control variables (Column 4). The most likely explanation for the absence of birth order effects in laboring households is that in these families, birth order position did not seriously impact the probability of a son acquiring land through inheritance. Thus, the results from both farming and laboring families indicate that it was the non-inheriting sons of farmers who were most likely to emigrate. My conclusions, therefore, support prior work showing that land acquisition opportunities discouraged migration.
INTERPRETTING MIGRANT SELECTION FROM IRELAND
How do these findings from Ireland square with theoretical models of selection? The dominant economic selection framework is George J. Borjas’ (Reference Borjas1987) interpretation of the Roy model (Roy Reference Roy1951), which can generate predictions of selection by comparing earnings inequality across countries. These models assume that migrants have two choices—stay in the home country or move abroad—and they then compare the relative returns to skill in each place, generating predictions of either negative or positive selection from the source population. Recent historical findings of negative selection into emigration from Norway and positive selection from Italy are consistent with these predictions (Abramitzky, Boustan, and Eriksson Reference Abramitzky, Boustan and Eriksson2012; Spitzer and Zimran Reference Spitzer and Zimran2018).
Although my data do not allow for a strong test of the Roy model, they do provide valuable theoretical insights. As the Irish economy was more unequal in how it rewarded skill than that of the United States (Begley, Geary, and Stark Reference Begley, Geary and Stark2016; Boyer, Hatton, and O’Rourke Reference Boyer, Hatton, O’Rourke, Hatton and Williamson1994), the Roy model would predict emigrants to be lower skilled than non-migrants. This hypothesis is generally supported by the finding that emigrants and their fathers were more likely to be illiterate and lower skilled than their counterparts staying in Ireland. Ireland’s retention of higher-skilled workers is also consistent with the high demand for skill in Irish towns and cities (O’Malley Reference O’Malley1981). Thus, the negative selection prediction from the Roy model is tentatively supported by these findings from Ireland.
What is perhaps most notable about Irish emigration, however, is that it does not smoothly conform to an interpretation of positive or negative selection. Emigration drew heavily from poorer agricultural communities in the west of Ireland, where illiteracy was higher and emigrant networks were stronger, but much less so from urban areas and eastern counties which also had large laboring populations. These western communities had more pronounced recent histories of emigration to the United States, and these experiences are partly captured by the network variable. Overall, these findings suggest that regional and community differences played a key role in influencing who emigrated, and whether migrants were of farming origin. It is also plausible that emigration from eastern counties was directed more toward England, and this flow is not captured in this analysis. Overall, the Irish case supports predictions of migrant selection based on economic theory, but also underscores the importance of geography and community context in affecting migration decisions.
CONCLUSION
The emigration of more than four million people from Ireland transformed the economic and social fabric of the United States. While Irish emigration fed the growing labor markets of the New World, Irish government leaders and officials frequently claimed that the economic development of Ireland was being curtailed by the emigration of highly-skilled men. Focusing on the tail end of mass Irish emigration across the Atlantic, I undertake the first micro-analysis of how Irish emigrants in the early twentieth century compared to the people they left behind. My main finding—that emigrants were drawn from households headed by farmers and less literate men in low productivity agricultural communities—is, therefore, at odds with claims that Ireland was losing its “best men” to emigration (Royal Commission on Labour 1893, p. 49).
My findings underscore the role of origin communities in shaping national-scale patterns of migrant selection. Building on recent work in economic history showing differences in self-selection across migrant-sending regions (Spitzer and Zimran Reference Spitzer and Zimran2018), I find that by influencing the migration decisions of individuals with different attributes, origin communities shaped the composition of the emigrant flow. While emigrants were most likely to leave low productivity farming communities with strong emigrant networks, opportunities in Ireland also reduced high-skilled emigration. Thus, while wage differences between Ireland and the United States undoubtedly affected emigration decisions, one cannot downplay origin community conditions in affecting who decided to leave the island.
These findings have implications for both Ireland’s economic development and Irish assimilation in the United States. First, my finding that lower-skilled men were overrepresented in the emigration flow supports claims that mass emigration boosted average real wages in post-famine Ireland (Begley, Geary, and Stark Reference Begley, Geary and Stark2016; O’Rourke and Williamson Reference O’Rourke and Williamson1997). If this is correct, emigration may have been a veritable win-win for the economies of Ireland and the United States. With this said, persistently high rates of lower-skilled Irish immigration also likely increased competition and depressed wages for unskilled workers in the United States. Second, it is claimed that the personal characteristics brought by Irish immigrants (and others) to the United States shaped their subsequent economic outcomes (Borjas Reference Borjas1994, Reference Borjas2014). While Irish Americans did experience high rates of upward mobility in the early twentieth century, my results indicate that the Irish were not likely to have been highly advantaged in their backgrounds.Footnote 33 Thus, my findings indirectly contribute to growing evidence that factors other than pre-migration skill drive post-migration outcomes (e.g., Alexander and Ward Reference Ward2018; Catron Reference Catron2017; Connor Reference Connor2018b; Ferrie Reference Ferrie1994).
Finally, this study illustrates the new possibilities for studying migrant selection in historical context. As concerns around the quantity and quality of immigrants continue to gain salience in the current political climate, we still have much to learn about how individuals self-select into emigration and of the interacting components affecting patterns of migrant selection within and across countries. Although there are major constraints on breaking ground in these areas for contemporary migration flows, rapid innovations in historical data and computation provide a handsome opportunity to understand these key economic and social science issues.