1. Introduction
First published in 1911, The American Economic Review (AER) stands as one of the most prestigious journals in the field of economics. Thousands of articles published over the last 117 years raises a question of design: How have economists used graphs to help visualize their arguments? What kinds of graphs do they use and are those graphs of high quality? Here, I collect, catalog, and rate every graph – more than 2600 in total – in the first volume of the AER in each year from 1911 to 2017.
Data visualization – the act of effectively visualizing data to help communicate data, analysis, or an argument – has always been part of the economists’ toolbox. Whether as part of the data exploration phase to better understand the underlying data or the structural model, the graph or chart inserted in the working paper or journal article, or as part of a conference presentation, graphs provide evidence or reinforce a point or argument. In his book Brain Rules, developmental molecular biologist John Medina writes that “The more visual an input becomes, the more likely it is to be recognized and recalled.” In other words, visuals help make a hypothesis, argument, or result stick in the readers’, users’, or audience members’ minds.
There is a balance between the benefits and costs of creating better, more visual ways to present information. On the one hand, creating more effective visualizations takes time, effort, and an understanding of other fields such as design. On the other hand, better data visualizations can improve engagement and interest in every research topic. We are inherently visual creatures and effective visual content helps engage readers and absorb information (Medina, Reference Medina2011; Mason, Reference Mason2019). Ibrahim et al. (Reference Ibrahim, Lillemoe, Klingensmith and Dimick2017), for example, found that journal articles in the Annals of Surgery that included a “visual abstract” (“a visual representation of the key findings typically found in the abstract portion of an article”) dramatically increased social media impressions. Creating visual content – and moving beyond the standard line, bar, and pie charts (Schwabish, Reference Schwabish2021) – can help research reach wider audiences, help people find insights, and make discoveries.
2. A short history of data visualization in the AER
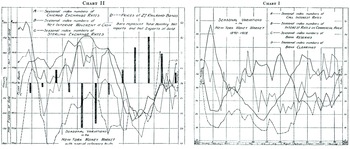
The first graph published in the March volume of the AER was “Chart 1” from E.W. Kemmerer’s Reference Kemmerer1911 article, “Seasonal Variations in the New York Money Market 1890–1908” (Figure 1). A simple line chart shows changes in interest rates, bank reserves, and bank clearings during that period, to which Kemmerer remarks, “The best criterion of deposit currency is found in bank clearings, and the seasonal variations in New York clearings for the period 1890–1908 are given in the table (opposite p. 40) and shown in Chart 1 (curve D). A glance at these figures and at the corresponding curve shows that the season swings of bank clearings in New York City confirm fairly closely to the five seasonal swings which we have found for the New York money market.” Well before the invention of Microsoft Excel, Stata, or even computers, Kemmerer was plotting multiple data series and writing the labels, legends, and titles by hand.
Chart 1 from Kemmerer (Reference Kemmerer1911).

Margo (Reference Margo2011) describes the history of the AER, so I leave the details to the interested reader, but three items in that account are perhaps of particular interest to this paper. First, 1968 was the last year in which the AER published book reviews – the last volume in 1968 was 1523 pages, nearly 500 pages more than the first volume in 1969 without book reviews. On the whole, book reviews tend to not include graphs or figures, which will certainly affect the graph and table counts presented below. Second, the parent organization of the AER, the American Economic Association (AEA), developed new journals over the past 100 years, that served to change the types of papers submitted (and ultimately published) to the journal. This might also impact the types and quality of graphs published in the AER over time.
Finally, the number of submitted papers to the AER grew swiftly in the 1950s and 1960s. There were about 200 papers submitted to the AER in 1950, which rose to 637 in 1968. During the early 1970s, the number of submitted papers declined slightly, likely because of the introduction of new journals. Submissions then climbed in the early 1980s before leveling off until about 2000 when they again increased sharply. The average number of papers published remained roughly constant (around 50) throughout the entire period.
The average page length of articles also increased over this latter period, rising from 12.6 pages in 1970 to 16.6 in 1990 to 22.0 in 2005. These trends are all consistent with the larger field of economics publishing, as documented by Card and DellaVigna (Reference Card and DellaVigna2013), who, incidentally, also find that the share of top-5 publications appearing in the AER rose from 25% in the 1970s to 40% in the early-2010s. None of the patterns in the AER would lead to any specific conclusion regarding the number, type, or quality of data visualizations published in the AER, but these time trends could affect any of these patterns.
3. Method
The task of collecting, categorizing, and rating AER visualizations requires creating a database of all graphs and tables in the AER and then using workers in Amazon’s Mechanical Turk (MTurk) to categorize and rate the graphs.
3.1 Step 1: collect AER graphs and tables
In the first step, I collected screenshots of every graph and table in the AER in the first AER volume from 1911 to 2017 (the first volume was issued in March until 2011 when it changed to February). I found a freelancer using the Upwork platform (www.upwork.com) to collect screenshots of each image and catalog the citation data (financial support was provided by my independent consulting firm, PolicyViz). Every journal article – whether it had a graph/table or not – was entered into a database with the author(s) name(s), title, issue number, volume number, JSTOR URL, year, page numbers, article number (article number being a number we assigned as the article’s position in the volume), and the total number of graphs and tables. Screenshots of each exhibit were taken and saved.
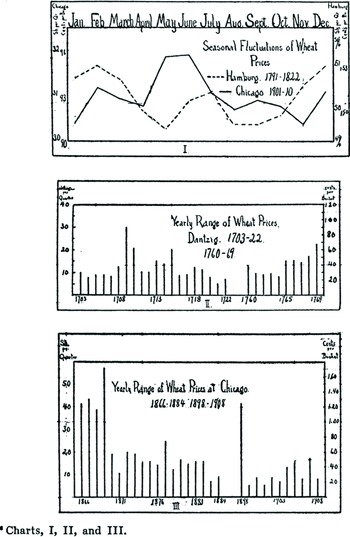
The question of what to do with separate charts that are paired together was something I tried to handle consistently. Graphs that appeared on the same page and that were named with a single title I considered a single visualization. As shown in Figure 2, Charts 1–3 in Usher’s Reference Usher1916 paper all appear on the same page, but have the same title, so they are treated as one image. Graphs that appeared on the same page but were named separately were considered separate visualizations. Kemmerer’s charts above appeared on the same page in his 1911 article, but they are named separately; for purposes of this study, these are considered separate charts.
Charts 1–3 in Usher (Reference Usher1916).

I also chose figures based on their name – “Charts” and “Figures” were collected in this data set, even if an exhibit might arguably be considered a table. For example, Figure 3 shows an image from Aumann and Dreze’s (Reference Aumann and Dreze2008) paper is labeled “Figure 5” but is arguably a table.
“Figure 5” from Aumann and Dreze (Reference Aumann and Dreze2008).

Turker Instructions. First Graph: Bronfenbrenner (Reference Bronfenbrenner1947) and Second Graph: Heckman and Payner (Reference Heckman and Payner1989).

AER editors and average pages per year.
Notes: Height of bars represent average number of pages during each editors tenure; width of bar represents time span of each editor. Esther Duflo is the current editor of the AER, but the data set used here extends through 2017. Source: Author’s calculations and Margo (Reference Margo2011).

3.2 Step 2: categorize the graphs using Amazon’s Mechanical Turk
In the second step, I used the Amazon Mechanical Turk (MTurk) to categorize and rate each graph. The MTurk is a holding of Amazon Web Services and owned by Amazon. It is a crowdsourcing marketplace for “for work that requires human intelligence.” In MTurk, individuals and businesses – known as Requesters – can request small tasks from workers, who are known as Turkers. Such tasks might include categorization, data verification, photo moderation, tagging, transcription, or translation. Requesters submit their jobs with a price per unit (whatever unit they choose), which Turkers may or may not accept. A job on MTurk is known as a Human Intelligence Task, or HIT, and by definition is a “single, self-contained task that a Worker can work on, submit an answer, and collect a reward for completing” (Amazon 2018).
There is an existing literature about the accuracy of MTurk and the characteristics of Turkers. Mason and Suri (Reference Mason and Suri2012) collected demographic information for nearly 3000 different Turkers and found that of those who chose to report their gender, about 55% were women. The median reported age in their sample was 30 years old and the average 32 years old. The majority of Turkers in the study reported earning roughly $30,000 per year. Ipeirotis (Reference Ipeirotis2010) found that about 12% of US Turkers and 27% of Indian Turkers reported that the earnings from the Turk was their primary source of income, and roughly 30% of each group was unemployed or working part-time.
Many other researchers in the data visualization and computer science fields have used MTurk to rate or review data visualizations. Heer and Bostock (Reference Heer and Bostock2010), for example, used it to replicate previous laboratory studies on the accuracy of different data encodings such as length (bar charts), angle (pie charts), and area (bubble charts). Harrison et al. (Reference Harrison, Yang, Franconeri and Chang2014) tested perceptions of correlation by asking Turkers to identify graphs that plot higher levels of correlation across nine different chart types. Other researchers have tested perceptions of pie charts (Skau & Kosara, Reference Skau and Kosara2016), memorability (Borkin et al., Reference Borkin, Vo, Bylinskii, Isola, Sunkavalli, Oliva and Pfister2013), and the impact of chart embellishment on understanding (Skau et al., Reference Skau, Harrison and Kosara2015). MTurk appears to be used far less frequently in the economics field, possibly because of the various sample and selection issues. However, given the potential to use the MTurk to enable economists to reach a large number of (digital) survey respondents, it may be a platform more researchers should consider.
Obviously, the MTurk is not without flaws. It is hard to know whether the Turker is actually answering the questions or simply checking a box quickly. Turkers are not in a controlled environment, as they might be in a laboratory. In some cases, votes can be “flooded” to skew the results in particular ways. And because I do not have any identifying information about the Turkers, I cannot be sure I have a representative sample to accomplish the tasks (see also Kosara & Ziemkiewicz, Reference Kosara and Ziemkiewicz2010). The results might differ if, say, PhD economists or data visualization specialists rated each graph (see Section 3.3).
The project was defined to have five different people rate each graph, but any single Turker could rate as many graphs as they like. Turkers were paid $0.03 per graph and the median amount of time to complete a HIT was about 17 seconds. Overall, 70 Turkers rated graphs with five Turkers rating 1400 or more graphs and 10 Turkers rating only one graph. Seven Turkers rated between 100 and 1000 graphs with the remainder (39 Turkers), rating between two and 100 graphs. The graphs are randomized so that Turkers see graphs in a random order.
The project description shown to Turkers as follows: “Categorize a graph (line, bar, column) and rate the quality of one graph. There are more than 2600 graphs available to rate.” Upon accepting the assignment, Turkers were presented with a bit of explanatory text (see Figure 4) and a link to a Google Doc (included in the Supplementary Material) that contained more details and examples.
Turkers were asked to answer the following three questions:
-
(i) Is this graph made with data or is it illustrating a concept or theory?
-
(a) Data
-
(b) Diagram or Illustration
-
-
(ii) What type of graph is this?
-
(a) Area
-
(b) Bar/Column
-
(c) Histogram
-
(d) Line
-
(e) Map
-
(f) Pie
-
(g) Scatterplot
-
(h) Table
Other (please type):
-
-
(iii) Please rate the quality of this visualization (1 = bad, 5 = great)
-
(a) 1
-
(b) 2
-
(c) 3
-
(d) 4
-
(e) 5
-
There was only one possible response for questions (i) and (iii). For question (ii), the Turker could enter an additional response in a box provided under the “Other” category. Some responses included in this category included “timeline,” “decision tree,” “Venn diagram,” and “contour plot.” These answers were corrected for spelling and capitalization in order to quantify the results.
Rating the quality of a visualization is inherently subjective. I gave the Turkers no other information except to note in the Google Doc that, “This is inherently a subjective question, so make your best judgment based on your perception of the visual.” Rating a graph is likely dependent upon the context of the visuals and whether the reviewer has any background or interest in the topic.
3.3 Additional caveats
Although rerunning any survey might ultimately generate different findings (McGovern & Bushery, Reference McGovern and Bushery1999), this might be especially true with the Mechanical Turk. With more or fewer Turkers rating and reviewing each graph, the overall pattern might change. It is also the case that not providing raters with the context behind the graph – that is, the rest of the journal article – will likely affect their perception of the quality of the graphs (obviously, asking raters to read more than 700 articles is not feasible).
It is also the case that the Turkers may not have sufficient experience with graphs in economics or data visualization to accurately reflect their impact, accuracy, or usefulness. Extensions to this paper could include asking a set of economists to rate and review the graphs. Another avenue for study could be to ask data visualization experts to rate and review the graphs; in that case, the expertise shifts from the content of the graphs to the quality of the graphs themselves.
4. Changes in the number of graphs and pages since 1911
There are more than 2600 graphs (plus more than 3500 tables) in the first volume of the AER from 1911 and 2017 (across 740 different articles). AER issues are 303 pages in length, on average, not including pages with roman numerals. As Margo (Reference Margo2011) noted, the length of the AER has grown over time, rather more quickly after about 1963 (see also Card & DellaVigna, Reference Card and DellaVigna2013). The first volume in each year more or less mirrors that trend, though the acceleration really started in the 1980s, but noticeably fell in the last few years (volumes in 1965, 1966, and 1972 combined the first two issues of the year, so although the graphs were collected from the second issue, they were ultimately dropped from the analysis). Figure 5 shows when each of the AER editors managed the journal; the width of the bars shows the average number of pages per year during each editor’s tenure.
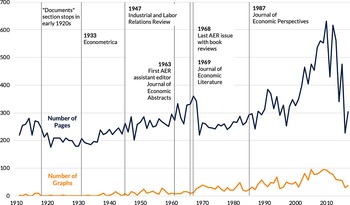
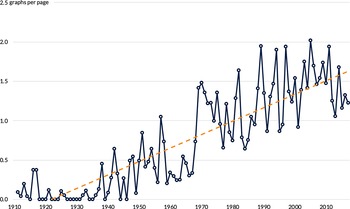
The number of graphs mirrors the number of pages, starting to rise in the late 1930s and reaching a high of 96 graphs in the 2004 and 2009 issues (Figure 6). On a per page basis, there is a similar mostly upward trend; since 2000, there have been about 1–2 graphs for every 10 article pages, or about 3 graphs per article (Figure 7).
The number of graphs and pages in the AER increased starting in the 1980s.
Source: Author’s calculations and Margo (Reference Margo2011).

The number of graphs per page has risen fairly steadily since 1911 (number of graphs per 10 article pages).
Note: Linear fit in orange.

5. Categorizing graphs: diagram/illustration or data?
Graphs do not necessarily need to include data – schematic diagrams, supply-and-demand curves, and utility curves are just some of the visuals economists use to explain economic concepts without explicitly using data. To explore how often economists use these different types of graphs, I asked the Turkers to place graphs into two categories: Is the graph made with data or is it a diagram or illustration of a theory or concept?
My initial hypothesis was that, over time, there would be a decline in the share of graphs that are considered a conceptual illustration or diagram and, as computers were invented and grew more powerful and sophisticated, would be replaced with more graphs encoded with data. The results of the MTurk survey yields a slightly more nuanced pattern (see Figure 8). In the early part of the 20th century – up until about 1950 or so – a higher proportion of graphs in the AER were encoded with data (see the Kemmerer graphs above as an example). Then, between roughly the 1960s and early 1990s, a majority of graphs in each year were categorized as diagrams or illustrations. Over the next couple of decades, the share changes again moving toward more graphs encoded with data (except for a dip around 2000); by 2017, around 70% of graphs are categorized as graphs with data and the remainder categorized as diagrams or illustrations.
About three-quarters of graphs in recent AERs are encoded with data.
Note: Average responses across all graphs in each year. Orange dotted line is a LOWESS curve.

The share of Turkers categorizing graphs as being made with data is calculated as the (unweighted) share of all responses in each year. An alternative approach, in which I first classify each graph to be a diagram/illustration or data based on the majority response of the five Turkers, and then calculate the average based on that single aggregate measure yielded similar results (I prepared different calculations in cases where three people categorized the graph as one type). In general, four or five Turkers agreed on about 70% of the more than 2600 graphs under review.
6. Categorizing the type of graphs
Moving on from whether a graph is a diagram/illustration or encoded with data, the next task is to see what types of graphs economists use. There are virtually unlimited ways to visualize data, ranging from the familiar line, bar, and pie charts to more unfamiliar plot types like network diagrams, slope charts, and dot plots. For purposes of this experiment, I provided the Turkers with a basic library of graphic types from which they could choose (see question (ii) above).
The overwhelmingly most used graph type in the AER is the line chart (Figure 9). Line charts account for more than 80% of all graphs in the AER over the entire 1911–2017 period. They are used for diagrams, such as supply-and-demand curves, sketched probability distributions, and plotting time series data. The second-most popular graph type over the entire period is the scatterplot, which accounts for 5.7% of all graphs, followed by the bar chart (3.3%) and tables (2.1%).
Economists overwhelmingly use line charts in the AER (number of graphs of each type in each year of the AER).
Note: 20 different graphs are plotted, but only the four most common over the entire period are labeled. For other graph types, see text.

For these tabulations, I calculate the mode response for each graph type (breaking ties by using the maximum) and then sum the totals in each year. This calculation differs from the previous calculation of diagram-data graph type in that, here, I calculate responses for each graph rather than averaging across all graphs in each year. The reason for using the alternative definition above is that in years with few graphs, the mode response can appear to be 100% for one graph or another when in truth there is some disagreement between Turkers.
Perhaps unsurprisingly, the share of graphs that are lines has fallen over time, likely because other graphs have become more popular, more common, and easier to create. Between 1911 and 1990, 92% of graphs were classified as line charts; over the next 28 years, 75% of graphs were classified as line charts (see Figure 10).
The share of graphs classified as line charts has fallen in recent years (percent of line charts in each year).

7. Ranking graph quality
Rating a data visualization is inherently subjective. Chart type, colors, line width, font, annotation, and content can all shape a person’s view of a visualization and its content (Kong et al., Reference Kong, Liu and Karahalios2018). Furthermore, because any individual Turker may not be familiar with economic data or diagram types (supply-and-demand), some graphs may be intuitively preferred over others. Because it may also be the case that Turkers are younger on average, there may be some preference toward graphs that appear to be made in modern software tools such as Stata, R, or Microsoft Excel.
Overall, ratings follow a U-shaped pattern, declining between 1911 and around 1960, and then increasing through the end of the period (see Figure 11). There are a few aberrations from this overall pattern, with a sharp drop in 2001–2004 before increasing over the past decade or so. Certain issues in the 1930s had the highest ratings (4.3 in 1933 and 4.2 in 1936) while the fourth issue (1914) with only one graph had the lowest average rating (2.6), followed by a 3.2 rating in 1971. The pattern does not appear to correlate strongly with changes in common software tools such as Excel, SPSS, Stata, or SAS or with changes in the journal, such as editors, page length, or other journals (see the annotations in Figure 6).
Average graph ranks fell to a low in the 1960s and then increased through 2017 (ranking).
Note: Height of bars represent total number of responses for each rating for all graphs in each year; dots represent average rating in each year. Missing data points reflect no graphs in those years.

Figure 11 shows the number of ratings in each year at each option (1 = bad, 5 = great) with the overall height of each segment representing the total number of ratings. In other words, the increase in the orange segment at the top of the graph starting around 2009 is the increase in the total number of ratings equal to five. The black, thicker line represents the average rating in each year (with a LOWESS curve fitted on top). (These percentages are tabulated using the mode of the five answers to each graph. In cases of ties – about 30% of the sample – the higher mode value was used; using the smaller mode did not substantively change the results.)
The pattern of graph ratings is, however, correlated with categorizations of data-diagram graph types. Over the entire period, the correlation coefficient between the graph quality ratings and the share of graphs classified as made with data is 0.62. Figure 12 shows this positive correlation with the average rating (calculated across all graphs in each year) on the horizontal axis and the diagram-data graph categorization (also calculated across all graphs in each year) on the vertical axis (the size of the bubbles indicates the number of graphs in each year).
Higher ratings and data graphs are positive correlated.

Reflecting these patterns, the relationship between the two variables has changed over time. Figure 13, what is known as a “connected scatterplot,” shows the change in the correlations over time (bubbles are sized according to the number of graphs in each decade). The horizontal axis shows the average rating (calculated for each decade) and the vertical axis shows the diagram-data graph type (again calculated by decade). For the 1930s, 1940s, 1950s, and 1960s decades, average ratings and the probability of being a diagram both decline; between the 1970s and 2010s, both rise.
The correlation between ratings and graph type changed around the 1970s.

8. Conclusion
The goal of this paper is to neither commend nor critique the quality or type of graphs published in the AER. Instead, the goal is to try to better understand the types of graphs economists use and the overall quality of those graphs. While there is certainly nothing inherently wrong with line charts, the finding that nearly 80% of all graphs are line charts begs the question of whether there are more and different graph types economists might use to visually communicate their work. The U-shaped pattern in the type of graph – be it a diagram or encoded with data – may be a useful marker of the development of the economics profession. The U-shaped pattern in graph quality could be a true measure of graph quality or may simply be correlated with Turkers’ preferences for data-driven graphs or inexperience reading economics graphs.
There are a variety of ways this research might be extended. Graphs could be rated by trained economists, which would help focus the analysis more on the content or graphs could be rated by data visualization experts, which would focus the analysis on the quality of the graphs. Graphs in other journals or even other fields could be explored as well. In any case, this paper is meant to be a potential beginning in exploring the visual history of the field of economics.
Acknowledgements
The author appreciates discussions and feedback from L. Harrison and R. Kosara.
Supplementary Materials
To view supplementary material for this article, please visit http://doi.org/10.1017/bca.2021.17.