1. Introduction
Solar photovoltaic (PV) generation has grown significantly over the past decade due to climate change concerns and the transition to renewable energy. It has been estimated that solar PV could cover a quarter of global electricity demand by 2050 (IRENA, 2019). The utilization of abundant, inexhaustible and widely distributed solar energy not only reduces carbon emissions and environmental pollution (Chen and Chen, Reference Chen and Chen2021) but also has the potential to improve livelihoods of people who suffer from both economic and energy poverty (Li et al., Reference Li, Gong and Chen2019). For example, households’ revenue can be directly boosted via generating electricity for self-use or selling to the national grid through rooftop solar PV. PV-generated electricity also facilitates farmers’ better access to mechanized equipment, thus increasing agricultural productivity and creating more leisure and educational opportunities (Burney et al., Reference Burney, Woltering, Burke, Naylor and Pasternak2010; Stojanovski et al., Reference Stojanovski, Thurber, Wolak, Muwowo and Harrison2021). As a booming renewable energy, PV power generation contributes to helping achieve the United Nations Sustainable Development Goals (SDGs) of ‘No poverty’, ‘Affordable and Clean Energy’, as well as Climate Action’.
China has been ahead of many other developing countries in terms of eradicating poverty. About 100 million people from 832 national-level poverty-stricken counties were lifted out of poverty between 2012 and 2020.Footnote 1 This enabled China to achieve the 2030 poverty reduction target identified by the SDGs 10 years ahead of schedule (China Daily, 2021). The PV poverty alleviation project (PPAP) was one of the 10 Targeted Poverty-alleviation Projects proposed by the Chinese government in 2014. It aimed to build PV power plants in rural areas to generate electricity, which would serve to combine renewable energy and poverty alleviation to achieve poverty reduction, clean energy transformation as well as rural revitalization in China. By building PV projects on free rooftops and vacant wasteland in rural areas, PPAPs can reactivate cheap production factors and increase the use value and productivity of these factor resources. Nevertheless, due to the remoteness, sparse population density and poor grid infrastructure (Liao and Fei, Reference Liao and Fei2019), only 2 per cent of China's household PV potential has been exploited (Chen and Chen, Reference Chen and Chen2021). The effectiveness and socio-economic impact of its implementation in vast impoverished areas has not yet been effectively evaluated.
The objective of this study is to explore the poverty alleviation experience of China's solar PV intervention programmes, aiming to provide useful lessons for other developing countries to achieve relevant poverty eradication and emission reduction goals. Specifically, we investigate the effectiveness of China’s PPAPs on the income level in rural China. Data from 249 counties that implemented PPAPs over the period 2008–2019 and from three batches of PV poverty-alleviation subsidy catalogues in around 1,000 counties of 26 provinces are used to answer two main questions. First, how large has the effect of PPAPs been on per capita income in rural China? Second, what are the costs and benefits of PPAPs?
This paper first uses a quasi-experiment design to explore the causal impact of PPAPs on rural per capita income with a series of robustness tests. Heterogeneity analysis is then carried out for eastern regions versus others, high-GDP regions versus low-GDP regions, counties with abundant sunlight hours versus others and counties where distributed PV predominates versus those where centralized PV predominates. The results indicate that the implementation of PPAPs on average increases the rural per capita income in China by around 5 per cent. This proportional effect is found to be larger in more economically developed areas, those with more sunlight hours and counties where installed centralized PV predominates. Finally, a cost–benefit analysis suggests that PPAP is an effective policy that can yield the rural household income of around 57,690 yuan over their life cycle. The implementation of PPAPs is also found to eliminate 22 million tons of carbon dioxide (CO2) per year.
As countries have increasingly used solar PV power generation as a tool to boost income,Footnote 2 research on the effect of solar PV power generation has started to appear. Some studies found that the relevant projects have a positive effect on improving income, such as in Bangladesh by increasing productivity and creating job opportunities (Meah and Ali, Reference Meah and Ali2019), and in Korea and the US by reducing energy costs for households (Qiu et al., Reference Qiu, Kahn and Xing2019; Lee and Shepley, Reference Lee and Shepley2020). On the contrary, some other studies have discovered limited or even no effects from solar PV power generation (Kudo et al., Reference Kudo, Shonchoy and Takahashi2019; Peters et al., Reference Peters, Sievert and Toman2019). These conflicting findings highlight the need for additional research to verify the benefits of solar PV power generation.
PPAP is a top-down poverty alleviation policy issued by the Chinese government, which aims to reduce poverty while pursuing renewable energy. Existing studies on the benefits of PV power generation mainly focus on household rooftop PV or case- and region-specific PV projects. Little empirical study has examined large-scale government-initiated PV-based poverty reduction campaigns. The Chinese central government has created a unique empirical environment by using incentives to advance solar PV initiatives aimed at reducing poverty. Yet, to date only a few studies have focused on the poverty alleviation experience of solar PV intervention in China. They have preliminarily found that PPAPs had a positive impact on increasing income or alleviating poverty, providing a certain basis for the current study (Liao and Fei, Reference Liao and Fei2019; Li et al., Reference Li, Wang, Cheng, Shuai, Shuai and Liu2020; Zhang et al., Reference Zhang, Wu, Qiu, Chan, Wang, Zhou and Ren2020).
The key contributions of this study are as follows. First, we investigate the largest PV manufacturer in the world and emphasize the economic effects of solar PV intervention in a rapidly growing economy. While existing studies have examined the socio-economic impacts of solar PV programmes, they largely focus on developed countries in North America and Europe (Crago and Chernyakhovskiy, Reference Crago and Chernyakhovskiy2017; Collier et al., Reference Collier, House, Connor and Harris2023), or find limited impacts in developing countries due to technical constraints or cost barriers (Grimm et al., Reference Grimm, Munyehirwe, Peters and Sievert2017; Nduka, Reference Nduka2023). Despite China's substantial expansion in PV production and deployment, rigorous empirical evidence on its economic impacts remains limited.
Second, it uses the most comprehensive dataset to date on this topic, to the best of our knowledge, covering the entire implementation period from project initiation to completion and incorporating detailed PV subsidy information. Since the implementation time of PPAPs varied across counties, it is useful to extend the dataset to capture more variations in both temporal and cross-sectional dimensions. The detailed dataset also allows us to examine the heterogeneous effects across economic level and sunlight hours, and to distinguish between distributed and centralized PV projects, thus offering new insights into their relative effectiveness and future development potential.
Third, this paper evaluates a huge nationwide government-led solar PV poverty alleviation programme at the county level. Unlike most existing studies that focus on home-scale off-grid electrification, or small-scale or region-specific PV projects (Fox, Reference Fox2023; Liu et al., Reference Liu, Chen, Zhao and Liao2023), our study broadens the scope to encompass a range of electricity sources, including solar home systems, village-level grids and large-scale centralized grid-connected projects. We adopt a staggered difference-in-differences (DID) framework with extensive robustness checks to provide a comprehensive assessment of the poverty alleviation effects of PPAPs.
Last but not least, this study is the first to conduct a nationwide cost–benefit analysis of PPAPs over the full implementation period. By jointly accounting for economic and environmental benefits, our analysis highlights the broader and longer-term returns of promoting solar PV development as an anti-poverty strategy in China.
2. Background
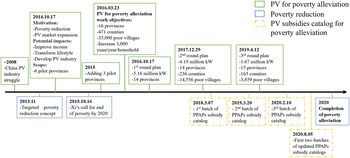
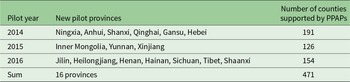
To better understand China's PPAPs, we present the broad socio-economic context since 2008 in Figure 1. In the last decade, China’s PV industry has made substantial progress (Xie et al., Reference Xie, Huang and Qin2018) and has been the largest PV manufacturer worldwide since 2013. The Chinese government started to combine PV power generation with poverty alleviation in 2014, carrying out PPAPs in some pilot counties of six provinces and autonomous regions (NEA of China, 2014). It aimed to carry out poverty alleviation projects in the PV power industry until 2020 to improve the living conditions of peasants. Three new pilot provinces were added in 2015 and another seven were added in 2016. These three rounds covered 471 key pilot counties in 16 provinces, as shown in Table 1.Footnote 3 In March 2016, the Chinese government formally proposed the goal of PPAPs, aiming at increasing per household income by at least 3,000 yuan per year for around 2 million rural households from 35,000 poor villages in these pilot counties by 2020 (NEA of China, 2016a). The operation process of PPAPs is shown in Figure A1 in the online appendix.
The background of China’s PPAPs.

Key pilot provinces that implemented PPAPs, 2014–2016

Source: Compiled by the authors based on official documents issued by the NEA of China.
Subsequently, three rounds of PV implementation plans were approved in October 2016 (NEA of China, 2016b), December 2017 (NEA of China, 2017) and April 2019 (NEA of China, 2019). The scale of these three batches of PPAPs was 5.16 million kW, 4.19 million kW and 1.67 million kW, covering 14, 14 and 15 provinces, respectively, as shown in Figure 1. Although some subsequent counties began to implement this policy after 2016, they were not specifically targeted at national poverty-stricken counties nor were there any explicit government-set poverty reduction targets. They mainly implemented PPAPs in a bottom-up manner rather than being government-designated, and there was no officially announced policy implementation timeline. The government identified only the initial 471 pilot counties across 16 provinces as ‘key PV poverty-alleviation counties’. Therefore, our empirical analysis focuses on these initial 471 pilot counties.
The rapid development of PPAPs resulted from deep subsidies and multiple other incentives. So far, the Chinese government has announced three batches of subsidy catalogues for PPAPs in 967 counties of 26 provinces and constructed 179,653 poverty-alleviation PV stations. They are supposed to generate 21.8 million kW of electricity, of which 14.1 million kW are utilized to alleviate poverty (MOF of China, 2020a, 2020b). These projects comprise four main types of power stations – household, village, joint-village and centralized PV – differing in scale, ownership structure and benefit allocation mechanisms (see appendix Table A1 for details). As shown in appendix Figure A2, the spatial distribution and structure of PPAPs exhibit pronounced regional heterogeneity, with large-scale centralized PV concentrated in south-western regions, joint-village stations prevailing in northern areas and household- and village-level systems more common in land-constrained central and eastern areas.
3. Methodology and data
3.1. Empirical method
To examine the causal effect of PPAPs on income, we employ a DID model to compare changes in income before and after PPAP participation with changes over the same period in control counties. Since the sample counties selected in this study began gradually implementing PPAPs in 2014, 2015 and 2016, we adopt a staggered DID model, which allows variation in treatment timing (Callaway and Sant'Anna, Reference Callaway and Sant'Anna2021; Athey and Imbens, Reference Athey and Imbens2022). The model is designed as follows:
 \begin{equation}ln{Y_{it}} = {\partial _i} + {\beta _T}Polic{y_{i,t}} + \gamma {X_{it}} + {\theta _i} + {\mu _t} + {\delta _{it}}\end{equation}
where  $ln{Y_{it}}$ is log real rural per capita disposable income in county i in year t;
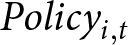 $Polic{y_{i,t}}$ is a dummy variable equal to 1 if county i implemented the PPAP in year t and 0 otherwise. It equates to an interaction term between a policy dummy for PPAP counties and a pilot year dummy that indicates post-pilot years. In the Tables 2 to 3 below we denote it using the term PPAPs implementation (dummy).
 ${\beta _T}$ estimates the average treatment effect of PPAPs.
 ${X_{it}}$ is a vector of potentially relevant variables, including the industrial structure, the fiscal expenditure-to-revenue ratio, the log sunlight hours, the log agricultural production of grain and the education level. Considering the potential non-independence of observations over time, standard errors are clustered at the county level.
 ${\text{ }}{\theta _i}$ and
 ${\mu _t}$ represent county-fixed effects and time-fixed effects, respectively. County-fixed effects are included to capture cross-sectional variations that do not change over time, such as the geographical location and land area of a county. Year-fixed effects control for factors that are common to all counties in each year, such as China’s economic situation.
 ${\delta _{it}}$ is an error term.
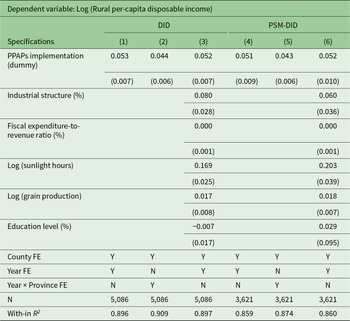
Basic results
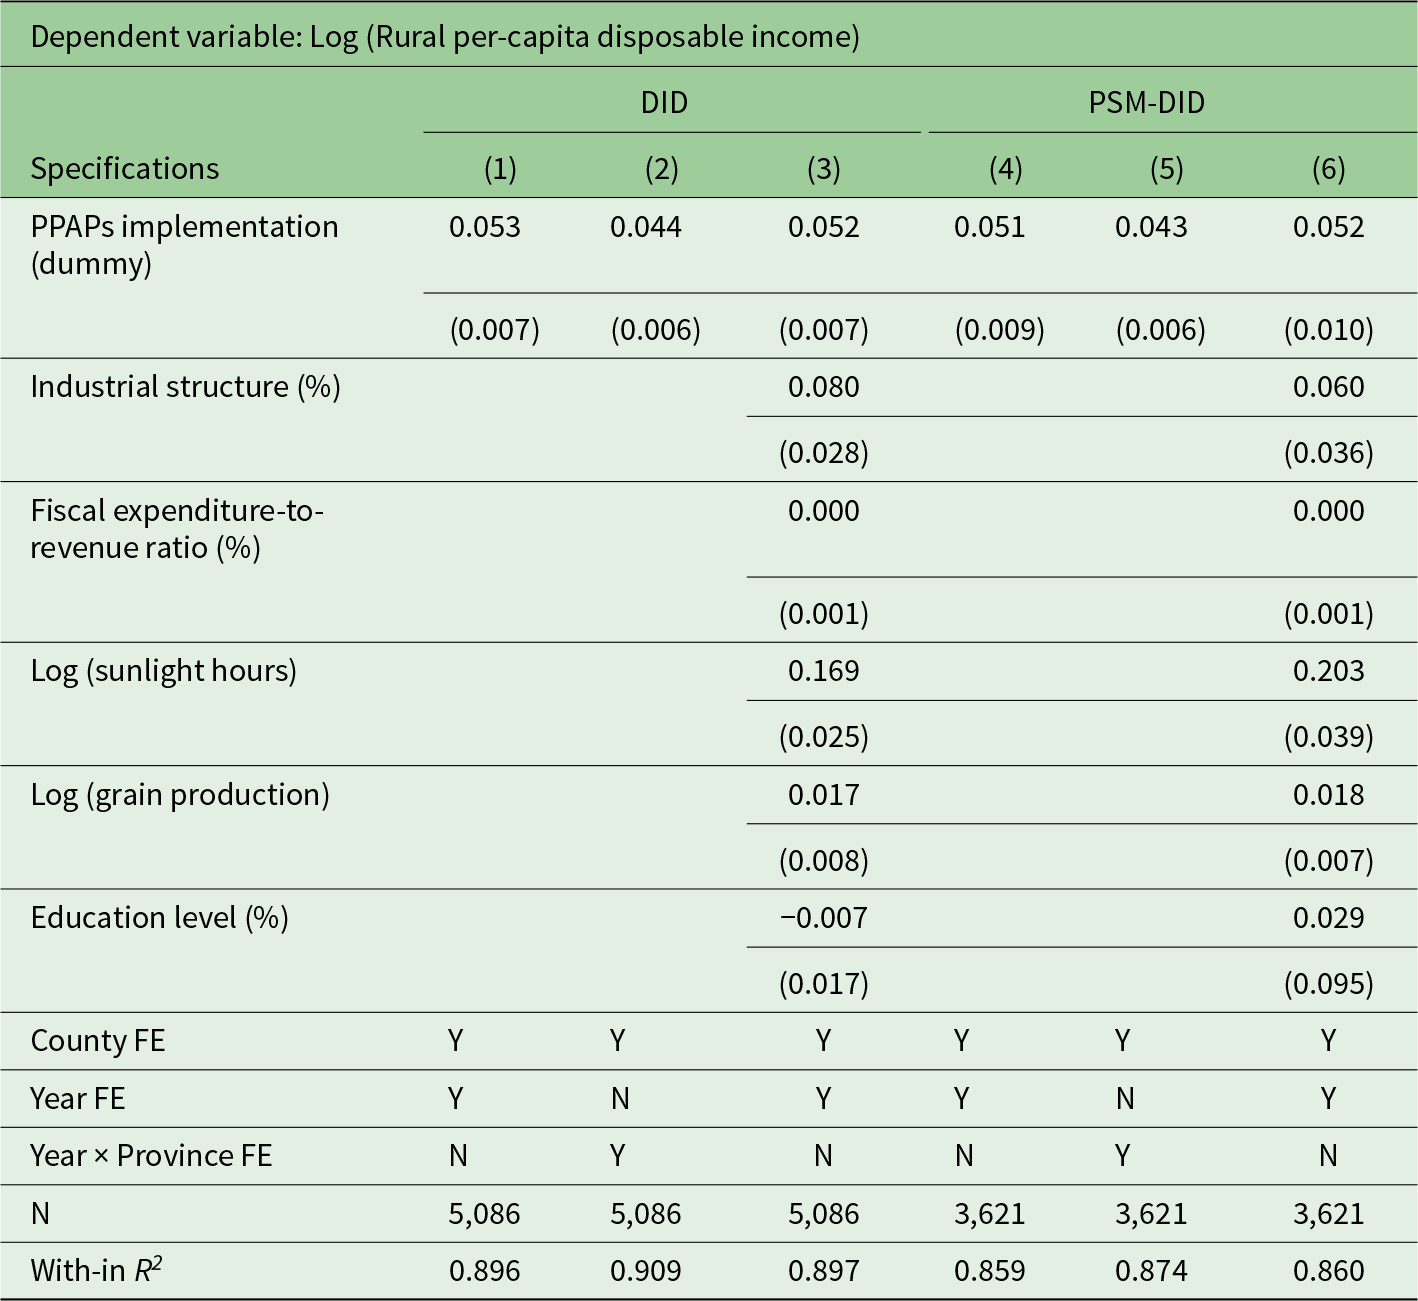
Note: Standard errors in parentheses are clustered at the county level.
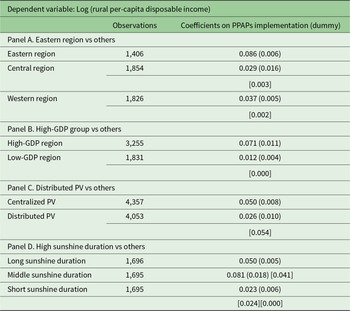
Heterogeneity analysis by county group
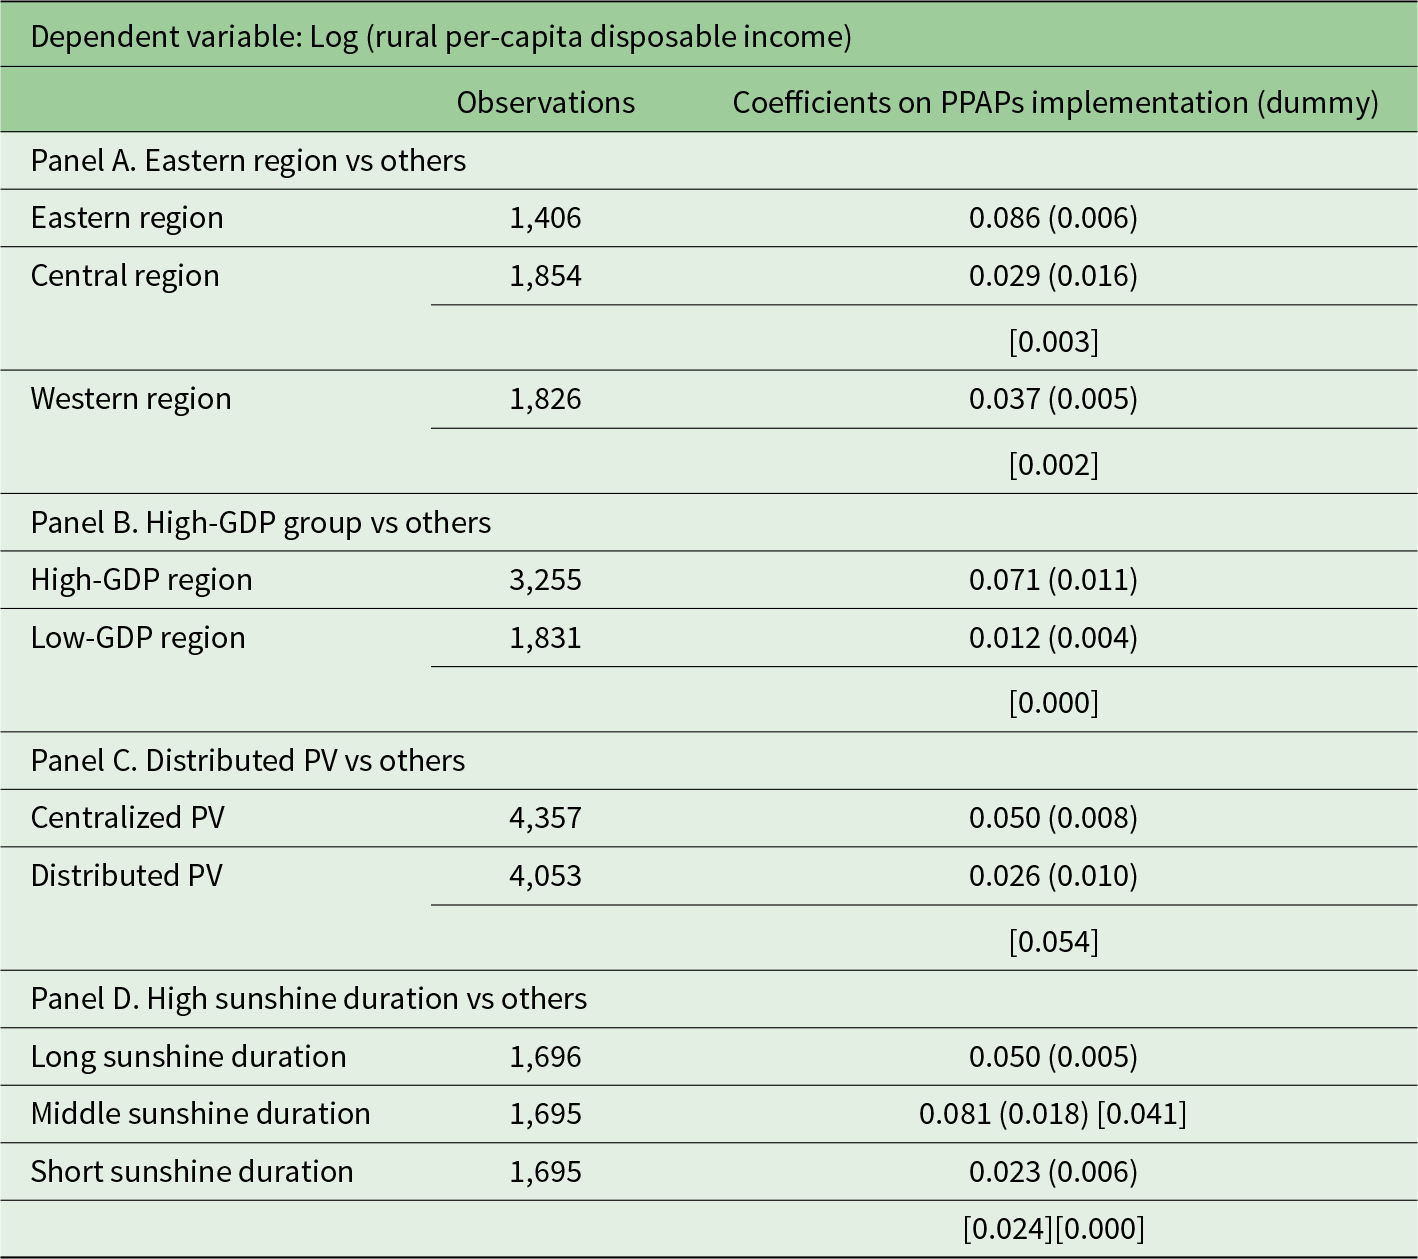
Notes: Each cell shows the implied coefficients for that category. Since PV types of Centralized PV and Distributed PV in Panel C are only distinguished in the treatment group, interaction terms for heterogeneity analysis are not applicable, so we use subgroup regressions for heterogeneity analysis in this table and conduct tests based on the seemingly unrelated regression for the subgroups to make them comparable. Figures in square brackets in panels A, B, C and D are p-values for tests of equality to the coefficients for the other groups in the same panel. Standard errors in parentheses are clustered at the county level.
One concern with regard to identifying the causal relationship between PPAPs and rural income is the potential non-random selection of pilot counties. Government officials decide whether to implement PPAPs according to pre-intervention characteristics. If initial differences among these counties are time-invariant, endogeneity concerns can be assuaged by introducing county-fixed effects, since they control for all the time-invariant determinants at the county level. In fact, the identification of PV poverty alleviation counties mainly takes into account economic conditions and sunlight duration (NEA of China, 2014). The sunlight duration is a purely exogenous factor and is less likely to cause selective bias. To address differences in county-level economic conditions, we incorporate the fiscal expenditure-to-revenue ratio as a control variable to reflect economic disparities. In robustness checks, we further include an interaction term between the fiscal expenditure-to-revenue ratio and time trends to capture the dynamic impact of economic conditions on income over time.
An alternative method of dealing with the potential non-random selection of PPAP counties is using the propensity score matching (PSM) method, which can address sample selection bias and overcome systematic differences between the treatment group and control group (Rosenbaum and Rubin, Reference Rosenbaum and Rubin1983). In practice, we adopt the identical set of county-level variables utilized in the baseline model and run logit regressions to select non-PV counties with the most similar probabilities as the control group. A more comparable control group is thus used to alleviate the selection problem to a large extent. However, considering that the PSM method reduces the sample size significantly and may be sensitive to the specific matching method and different parameter settings, we consider the initial DID method as the main specifications and use the PSM-DID as a robustness test.
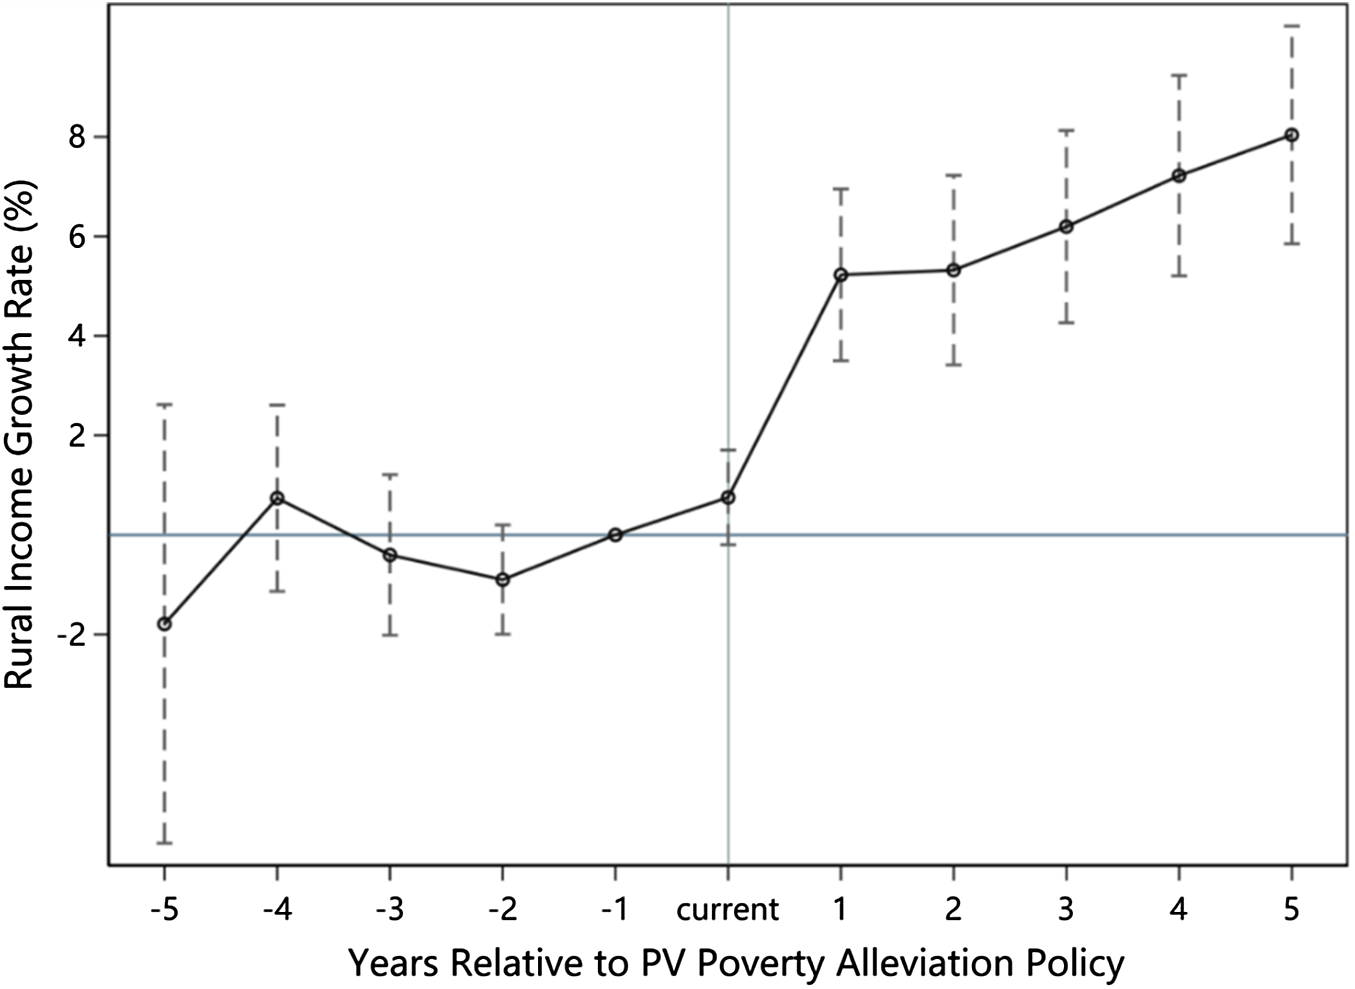
To capture the causal effects of PPAPs on income growth, the parallel trend assumption needs to be satisfied. This means that there is no significant difference in the income growth trends between the treatment group and the control group in years before the implementation of PPAPs and the policy impact only occurs after its implementation. We adopt the following event study method to test the parallel trend assumption. This specification allows the relationship between PPAPs and rural per capita disposable income to be heterogeneous over time.
 \begin{equation}ln{Y_{it}} = {\partial _i} + \mathop \sum \limits_{T = - M}^N {\beta _T}even{t_{i,t}} + \gamma {X_{it}} + {\theta _i} + {\mu _t} + {\delta _{it}}\end{equation}
where 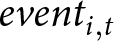 $even{t_{i,t}}$ is a dummy variable indicating a 10-year window around the implement year of PPAPs (i.e., from 5 years before to 5 years after). M and N represent the years before and after the policy intervention respectively. In the parallel trend charts, we use the pre-period to 1 year before PPAPs as the benchmark period. Thus,
 ${\beta _T}$ estimates the treatment effect of assigning a county to the treatment group years after the policy compared to the benchmark where T = −1. Other variables are defined the same as in Equation (1).
3.2. Data and summary statistics
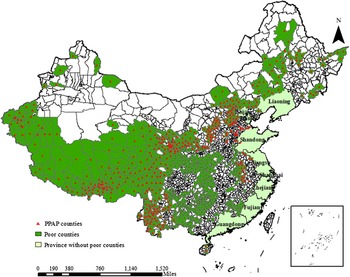
This study constructs a panel dataset from 2008 to 2019 at the county level. Specifically, the 471 pilot counties that implemented PPAPs in 16 provinces are set as the experimental group and the others in the same provinces as the control group. As some counties in western China did not publish indicators such as rural disposable income and GDP in their statistical yearbooks, we excluded counties with missing data on variables and retained 249 pilot counties as our experimental group. These 249 counties are representative as they are located in the eastern, central and western regions of China and account for more than half of the 471 key PV counties for poverty alleviation (see appendix Figure A3 for their location distribution). Hence, the experimental and control groups consist of 249 and 499 counties respectively. As shown in Figure 2, most of the counties implementing PPAPs are also national-level poverty-stricken counties and are mainly located in central and western regions. The eastern coastal provinces tend to be the most developed regions in China, such as Jiangsu, Zhejiang and Guangdong provinces, without any poor counties, and thus there are no PV poverty-alleviation pilot counties there.
Distribution of PPAP and poor counties in China.

All variables (except sunlight hours) were compiled from the China County Statistical Yearbook (NBS of China, 2020b) and the China Rural Statistical Yearbook (NBS of China, 2021). The dependent variable is the per capita disposable income of rural households in yuan, which is used to reflect the level of rural per capita income in a county. Although it is administrative data, it is obtained by sampling and stratified surveys of households in counties conducted by the National Bureau of Statistics of China, which is often more representative with more observations and provides benefits in terms of external validity and statistical power (Lee et al., Reference Lee, Miguel and Wolfram2020). The Consumer Price Index of rural residents for all goods in each province is used to adjust the income level to a 2000 price base.
The industrial structure refers to the share of value added in the secondary sector in the regional GDP. The fiscal expenditure-to-revenue ratio is calculated as the ratio of county-level public fiscal expenditure to its public fiscal revenue, which reflects the county’s fiscal pressure, the capacity for economic development and the ability of government intervention. The agricultural production of grain is the amount of grain produced in thousand tons in each county. The education level is represented by the proportion of local secondary school students to the total population. Sunlight hours refer to solar irradiation hours, which are originally derived from the 756 meteorological stations across China from the National Meteorological Science Data Center of China (NMSDC of China, 2020). The inverse distance weighting method is then used to match the solar irradiation data from meteorological stations to counties. The variables descriptive statistics and comparison between the treatment and the control group are shown in Panel A of Tables A2 and A3, respectively, in the appendix. The results in Table A3 show that the research design comparing PPAP counties to non-PPAP counties balances many observable covariates, once the key selection criteria in the county and average characteristics in the province are accounted for. In Section 4.1, we conduct a dynamic test and find that changes in rural per capita income of treatment counties and control counties present a similar time trend. This ensures that the parallel-trend assumption holds for our DID setting.
To calculate the costs and benefits of PPAPs, we obtain the three batches of PV subsidy catalogues from MOF of China (2020a, 2020b) and then match them with three types of solar resource areas (NEA of China, 2020a). Since the underlying datasets of subsidy catalogues are available at the village level, we collapse them to the county level. Statistical information is shown in Panel B of Table A2.
4. Results
4.1. Basic results
Table 2 shows our basic results. The coefficient of the PPAP policy dummy in column 1 only controls for county-fixed effects and year-fixed effects and is positive and statistically significant at the 1 per cent level. This suggests that the implementation of PPAPs increases rural per capita income of the pilot counties by 5.2 per cent on average, holding all other factors constant. Column (2) controls for county-fixed effects and province-by-year-fixed effects, which account for yearly changes in each province, such as poverty alleviation policies from the local provincial government. Year-fixed effects are redundant in this specification and thus dropped. Column (3) controls for a vector of additional variables. Both the coefficients in columns (2) and (3) on the PPAP dummy variable are similar to column (1). Most of the coefficients on other control variables are also statistically significant, indicating that the industrial structure, sunlight hours and grain production level have improved the income level in rural China.
Results using the PSM-DID method are reported in columns (4)–(6) of Table 2. We first adopt a calliper nearest neighbour PSM to match the experimental group with a similar control group using a matching ratio of 1:10.Footnote 4 After this matching, we conduct several data balancing tests between the treatment and control groups to verify the reliability of the matching results.Footnote 5 The results of these tests imply that the matching results using PSM balance the data well. We then run estimations using the same DID method as in Equation (1). The coefficients on policy dummy variable with and without controls across columns are significantly positive with similar magnitudes to the estimates based on the full sample. This indicates the basic results of our preferred specifications are robust. In appendix Table A4, we included the interaction term of the fiscal expenditure-to-revenue ratio with the time trend to capture the dynamic effect of economic conditions on income changes over time. The results also remain robust. These results indicate that our main findings are not affected by sample selection bias as analysed in Section 3.1.
Figure 3 shows the point estimates and their 95 per cent confidence intervals of the event study. The coefficients of PPAPs in previous periods are not statistically significant. This suggests that the rural income growth rate between the treated and control groups was on a parallel time trend before the implementation of PPAPs, indicating that the parallel trend assumption holds. In addition, from the year of implementation of PPAPs onward, the impact of PV policies on rural disposable income is significantly positive. The magnitude of the point estimates increases with time, indicating that the policy implementation has a cumulative and long-run effect on the rural per capita income.
Parallel trend test.

4.2. Robustness checks
Next, a series of robustness tests are conducted in appendix Table A5, including altering the control group, excluding other confounding observations, the Bacon decomposition, regressions with Driscoll and Kraay (Reference Driscoll and Kraay1998) standard errors, the permutation test (Fisher, Reference Fisher1936) and a placebo test. Overall, the results remain consistent with the baseline estimates in Table 2.
First, a potential concern regarding our identification strategy is the comparability between treatment and control groups. Some poor counties not implementing PPAPs may have adopted alternative poverty reduction policies, which could bias the estimates. To address this issue, Panel A of Table A5 replaces the original control group with non-poverty-stricken counties within the same province that did not implement PPAPs to make them more comparable.Footnote 6 The estimated effects remain positive and statistically significant, suggesting that the results are not sensitive to the choice of control group.
Second, the control group may be contaminated by counties that adopted PPAPs at later stages. While the treated group consists of the initial 471 key counties, other counties began implementing PPAPs after 2016. Building on recent advances in staggered DID methods (Callaway and Sant'Anna, Reference Callaway and Sant'Anna2021; Goodman-Bacon, Reference Goodman-Bacon2021), we implemented two refined control group specifications to strengthen causal identification. First, we excluded all PPAP counties other than the initial 471 key counties based on the list in the PV poverty alleviation subsidy catalogue, thereby constructing a pure control group of ‘Never Treated’ counties. Second, we adopted the ‘Not Yet Treated’ cohort, defined as counties that did not implement PPAPs during the pilot period but initiated the programme in subsequent years as an alternative control group. These methods help address selection bias through complementary counterfactuals and strengthen the causal inference of PPAPs on rural income growth. Crucially, the coefficients in Panels B and C of Table A5 confirm the robustness and temporal consistency of PPAP effects, affirming the programme’s causal impact on income growth.
Third, an additional concern is that the DID estimator with staggered adoption is likely to be biased. The essence of staggered DID with two-way fixed effects is variance-weighted averages of various ‘2 × 2’ DIDs (Goodman-Bacon, Reference Goodman-Bacon2021). When treatment timing varies, the dynamic effect estimates for one relative time period may be confounded by the causal effects of other relative-time periods (Sun and Abraham, Reference Sun and Abraham2021). We thus address this issue using a diagnostic test for Bacon decomposition, which allows the contribution of the ‘2 × 2’ DID estimates to be analysed against their weights (Goodman-Bacon, Reference Goodman-Bacon2021). In Panel D of Table A5, the findings reveal about 97 per cent of the estimates are obtained by comparing treated and untreated counties, with only 3 per cent capturing differences between time-varying treatments. The overall estimates of DID are similar to estimates between treated and never-treated counties, implying that multi-time treatment will not be an issue.
Lastly, we use Driscoll and Kraay (Reference Driscoll and Kraay1998) standard errors to correct possible geographical correlations of shocks from PV pro-poor interventions, which can modify the standard nonparametric time-series covariance matrix estimator to be robust to general forms of cross-sectional as well as temporal dependence. As reported in Panel E of Table A5, the coefficients remain virtually unchanged, indicating that spatial spillovers are unlikely to bias our findings.
The above results show that PPAPs do produce a positive policy effect on rural income, and there is no significant time trend difference between the treated group and the control group before PV policy implementation. However, it is unknown whether the policy effect estimated is affected by other poverty alleviation policies simultaneously. In such cases, an upward trend in poverty alleviation is likely to confound our policy variable and thus overestimate the effect. However, the lack of data on other concurrent poverty alleviation measures in these sample counties makes it difficult to control for these effects directly. Indeed, this is a problem only if other interventions were implemented in the same manner as the PPAPs intervention, that is, with the same regional variations across intervene and non-intervene counties and the same time variations over pre- and post-intervention years.
Therefore, we conduct a permutation test and a placebo test to exclude the confounding effects of other potentially concurrent events or time-varying county-level factors affecting the rural income growth (Bertrand et al., Reference Bertrand, Duflo and Mullainathan2004; Chetty et al., Reference Chetty, Looney and Kroft2009). The permutation test randomly reassigns the treatment status 500 times and re-estimates Equation (1) for each randomized iteration to obtain simulated  $\beta $ coefficients (see appendix Figure A5 for the coefficients distribution). As expected, the number of times the simulated
 $\beta $ coefficients from randomly drawn treatment status in Panel F of Table A5 are more positive than the observed
 $\beta $ is 0 out of 500 placebo estimates, indicating that our main result is unlikely to be biased.
The placebo test is to verify whether the estimates are statistically significant before the policy’s adoption time of 2014. We narrow the sample period down to 2008–2014 and examine three shock-time years for 2009–2011, 2010–2012 and 2011–2013 of our shortened panel data. It is expected that the false PV policy dummy presents insignificant effects on income growth rate. Panels 1–3 in appendix Table A6 show the estimated effects of the three placebo PV policy shock times based on the specification from Equation (1). The coefficients of false PPAPs show that the average increase in rural income between pre- and post-periods is statistically insignificant. The results are robust across different placebo shock times, suggesting the exclusion of other potential confounding factors.
4.3. Heterogeneity analysis
Heterogeneity will be discussed in terms of spatial distribution, economic level, types of PV power plants and solar resource endowment. The 16 provinces are first divided into three regions (eastern, central and western) according to their geographical locations.Footnote 7 Coefficients on the PPAPs dummy variable for different regions are shown in Panel A of Table 3. The results indicate that the implementation of PPAPs increased the per capita rural income of counties in eastern, central and western China by about 8.6, 2.9 and 3.7 per cent respectively. The effect of participating in PPAPs is larger in the eastern region than in the central and western regions. The reason is likely that the eastern region is more developed and thus has better infrastructure, such as convenient transportation and well-established power grids, leading to more PV installations and policy effects.
Counties are then categorized by per capita GDP, with a high-GDP group being defined as above-median per capita income in the sample (16,243 yuan). Heterogeneity results of income level are reported in Panel B of Table 3. PPAPs tend to have a larger effect in boosting income in areas with higher GDP per capita, indicating that the programmes are more effective when implemented in areas with higher economic levels. This is consistent with the finding in Panel A to some extent.
Next, Panel C of Table 3 presents heterogeneity effects for counties that mainly have distributed PV projects versus counties that mainly have centralized PV projects. Counties with mainly centralized PV tend to have larger effects than counties with mainly distributed PV, indicating that centralized PV power generation is more likely to promote rural income.Footnote 8 The possible reason is that centralized PV is mainly installed in the Gobi and desert areas of Ningxia, Gansu, Xinjiang, Qinghai and other western provinces, with a large land area and installed capacity, which is convenient for unified management and has lower operation and maintenance costs. Moreover, most of the centralized PV is located in the Class I solar radiation resource area in China, with abundant solar resources and greater stability of PV power generation. By contrast, distributed PV is generally built on the roofs of buildings or open spaces in remote rural areas in northern and southern China, which are often economically impoverished areas with remote locations and poor transportation facilities, resulting in higher installation and maintenance costs. For household PV, there are still problems such as poor households’ low willingness and enthusiasm to install due to information asymmetry, and a lack of management and maintenance at a later stage.
Lastly, since the duration of sunlight is a critical factor affecting the performance of PV panels, we divide the sample equally into long, medium and short sunlight duration groups based on the solar resource endowment. The heterogeneity results are reported in Panel D of Table 3, indicating that PPAPs presented significant poverty reduction effects in areas with long hours of sunshine, while no statistically significant economic effect is observed in areas with relatively lower sunshine hours. The possible explanation is that the efficiency and stability of PV power generation equipment are poor in areas with insufficient light, leading to low willingness of local residents to adopt PV power generation and poor implementation of PPAPs.
5. Cost–benefit analysis
By 2019, the construction of all PPAPs in China had been fully completed. According to subsidy catalogue data statistics, the total installed capacity of these projects reached 21,778.01 MW, with the dedicated poverty alleviation capacity accounting for 14,074.89 MW (Table A1). These catalogue data encompass all PPAPs built from the pilot phase (2014–2016) through the expansion period (2017–2019), which have been reviewed and approved by the NEA of China for support (NEA of China, 2019). Notably, the Chinese government emphasized that, in light of the continuous decrease in construction costs of PV power stations in recent years, the feed-in tariffs for PPAPs remain fixed, without bidding or reductions (NEA of China, 2018), effectively ensuring the profitability of these initiatives.
Based on the subsidy directory, along with the 2019 electricity price and subsidy data for PPAPs,Footnote 9 we provide a back-of-the-envelope cost–benefit analysis of China’s PPAPs regarding the increase in annual household income, fiscal expenditure and their benefit ratios. Additionally, we conducted a comprehensive assessment of the net benefits over the life cycle of PPAPs. Finally, we provided a rough estimate of the environmental benefits of these projects.
5.1. Households’ total revenue from PPAPs
The households’ total revenue from PPAPs consists of two parts: the income from generating electricity and the government's subsidies in support of the PPAPs. We assume that electricity generated from all PPAP projects can be directly connected to the grid because PPAPs are generally prioritized for grid connection (NEA of China, 2020a). Given that the benchmarking electricity prices vary by solar resource areas and years, and the subsidy amount of distributed and centralized PV is also different (appendix Table A7), we calculate the annual power generation income of distributed and centralized PV in different sunlight resource areas separately to obtain the annual total income. While a small number of households contributed to the initial investment of household PV systems, the investment costs from poor households are relatively low and can be disregarded.Footnote 10
For centralized PV, all electricity generated would be integrated into the national grid with the benchmarking feed-in tariff (higher than the regular solar PV or coal-fired feed-in tariff) in different resource areas, but no additional subsidies would be enjoyed. Therefore, the product of the electricity generated in each solar resource area and the benchmarking electricity price in that area is the total revenue from generating electricity via installing centralized PV.
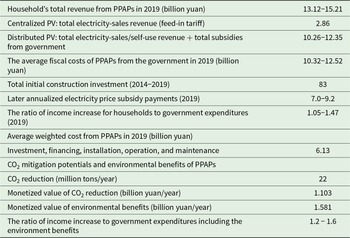
Distributed PV has three electricity consumption modes: ‘All for self-use’ ‘Self-use first, surplus for the national grid’ and ‘All for the national grid’. The first mode brings the highest revenue because residential electricity prices are higher than the benchmarking electricity price for integration into the national grid. Therefore, we set the revenue of this mode as the upper limit of distributed PV power revenue. Accordingly, the third mode has the lowest economy and thus is set as the lower limit of distributed PV power revenue. The income of ‘Self-use first, surplus for the national grid’ mode is somewhere in between. The specific data on installed capacity of PPAPs, the electricity price and subsidy as well as calculation steps are detailed in appendix Tables A1, A7 and A8, respectively. The calculated results presented in Table 4 show that the revenue of PPAPs for the households in 2019 is about 13.12–15.21 billion yuan.
The costs and benefits analysis of PPAPs in China
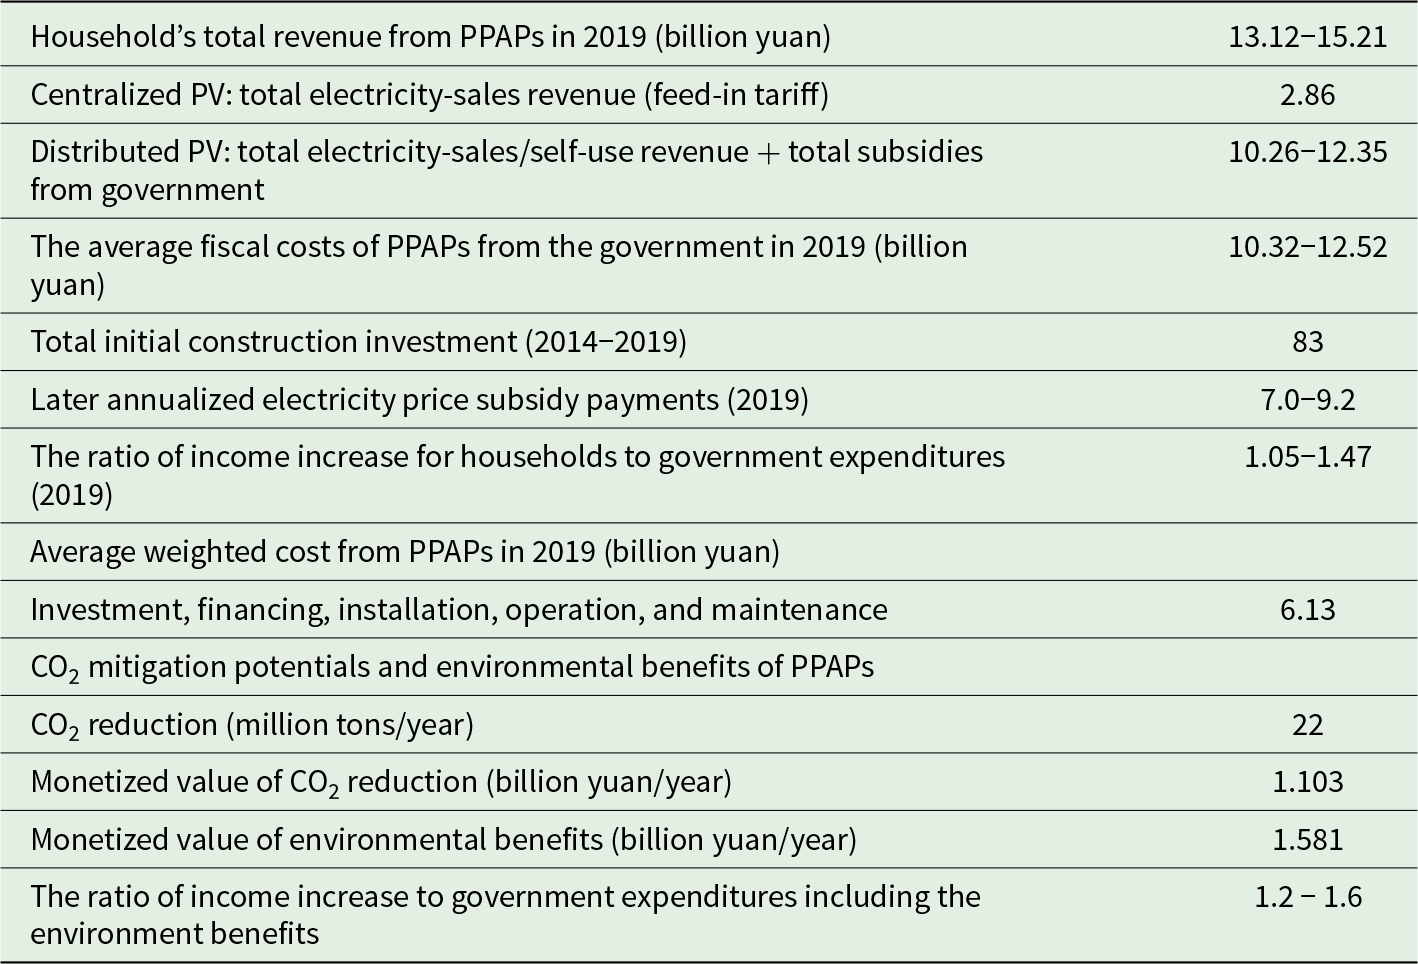
Notes: The fiscal expenditure in 2019 was calculated by averaging the initial government total investment over the life cycle of PV system (25 years), and adding the government subsidy expenditures. The environmental benefit of PPAPs refers to the external environmental impacts such as PM2.5, SO2, NOx, dust emissions and CO2 emissions from coal production, transportation and coal-fired power generation under the same electricity generation.
5.2. The government fiscal expenditures of PPAPs
Promoting the adoption of PV systems requires sufficient incentives, such as generous fiscal investments and price subsidies (De Groote and Verboven, Reference De Groote and Verboven2019). The initial investment of PPAPs mainly includes government poverty alleviation funds, investment funds from enterprises, social donations and loans to rural households from banks. Local governments are primarily responsible for the implementation and supervision of PPAPs. Since the implementation of PPAPs, the central and local governments in China have provided substantial initial construction investment and subsequent electricity price subsidies to stimulate residents in rural areas to adopt solar PV. Since 2016, the central government has explicitly prohibited corporate equity participation, shifting implementation towards village-level PV projects financed mainly through fiscal appropriations supplemented by social funds. Here, we assume that the initial investment by the government accounts for 80 per cent of the total investment, and 20 per cent for enterprises/social capital. Using unit installation cost data from the International Renewable Energy Agency (IRENA, 2020) and the average annual scale of PPAPs collected from government documents (NEA of China, 2018), we can calculate that the total installation cost of PPAPs from 2014 to 2019 was about 83 billion yuan.
As for the subsidy expenditure of the government, as shown in Table A7, the feed-in tariff of centralized PV has remained unchanged since 2017, and the subsidy of distributed PV has also been 0.42 yuan /kWh. Compared to general PV projects and coal-fired feed-in tariffs, PPAPs enjoyed larger governmental subsidies. The calculation of government subsidy in 2019 is presented in Table 4, indicating that the government subsidy of PPAPs is an important source of income for residents, which is in the range of 7.0 billion to 9.2 billion yuan.Footnote 11 This is similar to the government’s subsidy payments announced by the Ministry of Finance of China, which were 8.64 billion yuan in 2018 and 6.48 billion yuan in 2019 (MOF of China, 2019).
We also tried to use the levelized cost of electricity (LCOE) to measure the per-unit cost of generating electricity throughout the life cycle of PV plants. LCOE is the power generation cost calculated after the levelling of cost and energy generation within a project's life cycle, namely, the net present value of the unit power generation cost over the life cycle. It considers the minimum cost of investment, financing, installation, operation and maintenance for households to participate in PPAPs. According to the IRENA (2020), the LCOE of PV power generation in China in 2019 was about 0.37 yuan ($0.054) per kWh. We use this to calculate the annual total social cost of PV power generation as 6.13 billion yuan.
5.3. The ratio of household income increase to government expenditures
The ratio of rural household income increase to government expenditure represents a crucial indicator of the effectiveness of government policy implementation in alleviating poverty. It helps to understand the amount of benefits that are transferred to rural households and how effectively government funds are being utilized to achieve the intended goal of poverty alleviation through the PPAPs. We calculated the ratio of total household income to total government fiscal expenditure from Table 4, which yields a range of 1.05–1.47. This indicates that for every unit of government investment, there is a corresponding increase in household income that exceeds the amount spent. This not only reflects the effectiveness of PPAPs in achieving their objectives but also underscores the programme’s potential to create sustainable economic benefits for the targeted households. Moreover, this result reflects the redistributive nature of the policy. It effectively directs public expenditures and social capital to impoverished areas to support the construction of PV systems, while directly allocating the generated revenue to rural households. This mechanism serves to enhance income levels among vulnerable populations, address structural imbalances in energy access and economic opportunities, and thereby advance social justice.
5.4. The net benefit of PPAPs
By leveraging the income growth coefficient derived from the above empirical estimation, we calculate the total income increase that PPAPs bring to rural households. Net benefits are then obtained by offsetting this amount with total programme costs. Therefore, we calculated the total net present benefits per capita from PPAPs using the following equation, as referenced in Zhang et al. (Reference Zhang, Xie and Zheng2023):
 \begin{equation}Net\;benefit=\underbrace{\sum_{y=2014}^{2019}\left[I_y-\left(\frac{1+g_c}{1+\delta}\right)^{y-2014}I_{2014}\right]}_{\text{benefit}\,\text{within}\,\text{the}\,\text{construction}\,\text{period}}+\underbrace{\sum_{t=1}^T\left[\left(\frac{1+g}{1+\delta}\right)^t\lbrack\beta I_{2019}\rbrack\right]}_{\text{benefit}\,\text{on}\,\text{the}\,\text{life}\,\,\text{cycle}\,\text{period}}-(1+\tau)C\end{equation}
where  ${I_y}$ is the per capita disposable income at year
 $y$ within the data period.
 ${g_c}$ is the average growth rate of the control group in the data period.
 $g$ is the counterfactual growth rate, and it is used with the per capita income of households in the treatment group.
 $\beta $ is the treatment effect estimated above (5 per cent).
 $\delta $ is the discount rate, set at 3 per cent, reflecting the time value of money.
 $T$ is the service year of solar PV system (25 years).
 $C$ is the total life cycle expenditure of PPAPs, including costs related to installation, operation, maintenance and equipment renewal. It is normalized to 12,309 yuan per capita, based on the LCOE calculated in Section 5.2. This value is derived by multiplying the average LCOE by the project duration (25 years) and dividing the result by the total number of programme beneficiaries, which is approximately 12.45 million people.Footnote 12
 $\tau $ denotes excess burden factor with a value of 0.3 (Finkelstein and Hendren, Reference Finkelstein and Hendren2020).
The estimated results reveal that the net present value of the programme amounts to 19,230 yuan per capita, corresponding to approximately 57,690 yuan in total net benefits per household over the project's entire life cycle. This measure reflects purely economic net benefits and excludes non-economic gains such as environmental and social impacts. Importantly, the per capita net benefit calculated fully accounts for all project-related costs and is distributed across all beneficiaries. As most construction costs were borne by the government, with rural households financing only a negligible share through bank loans, the overall benefits are likely understated. Therefore, the actual benefits of the programme are likely to be even greater when considering these additional dimensions. These findings highlight the programme’s effectiveness in transferring payments and improving equity among rural households.
5.5. Environmental benefits and CO2 mitigation potentials of PPAPs
Apart from increasing income, solar PV also reduces air pollution and greenhouse emissions caused by fossil fuels (Crago and Chernyakhovskiy, Reference Crago and Chernyakhovskiy2017). We quantitatively evaluate the environmental benefits and CO2 mitigation potentials of PPAPs by referring to previous literature. Table A9 shows the existing literature on the environmental costs and benefits assessment of PV systems in China. They vary significantly across the type and size of the PV plant. The differences in evaluation methods, data resources, technological level, solar radiation and other factors also lead to different evaluation results. We chose the results of Green Peace (2017) to calculate the environmental benefits of PPAPs because of its relatively comprehensive assessment methods. Green Peace (2017) estimated that the environmental benefit of PV power generation versus coal power was 0.096 yuan/kWh, and environmental costs of solar power generation can be negligible.Footnote 13
The results in Table 4 show that PPAPs can prevent 1.103 billion yuan worth of carbon emissions from coal-fired power generation based on a carbon price of 50 yuan per ton in China's emission trading system, meaning that about 22 million tons of carbon dioxide eliminated per year, which accounts for about 0.4 per cent of the reduction in China’s carbon emissions in 2020.Footnote 14 This is close to Sri Lanka’s CO2 emissions (20.8 million tons) and Denmark's CO2 emissions (25.9 million tons) in 2020 (International Energy Agency, 2020). Considering that China's carbon price is still at the initial stage of development, if the costs are calculated based on a European Union (EU) carbon price (100 euro/t), the CO2 emissions abatement benefits of PPAPs can reach 16.524 billion yuan per year (Table A9). This implies that PPAPs in China have significant environmental benefits. Compared to the EU, where the carbon market is more mature, the environmental benefits of PV power generation tend to be underestimated due to China’s lower carbon prices. Furthermore, if taking into account the environmental costs of pollutants and emissions other than CO2, the environmental benefits of PPAPs are calculated as 1.581 billion yuan.
It is important to note that the cost–benefit analysis calculations extrapolate solar panel performance over their entire life cycle without fully accounting for potential efficiency loss due to aging, environmental factors or lack of regular maintenance in remote rural regions. Consequently, the projected benefits should be interpreted as approximate estimates rather than precise forecasts. While these assumptions are standard in the related literature, they nonetheless introduce uncertainty into the calculations and may affect the magnitude of the estimated benefits.
6. Conclusions
As projects that not only alleviate poverty but also promote a clean and renewable energy industry, China’s PPAPs can provide an example to other developing countries that are facing poverty and/or energy transition issues. In this paper, county-level data from rural China are used to find that the implementation of PPAPs has a positive impact on income. Specifically, in counties that implemented PPAPs, the rural per capita income increased on average by about 5 per cent. Heterogeneity analysis shows that PPAPs have a larger effect in more developed regions, abundant sunlight hours areas and regions dominated by centralized as opposed to distributed PV projects.
Moreover, this paper systematically assesses the economic costs and benefits of PPAPs. By comparing the growth in household income with the fiscal expenditures of the PPAPs, we find that PPAPs are an effective policy, with a ratio of household income growth to government fiscal expenditure ranging from 1.2 to 1.6. Although the implementation of PPAPs depends on substantial government fiscal subsidies at their installation stage, they still yield clearly positive benefits over their life cycle, especially when environmental benefits are considered. Specifically, PPAPs can increase the total income of a poor household by about 57,690 yuan over their life cycle, which represents a significant income boost for the poor households. Furthermore, PPAPs can reduce CO2 by about 22 million tons per year. The corresponding environmental benefits exceed 1 billion yuan and 16 billion yuan using China’s and EU’s carbon prices respectively.
These results yield several important policy implications. First, the current period represents a timely window for scaling up solar PV for poverty alleviation in developing countries. PV costs have declined by more than 90 per cent over the past decade and are now at historically low levels. Although further cost reductions are expected, the pace of decline is likely to slow, implying diminishing marginal gains from waiting. Investing in PV deployment for eligible poor households at this stage – despite relatively high upfront costs – can generate early and sustained benefits due to low operating costs, thereby accelerating poverty reduction. Delaying investment in anticipation of further technological progress may lead to forgone cash flows and reduced cost-effectiveness.
Second, China’s PPAPs provide valuable practical experience for other developing countries seeking to address energy poverty while advancing clean energy transitions. Centralized PV projects, which benefit from economies of scale and more stable transmission, are shown to be more effective in poverty alleviation. At the same time, distributed PV remains important in rural areas due to its smaller land-use footprint, proximity to end-users and flexible scalability. Policymakers should fully utilize available resources such as residential rooftops and idle land, while ensuring adequate post-installation operation and maintenance to sustain income generation.
Finally, PV-based poverty alleviation delivers substantial environmental and health co-benefits. Expanding clean PV deployment in poor and rural areas can improve access to clean energy, reduce reliance on traditional solid fuels and lower associated health risks. As PV generation costs continue to decline and grid parity has been achieved in China, the fiscal burden on governments is likely to ease over time, offering transferable lessons for other developing countries.
Supplementary material
The supplementary material for this article can be found at https://doi.org/10.1017/S1355770X26100461
Acknowledgements
This study is supported by the National Natural Science Foundation of China (No. 72293603, 72488101, 72573022) and National Social Science Foundation of China (No. 23AZD063). We are grateful to the anonymous reviewers and editor for their helpful comments. We thank the Sanford School of Public Policy at Duke University for providing institutional support, research facilities, and access to database resources. The views expressed in this paper are solely the authors’ own and do not necessarily reflect the views of the supporting agencies and authors’ affiliations. The authors alone are responsible for any remaining deficiencies.
Competing interests
The authors declare that they have no known competing financial interests or personal relationships that could have appeared to influence the work reported in this paper.