1 Introduction
The prediction of the conditions for which a drop impacting a dry solid spreads or breaks into tiny pieces has recently aroused great interest in the fluid mechanics community for its relevance in not only a number of technological applications, such as coating, cleaning or cooling (Mundo, Sommerfeld & Tropea Reference Mundo, Sommerfeld and Tropea1995; Staat et al. Reference Staat, Tran, Geerdink, Riboux, Sun, Gordillo and Lohse2015; Visser et al. Reference Visser, Frommhold, Wildeman, Mettin, Lohse and Sun2015; Josserand & Thoroddsen Reference Josserand and Thoroddsen2016), but also in natural processes, such as the propagation of contaminants (Lejeune, Gilet & Bourouiba Reference Lejeune, Gilet and Bourouiba2018). The present contribution is aimed at improving our understanding of the conditions under which a drop falling onto an inclined solid substrate splashes or not; thus, the present situation differs from the similar case in which the drop falls on a pool or thin liquid film (Josserand & Zaleski Reference Josserand and Zaleski2003; Cimpeanu & Moore Reference Cimpeanu and Moore2018).
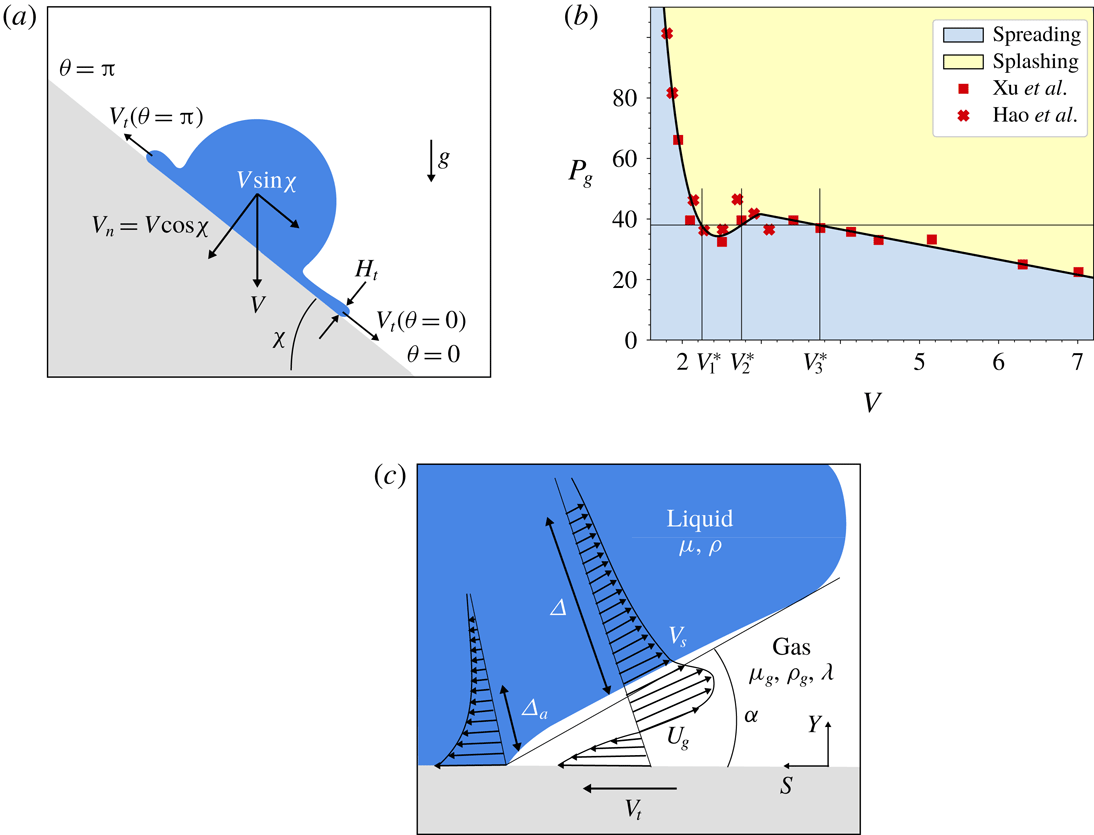
(a) Sketch showing a drop falling at a velocity
 $V$
onto a substrate inclined at an angle
 $\unicode[STIX]{x1D712}$
with respect to the horizontal direction and some of the different variables used in the analysis, with
 $\unicode[STIX]{x1D703}$
indicating the angular position on the impact plane. (b) Experimental evidence taken from Xu, Zhang & Nagel (Reference Xu, Zhang and Nagel2005) and Hao et al. (Reference Hao, Lu, Lee, Wu, Hu and Floryan2019) for
 $\unicode[STIX]{x1D712}=0$
revealing that, for low values of the atmospheric pressure, with
 $P_{g}$
fixed to
 $P_{g}=38$
kPa and increasing values of
 $V$
, there exists a transition from spreading to splashing for
 $V=V_{1}^{\ast }$
, from splashing to spreading for
 $V=V_{2}^{\ast }$
, and from spreading to splashing for
 $V=V_{3}^{\ast }$
, with
 $V_{1}^{\ast }<V_{2}^{\ast }<V_{3}^{\ast }$
. Experiments corresponding to ethanol droplets in air. (c) Sketch of the flow at the edge of the liquid sheet and at the lubrication gas layer in a frame of reference moving at
 $V_{t}$
; here,
 $U_{g}$
indicates the gas velocity field and
 $V_{s}$
is the liquid velocity at the gas–liquid interface.
 $\unicode[STIX]{x1D6E5}$
is the width of the viscous boundary layer induced by gas shear stresses and
 $\unicode[STIX]{x1D6E5}_{a}=R\,\unicode[STIX]{x1D6FF}\propto R(Re^{-1/2}\,t_{e})$
is the thickness of the liquid boundary layer developing at the wall. The material properties of the two fluids involved are also indicated in this figure.

The problem at hand can be stated as follows: a drop of radius
 $R$
, falling at a velocity
 $V$
onto an inclined substrate forming an angle
 $\unicode[STIX]{x1D712}$
with respect to the horizontal (see figure 1
a), will break into smaller parts, rapidly ejected radially outwards, for impact velocities above the critical velocity for splashing,
 $V^{\ast }$
. Our purpose here will be to determine
 $V^{\ast }$
as a function of the drop radius
 $R$
, the inclination angle
 $\unicode[STIX]{x1D712}$
, the material properties of the liquid, namely, the liquid density, viscosity and interfacial tension coefficient,
 $\unicode[STIX]{x1D70C}$
,
 $\unicode[STIX]{x1D707}$
and
 $\unicode[STIX]{x1D70E}$
, respectively, the gas density
 $\unicode[STIX]{x1D70C}_{g}$
, the gas viscosity
 $\unicode[STIX]{x1D707}_{g}$
, the mean free path of gas molecules
 $\unicode[STIX]{x1D706}$
, the gas temperature
 $T_{g}$
and the gas pressure,
 $P_{g}$
. Indeed, in a seminal study, Xu et al. (Reference Xu, Zhang and Nagel2005) reported that drop splashing could be inhibited for sufficiently low values of the atmospheric pressure; these results being recently extended to the case of inclined substrates by Hao et al. (Reference Hao, Lu, Lee, Wu, Hu and Floryan2019), who also showed that their experimental results could be rationalized on the basis of the value of the velocity
 $V_{t}$
at which the lamella is ejected, with
 $V_{t}$
calculated using the theoretical results in Riboux & Gordillo (Reference Riboux and Gordillo2014) (see figure 1
a). Moreover, Xu et al. (Reference Xu, Zhang and Nagel2005), Stevens (Reference Stevens2014) and Hao et al. (Reference Hao, Lu, Lee, Wu, Hu and Floryan2019) also reported that the threshold velocity for splashing possesses a non-monotonic behaviour for low values of
 $P_{g}$
: indeed, for a fixed value of
 $P_{g}$
, which must be within a range of values that depends on the material properties of the liquid and the gas, the impacting drop experiences a transition from spreading to splashing for
 $V\geqslant V_{1}^{\ast }$
but, counterintuitively, splashing is suppressed for values of
 $V>V_{2}^{\ast }$
, with
 $V_{2}^{\ast }>V_{1}^{\ast }$
. Even more surprising is the fact that there exists a further transition from spreading to splashing for
 $V>V_{3}^{\ast }$
with
 $V_{3}^{\ast }>V_{2}^{\ast }$
(see figure 1
b).
This quite unexpected behaviour of droplet splashing at low gas pressures will be explained here by making use of the theory in Riboux & Gordillo (Reference Riboux and Gordillo2014) and Riboux & Gordillo (Reference Riboux and Gordillo2017), which has been proven to provide good quantitative agreement with experimental measurements (Palacios et al. Reference Palacios, Hernandez, Gomez, Zanzi and Lopez2013; Staat et al. Reference Staat, Tran, Geerdink, Riboux, Sun, Gordillo and Lohse2015; Hao & Green Reference Hao and Green2017; de Goede et al. Reference de Goede, Laan, de Bruin and Bonn2018; Hao et al. Reference Hao, Lu, Lee, Wu, Hu and Floryan2019). In addition, the remarkable experimental findings in Hao et al. (Reference Hao, Lu, Lee, Wu, Hu and Floryan2019) will be expressed here as a function of the drop radius, the inclination angle of the substrate, the material properties of the liquid and the gas, and the values of the gas pressure and gas temperature.
2 Theoretical approach and comparison with experiments
The conditions under which a drop impacting an inclined substrate splashes or not will be expressed as a function of the following dimensionless parameters:
 $$\begin{eqnarray}Oh=\frac{\unicode[STIX]{x1D707}}{\sqrt{\unicode[STIX]{x1D70C}R\unicode[STIX]{x1D70E}}},\quad Re=\frac{V_{n}R}{\unicode[STIX]{x1D708}},\quad We=(Re\,Oh)^{2},\quad We_{\unicode[STIX]{x1D706}}=We\frac{\unicode[STIX]{x1D706}}{R},\end{eqnarray}$$
with the normal impact velocity (see figure 1 a) and the mean free path of gas molecules given by
 $$\begin{eqnarray}V_{n}=V\cos \unicode[STIX]{x1D712}\quad \text{and}\quad \unicode[STIX]{x1D706}=\frac{k_{B}T_{g}}{\sqrt{2}\unicode[STIX]{x03C0}d^{2}P_{g}},\end{eqnarray}$$
and where
 $\unicode[STIX]{x1D708}=\unicode[STIX]{x1D707}/\unicode[STIX]{x1D70C}$
denotes the kinematic viscosity of the liquid. In (2.2)
 $k_{B}$
denotes the Boltzmann constant,
 $d$
is the effective diameter of gas molecules, and
 $P_{g}$
and
 $T_{g}$
indicate the gas pressure and temperature, respectively. Dimensionless variables, which will be written in lower-case letters to differentiate them from their dimensional counterparts – in capitals – are constructed using
 $R$
,
 $V_{n}$
,
 $R/V_{n}$
and
 $\unicode[STIX]{x1D70C}V_{n}^{2}$
as the characteristic values of length, velocity, time and pressure. Notice that all results will be deduced in a frame of reference moving at the tangential speed of the drop
 $V\sin \unicode[STIX]{x1D712}$
since, with this choice, an observer would see the drop approximate the wall perpendicularly and with a velocity
 $V_{n}=V\cos \unicode[STIX]{x1D712}$
. The origin of times,
 $t=0$
, is set at the instant the drop first touches the substrate and gravitational effects are neglected since the Froude number based on the normal velocity satisfies the condition
 $V_{n}^{2}/(gR)\gg 1$
.
In the moving frame of reference, the results in Riboux & Gordillo (Reference Riboux and Gordillo2014) and Riboux & Gordillo (Reference Riboux and Gordillo2017) are directly applicable and, hence, since
 $Re^{1/6}Oh^{2/3}<0.25$
for the case of low-viscosity liquids and millimetric droplets of interest here, a thin liquid film of dimensionless thickness
 $h_{t}$
is not ejected exactly at
 $t=0$
, but at the instant
 $$\begin{eqnarray}t_{e}=1.05\,We^{-2/3}.\end{eqnarray}$$
Moreover, in the moving frame of reference, the initial velocity of the advancing liquid film predicted in Riboux & Gordillo (Reference Riboux and Gordillo2014) and Riboux & Gordillo (Reference Riboux and Gordillo2017) is given by
 $$\begin{eqnarray}V_{t}=V\cos \unicode[STIX]{x1D712}v_{a}\quad \text{with}~v_{a}=\sqrt{3}/2t_{e}^{-1/2}\propto We^{1/3}\end{eqnarray}$$
and, in the limit
 $Re\rightarrow \infty$
, potential flow theory (Scolan & Korobkin Reference Scolan and Korobkin2003; Riboux & Gordillo Reference Riboux and Gordillo2014) predicts that, initially, the thickness of the lamella is given by
 $$\begin{eqnarray}H_{a}=Rh_{a}\quad \text{with}~h_{a}=2t_{e}^{3/2}/(\sqrt{3}\unicode[STIX]{x03C0})\propto We^{-1},\end{eqnarray}$$
where use of (2.3) has been made. However, the initial thickness of the ejected sheet is larger than
 $h_{a}$
in (2.5) (that is,
 $h_{t}>h_{a}$
), because a boundary layer develops upstream of the location where the ejected liquid sheet meets the drop. This boundary layer grows along a characteristic length
 $h_{a}\propto t_{e}^{3/2}$
(see (2.5)) and, since the liquid velocity in the moving frame of reference is, in this region,
 $v_{a}\propto t_{e}^{-1/2}$
(see (2.4)), the thickness of the boundary layer growing at the wall is given by (see figure 1
c) (Riboux & Gordillo Reference Riboux and Gordillo2015)
 $$\begin{eqnarray}\unicode[STIX]{x1D6E5}_{a}\propto \sqrt{\unicode[STIX]{x1D708}R/V_{n}(h_{a}/v_{a})}\propto R\,Re^{-1/2}(h_{a}/v_{a})^{1/2}\propto R\,Re^{-1/2}t_{e}.\end{eqnarray}$$
Hence, mass conservation yields (Riboux & Gordillo Reference Riboux and Gordillo2017)
 $$\begin{eqnarray}h_{t}=h_{a}+\unicode[STIX]{x1D6E5}_{a}/(2R)\propto t_{e}^{3/2}(1+K_{a}/\sqrt{Re\,t_{e}})\propto We^{-1}(1+K_{a}We^{1/12}\,Oh^{1/2}),\end{eqnarray}$$
with
 $Re=We^{1/2}Oh^{-1}$
,
 $K_{a}\sim O(1)$
a proportionality constant and where use of (2.3) has been made.
In Riboux & Gordillo (Reference Riboux and Gordillo2014) and Riboux & Gordillo (Reference Riboux and Gordillo2017) it was also shown that, once the liquid sheet is expelled, its edge experiences a vertical lift force per unit length
 $F_{L}\sim \unicode[STIX]{x1D707}_{g}V_{t}$
caused by the gas lubrication layer located beneath the liquid rim, which induces a vertical velocity to the front of the expanding liquid sheet
 $$\begin{eqnarray}V_{v}\propto \sqrt{F_{L}/(\unicode[STIX]{x1D70C}H_{t})}\end{eqnarray}$$
in a characteristic time given by
 $$\begin{eqnarray}T_{c}\sim \left[\frac{\unicode[STIX]{x1D70C}H_{t}^{3}}{F_{L}}\right]^{1/2}\sim \left[\frac{\unicode[STIX]{x1D70C}H_{t}^{3}}{\unicode[STIX]{x1D707}_{g}V_{t}}\right]^{1/2}.\end{eqnarray}$$
The vertical velocity imparted to the edge of the expanding sheet could make the lamella take off from the substrate if this velocity is larger than the radial growth of the rim caused by capillary retraction, whose characteristic velocity is given by
 $\propto \sqrt{\unicode[STIX]{x1D70E}/(\unicode[STIX]{x1D70C}H_{t})}$
; hence, the critical velocity for splashing can be determined from the condition
 $$\begin{eqnarray}\sqrt{\frac{F_{L}}{2\unicode[STIX]{x1D70E}}}=\unicode[STIX]{x1D6FD},\end{eqnarray}$$
with
 $\unicode[STIX]{x1D6FD}$
a constant. In Riboux & Gordillo (Reference Riboux and Gordillo2014) and Riboux & Gordillo (Reference Riboux and Gordillo2017), the lift force
 $F_{L}$
was expressed as the addition of the lubrication force exerted by the gas flow in the wedge region formed by the advancing liquid sheet and the substrate,
 $K_{l}\unicode[STIX]{x1D707}_{g}V_{t}$
, with
 $V_{t}$
the relative velocity between the gas and the liquid, plus the aerodynamic force
 $K_{u}\unicode[STIX]{x1D70C}_{g}V_{t}^{2}H_{t}$
, with
 $K_{u}=0.3$
a constant. As was already noticed in Riboux & Gordillo (Reference Riboux and Gordillo2014), the relative importance of the aerodynamic lift is always small compared with the lubrication force. In this regard, in our attempt to reproduce the experimental results by Hao et al. (Reference Hao, Lu, Lee, Wu, Hu and Floryan2019), we realized (see the supplementary material available at https://doi.org/10.1017/jfm.2019.396 for details) that we overestimated the value of the constant
 $K_{u}$
, which we set in this contribution to zero – a fact yielding that the splash criterion in Riboux & Gordillo (Reference Riboux and Gordillo2014) and Riboux & Gordillo (Reference Riboux and Gordillo2017) can be simplified to
 $$\begin{eqnarray}\frac{K_{l}\unicode[STIX]{x1D707}_{g}V_{t}}{\unicode[STIX]{x1D70E}}=K\quad \text{with}~K=2\unicode[STIX]{x1D6FD}^{2}-0.3\unicode[STIX]{x1D70C}_{g}V_{t}^{2}H_{t}/\unicode[STIX]{x1D70E}\simeq 0.034,\end{eqnarray}$$
where we have taken into account that
 $\unicode[STIX]{x1D6FD}=0.14$
and also that, for the experiments reported in Riboux & Gordillo (Reference Riboux and Gordillo2014),
 $0.3\unicode[STIX]{x1D70C}_{g}V_{t}^{2}H_{t}/\unicode[STIX]{x1D70E}\simeq 0.005$
.
Now, we extend our previous results, summarized in the equations above, to the case of inclined substrates and take into account that the relative velocity between the edge of the advancing liquid sheet and the gas is, in dimensionless terms,
 $v_{t}=v_{a}+\tan \unicode[STIX]{x1D712}\cos \unicode[STIX]{x1D703}$
, with
 $v_{a}$
given in (2.4) (see figure 1
a, where
 $\unicode[STIX]{x1D703}$
is defined). Making use of the definitions of the different dimensionless variables in (2.1) and of (2.3)–(2.7), the splash criterion (2.11) can be written as
 $$\begin{eqnarray}K_{l}\left(\frac{\unicode[STIX]{x1D707}_{g}}{\unicode[STIX]{x1D707}}\right)Oh\,We^{5/6}[1+2(t_{e}^{1/2}/\sqrt{3})\tan \unicode[STIX]{x1D712}\cos \unicode[STIX]{x1D703}]=K\simeq 0.034.\end{eqnarray}$$
The expression for the coefficient
 $K_{l}$
in (2.11) results from the integration of the lubrication pressure in the wedge formed between the substrate and the advancing liquid front that propagates at a velocity
 $V_{t}$
with respect to the solid wall (see figure 1
c). The lubrication equations are solved subject to the following boundary conditions in the moving frame of reference:
 $$\begin{eqnarray}Y=0:\quad U_{g}=V_{t}+\ell _{g}\frac{\unicode[STIX]{x2202}U_{g}}{\unicode[STIX]{x2202}Y},\quad Y=H(S):\quad U_{g}=-\ell _{\unicode[STIX]{x1D707}}\frac{\unicode[STIX]{x2202}U_{g}}{\unicode[STIX]{x2202}Y},\end{eqnarray}$$
with
 $U_{g}$
the gas velocity, and
 $\ell _{g}$
and
 $\ell _{\unicode[STIX]{x1D707}}$
representing the slip lengths at the boundaries of the wedge. While
 $\ell _{g}$
is the slip length associated with the Knudsen layer at
 $Y=0$
(the so-called Maxwell slip) and, hence,
 $\ell _{g}=\unicode[STIX]{x1D706}$
, the slip at
 $Y=H$
has two different sources: namely, the effect of the Knudsen layer at the gas–liquid interface (Sprittles Reference Sprittles2015) plus the velocity induced in the liquid by the gas shear at the interface; therefore,
 $\ell _{\unicode[STIX]{x1D707}}=\ell _{g}+\ell _{\unicode[STIX]{x1D707}}^{\prime }$
, with
 $\ell _{\unicode[STIX]{x1D707}}^{\prime }$
to be determined in what follows using the balance of shear stresses. The criterion for droplet splashing in (2.12) depends on the gas lubrication force on the advancing liquid wedge, and this force depends crucially on the slip lengths
 $\ell _{g}$
and
 $\ell _{\unicode[STIX]{x1D707}}$
in (2.13): indeed, if
 $\ell _{g}=\ell _{\unicode[STIX]{x1D707}}=0$
, the resulting lubrication force would diverge logarithmically up to infinity (Snoeijer & Andreotti Reference Snoeijer and Andreotti2013).
The solution of the lubrication equations subject to the boundary conditions (2.13) yields the following expression for
 $K_{l}$
(see Riboux & Gordillo (Reference Riboux and Gordillo2014), Riboux & Gordillo (Reference Riboux and Gordillo2017) for details):
 $$\begin{eqnarray}K_{l}\approx -(6/\tan ^{2}\unicode[STIX]{x1D6FC})aC_{2}[\ln (1+a)+\ln a^{-1}]-(6/\tan ^{2}\unicode[STIX]{x1D6FC})bC_{3}[\ln (1+b)+\ln b^{-1}].\end{eqnarray}$$
In Riboux & Gordillo (Reference Riboux and Gordillo2014) and Riboux & Gordillo (Reference Riboux and Gordillo2017) we used our experimental results on the splashing of droplets impacting partially wetting substrates, finding that
 $\unicode[STIX]{x1D6FC}\simeq 60^{\circ }$
,
 $6/\tan ^{2}\unicode[STIX]{x1D6FC}\approx 2$
. In (2.14), the coefficients
 $a$
and
 $b$
are defined as
 $$\begin{eqnarray}\left.\begin{array}{@{}c@{}}\displaystyle a=2(\bar{\ell }_{g}+\bar{\ell }_{\unicode[STIX]{x1D707}})+2\sqrt{(\bar{\ell }_{g}-\bar{\ell }_{\unicode[STIX]{x1D707}})^{2}+\bar{\ell }_{g}\bar{\ell }_{\unicode[STIX]{x1D707}}}\\ \displaystyle b=2(\bar{\ell }_{g}+\bar{\ell }_{\unicode[STIX]{x1D707}})-2\sqrt{(\bar{\ell }_{g}-\bar{\ell }_{\unicode[STIX]{x1D707}})^{2}+\bar{\ell }_{g}\bar{\ell }_{\unicode[STIX]{x1D707}}},\end{array}\right\}\end{eqnarray}$$
with
 $$\begin{eqnarray}\left.\begin{array}{@{}c@{}}\displaystyle C_{1}=\frac{2\bar{\ell }_{\unicode[STIX]{x1D707}}}{ab},\quad C_{2}=\frac{1-C_{1}b}{b-a},\quad C_{3}=-(C_{1}+C_{2})\\ \displaystyle \bar{\ell }_{g}=\unicode[STIX]{x1D706}/H_{t}\quad \bar{\ell }_{\unicode[STIX]{x1D707}}=\bar{\ell }_{g}+\bar{\ell ^{\prime }}_{\unicode[STIX]{x1D707}}=\unicode[STIX]{x1D706}/H_{t}+\ell _{\unicode[STIX]{x1D707}}^{\prime }/H_{t}.\end{array}\right\}\end{eqnarray}$$
In (2.16),
 $$\begin{eqnarray}\bar{\ell }_{g}\propto \frac{\unicode[STIX]{x1D706}}{H_{t}}\propto \left[\frac{\unicode[STIX]{x1D706}}{R}\right]We(1+K_{a}\,We^{1/12}\,Oh^{1/2})^{-1}=We_{\unicode[STIX]{x1D706}}(1+K_{a}\,We^{1/12}\,Oh^{1/2})^{-1},\end{eqnarray}$$
with
 $h_{t}$
and
 $We_{\unicode[STIX]{x1D706}}$
defined in (2.7) and (2.1), respectively, and
 $\ell _{\unicode[STIX]{x1D707}}=\ell _{g}+\ell _{\unicode[STIX]{x1D707}}^{\prime }$
, with
 $\ell _{\unicode[STIX]{x1D707}}^{\prime }$
deduced making use of the continuity of shear stresses at the gas–liquid interface: namely,
 $$\begin{eqnarray}\unicode[STIX]{x1D707}\frac{V_{s}}{\unicode[STIX]{x1D6E5}}\sim \unicode[STIX]{x1D707}_{g}\frac{\unicode[STIX]{x2202}U_{g}}{\unicode[STIX]{x2202}Y}\;\Longrightarrow \;V_{s}\sim \left[\unicode[STIX]{x1D6E5}\frac{\unicode[STIX]{x1D707}_{g}}{\unicode[STIX]{x1D707}}\right]\frac{\unicode[STIX]{x2202}U_{g}}{\unicode[STIX]{x2202}Y}=\ell _{\unicode[STIX]{x1D707}}^{\prime }\frac{\unicode[STIX]{x2202}U_{g}}{\unicode[STIX]{x2202}Y}\quad \text{with}~\ell _{\unicode[STIX]{x1D707}}^{\prime }=\unicode[STIX]{x1D6E5}\frac{\unicode[STIX]{x1D707}_{g}}{\unicode[STIX]{x1D707}}.\end{eqnarray}$$
In (2.18),
 $\unicode[STIX]{x1D6E5}$
denotes the thickness of the boundary layer induced by the gas shear stresses acting on the edge of the ejected liquid sheet, and
 $V_{s}$
and
 $U_{g}$
indicate, respectively, the velocity at the gas–liquid interface and the gas velocity in the wedge region (see figure 1
c). At this point, notice that, in Riboux & Gordillo (Reference Riboux and Gordillo2014) and Riboux & Gordillo (Reference Riboux and Gordillo2017) the slip length at
 $Y=H$
was approximated as
 $\ell _{\unicode[STIX]{x1D707}}=H_{t}\unicode[STIX]{x1D707}_{g}/\unicode[STIX]{x1D707}$
, which contrasts with
 $\ell _{\unicode[STIX]{x1D707}}=\ell _{g}+\unicode[STIX]{x0394}\unicode[STIX]{x1D707}_{g}/\unicode[STIX]{x1D707}$
used here. Indeed, in our previous contributions we did not take into account the effect of the Knudsen layer at the gas–liquid interface (Sprittles Reference Sprittles2015) and also assumed that the momentum diffused so efficiently that the boundary layer thickness coincided with that of the liquid wedge (that is,
 $\unicode[STIX]{x1D6E5}=H_{t}$
).
The boundary layer thickness can be expressed as
 $\unicode[STIX]{x1D6E5}\propto \sqrt{\unicode[STIX]{x1D708}T_{c}}$
, with
 $T_{c}$
given in (2.9),
 $$\begin{eqnarray}\unicode[STIX]{x1D6E5}\propto \sqrt{\unicode[STIX]{x1D708}T_{c}}\propto \sqrt{\unicode[STIX]{x1D708}\left[\frac{\unicode[STIX]{x1D70C}H_{t}^{3}}{\unicode[STIX]{x1D707}_{g}V_{t}}\right]^{1/2}}\propto H_{t}\left[\frac{\unicode[STIX]{x1D707}}{\unicode[STIX]{x1D707}_{g}}\right]^{1/4}Re^{-1/4}t_{e}^{-1/4}\approx H_{t}\left[\frac{\unicode[STIX]{x1D707}}{\unicode[STIX]{x1D707}_{g}}\right]^{1/4}Oh^{1/4},\end{eqnarray}$$
where we have made use of the fact that
 $Re=\sqrt{We}/Oh$
and also of (2.3). Consequently, making use of the definition of
 $\ell _{\unicode[STIX]{x1D707}}^{\prime }$
in (2.18) and of the definitions of
 $\bar{\ell }_{\unicode[STIX]{x1D707}}$
and
 $\bar{\ell }_{g}$
in (2.16),
 $$\begin{eqnarray}\bar{\ell }_{\unicode[STIX]{x1D707}}=\frac{\ell _{g}}{H_{t}}+\frac{\ell _{\unicode[STIX]{x1D707}}^{\prime }}{H_{t}}=\bar{\ell }_{g}+\left[\frac{\unicode[STIX]{x1D707}}{\unicode[STIX]{x1D707}_{g}}\right]^{-3/4}Oh^{1/4},\quad \bar{\ell }_{g}\propto We_{\unicode[STIX]{x1D706}}(1+K_{a}\,We^{1/12}\,Oh^{1/2})^{-1}.\end{eqnarray}$$
In the limit
 $\bar{\ell }_{g}/\bar{\ell }_{\unicode[STIX]{x1D707}}\ll 1\equiv We_{\unicode[STIX]{x1D706}}\ll [\unicode[STIX]{x1D707}_{g}/\unicode[STIX]{x1D707}]^{3/4}Oh^{1/4}$
, with
 $We_{\unicode[STIX]{x1D706}}$
defined in (2.1), the approximate values of the constants in (2.15) are
 $a\simeq 4\bar{\ell }_{\unicode[STIX]{x1D707}}$
,
 $b\simeq 3\bar{\ell }_{g}$
and hence, since
 $-aC_{2}=-bC_{3}=1/2$
(see (2.16)), the expression for
 $K_{l}$
in (2.14) can be simplified to
 $$\begin{eqnarray}K_{l}\simeq \ln [A(\bar{\ell }_{\unicode[STIX]{x1D707}}\bar{\ell }_{g})^{-1}]=\ln \left[A\left(\frac{\unicode[STIX]{x1D707}}{\unicode[STIX]{x1D707}_{g}}\right)^{3/4}Oh^{-1/4}\,We_{\unicode[STIX]{x1D706}}^{-1}\right],\end{eqnarray}$$
where we have made use of (2.20), we have assumed that
 $6/\tan ^{2}\unicode[STIX]{x1D6FC}=2$
,
 $A$
is a fitting constant, and where the term proportional to
 $K_{a}$
in (2.20) has been neglected in this case because
 $Oh\ll 1$
.
However, when
 $\bar{\ell }_{g}\gtrsim \bar{\ell ^{\prime }}_{\unicode[STIX]{x1D707}}\equiv We_{\unicode[STIX]{x1D706}}\gtrsim [\unicode[STIX]{x1D707}_{g}/\unicode[STIX]{x1D707}]^{3/4}Oh^{1/4}$
,
 $a\simeq 6\bar{\ell }_{g}$
,
 $b\simeq 2\bar{\ell }_{g}$
,
 $-aC_{2}\simeq 1$
and
 $-bC_{3}\simeq 0$
(see (2.15)–(2.16)) then equation (2.14) simplifies in this limit to
 $$\begin{eqnarray}\displaystyle K_{l} & \simeq & \displaystyle 2[\ln (1+6\bar{\ell }_{g})+\ln (6\bar{\ell }_{g})^{-1}]\simeq 2\left[\ln \left(\frac{H_{t}}{C\unicode[STIX]{x1D706}}\right)+\ln \left(1+\frac{C\unicode[STIX]{x1D706}}{H_{t}}\right)\right]\nonumber\\ \displaystyle & \simeq & \displaystyle 2\left[\ln \left(\frac{1+K_{a}\,We^{1/12}\,Oh^{1/2}}{C\,We_{\unicode[STIX]{x1D706}}}\right)+\ln \left(1+C\,We_{\unicode[STIX]{x1D706}}\right)\right],\end{eqnarray}$$
with
 $C$
a fitting constant and
 $6/\tan ^{2}\unicode[STIX]{x1D6FC}=2$
.
To check the validity of our description, we compare the splash threshold velocities calculated using (2.12) with the experimental values given in Xu et al. (Reference Xu, Zhang and Nagel2005), Palacios et al. (Reference Palacios, Hernandez, Gomez, Zanzi and Lopez2013), Riboux & Gordillo (Reference Riboux and Gordillo2014), Stevens (Reference Stevens2014), de Goede et al. (Reference de Goede, Laan, de Bruin and Bonn2018) and Hao et al. (Reference Hao, Lu, Lee, Wu, Hu and Floryan2019). For that purpose, we calculate
 $K_{l}$
using either (2.21) if
 $We_{\unicode[STIX]{x1D706}}<3[\unicode[STIX]{x1D707}_{g}/\unicode[STIX]{x1D707}]^{3/4}Oh^{1/4}$
or (2.22) if
 $We_{\unicode[STIX]{x1D706}}>3[\unicode[STIX]{x1D707}_{g}/\unicode[STIX]{x1D707}]^{3/4}Oh^{1/4}$
. At normal atmospheric conditions,
 $\ell _{g}$
is rather smaller than
 $\ell _{\unicode[STIX]{x1D707}}^{\prime }$
and, hence,
 $K_{l}$
is calculated using (2.21). Figure 2(a) shows that the agreement between experiments and predictions is excellent for the vast majority of fluids investigated: including ethanol, water–ethanol mixtures, water–glycerol mixtures and pure water (see table 1). There are cases, however, in which the agreement between theory and experiments is not so good – and even poor. Indeed, the open symbols in figure 2(a), which represent the splashing velocity of water droplets impacting superhydrophobic substrates, notably deviate from the values of
 $V^{\ast }$
predicted using (2.12). The reason for this discrepancy relies on the fact that, for this type of substrate, the edge of the expanding liquid rim is never in contact with the solid and the equation describing the splash transition notably differs from (2.12), as is explained in Quintero, Riboux & Gordillo (Reference Quintero, Riboux and Gordillo2019), where an excellent agreement between the predicted and measured values of
 $V^{\ast }$
is reported.
Values of the material properties of the liquids, the critical velocities for splashing
 $V^{\ast }$
, the corresponding Reynolds numbers
 $Re=\unicode[STIX]{x1D70C}RV^{\ast }/\unicode[STIX]{x1D707}$
, the Ohnesorge numbers
 $Oh=\sqrt{We}/Re=\unicode[STIX]{x1D707}/\sqrt{\unicode[STIX]{x1D70C}R\unicode[STIX]{x1D70E}}$
and the type of solid substrate, used to plot figure 2. (a) Acetone, (b) water, (c) methanol, (d) ethanol, (e) decamethyltetrasiloxane, (f) dodecamethylpentasiloxane. The angle formed by the substrate with the horizontal is
 $\unicode[STIX]{x1D712}=0$
for [1] Riboux & Gordillo (Reference Riboux and Gordillo2014), [2] de Goede et al. (Reference de Goede, Laan, de Bruin and Bonn2018) and [3] Palacios et al. (Reference Palacios, Hernandez, Gomez, Zanzi and Lopez2013) and
 $\unicode[STIX]{x1D712}\in [0,\unicode[STIX]{x03C0}]$
for [4] Hao et al. (Reference Hao, Lu, Lee, Wu, Hu and Floryan2019). In reference [5] Quintero et al. (Reference Quintero, Riboux and Gordillo2019), SHydro means Superhydrophobic.

(a) Comparison between the experimental splash threshold velocities on horizontal substrates at normal atmospheric conditions (see table 1) and the values predicted using (2.12) and (2.21). Open symbols represent the splash threshold velocities on superhydrophobic substrates: the experimental values of
 $V^{\ast }$
corresponding to these cases cannot be predicted by the present theory, but by the one presented in Quintero et al. (Reference Quintero, Riboux and Gordillo2019). (b) Values of
 $\unicode[STIX]{x1D6FC}$
making the predicted velocity in figure (a) coincide with the experimental one (i.e.
 $\unicode[STIX]{x1D6FC}$
is such that
 $V_{th}^{\ast }=V^{\ast }$
). Observe that, in all cases considered,
 $\unicode[STIX]{x1D6FC}=60^{\circ }\pm 3.6^{\circ }$
; namely, the wedge angle varies
 $\pm 6\,\%$
around
 $60^{\circ }$
. (c) Comparison between the experimental splash threshold velocities on inclined substrates measured by Hao et al. (Reference Hao, Lu, Lee, Wu, Hu and Floryan2019) at normal atmospheric conditions and the values predicted using (2.12) and (2.21). The symbol (○) and the dashed line represent, respectively, the measured and the calculated velocity for downward splashing (
 $\unicode[STIX]{x1D703}=0$
), whereas (▫) and the continuous line indicate the measured and predicted velocity for upward splashing (
 $\unicode[STIX]{x1D703}=\unicode[STIX]{x03C0}$
) (see figure 1
a). In (a–c),
 $A=0.011$
,
 $\unicode[STIX]{x1D6FC}=60^{\circ }$
.

(a) Comparison between the experimental data in Xu et al. (Reference Xu, Zhang and Nagel2005) and Hao et al. (Reference Hao, Lu, Lee, Wu, Hu and Floryan2019) and the predicted splash threshold velocity using the expressions for
 $K_{l}$
given by either (2.21) or by (2.22). (b,c) Comparison between the experimental splash threshold velocities at reduced atmospheric conditions measured by Xu et al. (Reference Xu, Zhang and Nagel2005), Stevens (Reference Stevens2014) and Hao et al. (Reference Hao, Lu, Lee, Wu, Hu and Floryan2019) (see table 2), and the values predicted using (2.12), (2.21) and (2.22). In (a–c),
 $\unicode[STIX]{x1D712}=0$
,
 $\unicode[STIX]{x1D6FC}=60^{\circ }$
,
 $A=0.011$
,
 $C=19$
and
 $K_{a}=0.7$
. The deviations observed between the predicted and experimental values corresponding to orange symbols in panels (b) and (c) can be attributed to slight variations of the wedge angle
 $\unicode[STIX]{x1D6FC}$
(see the supplementary material for details).

This example clearly shows that splashing is influenced by the wetting properties of the solids used; this fact being further confirmed by the experimental results in de Goede et al. (Reference de Goede, Laan, de Bruin and Bonn2018), who found, for the case of partially wetting substrates, that the splash threshold velocity increases slightly for decreasing values of the static contact angle (see figures 2
a,b). This trend is also observed in the experimental points corresponding to methanol and acetone – liquids with very small values of the viscosity and for which the static contact angle is close to zero (see the lighter symbols in figure 2
a). All the experimental evidence indicates that the wedge angle
 $\unicode[STIX]{x1D6FC}$
is influenced by the wetting properties of the substrate: indeed, it is shown in figure 2(b) and is further checked in the supplementary material that the predicted values of
 $V^{\ast }$
would perfectly reproduce the experimental ones if
 $\unicode[STIX]{x1D6FC}$
was allowed to vary within the range of values
 $60^{\circ }\pm 3.6^{\circ }$
(i.e. within a 6 % of variation around
 $60^{\circ }$
). In figure 2(b), notice that the larger values of
 $\unicode[STIX]{x1D6FC}$
correspond to the smaller values of the static contact angle and to the smaller values of the liquid viscosity. Thus, the dependence of
 $\unicode[STIX]{x1D6FC}$
on the wetting properties of the solid and the material properties of the liquid is qualitatively similar to that exhibited by the apparent contact angle (Snoeijer & Andreotti Reference Snoeijer and Andreotti2013). Let us point out that an attempt to link
 $\unicode[STIX]{x1D6FC}$
with the apparent contact angle was already done in Riboux & Gordillo (Reference Riboux and Gordillo2014), where the shape of the advancing liquid wedge as well as the value of the critical capillary number were predicted using the theory presented in Marchand et al. (Reference Marchand, Chan, Snoeijer and Andreotti2012), which extends the previous theory by Cox (Reference Cox1986). We found, however, that the lubrication approximation predicts that air entrainment is produced for values of the capillary number smaller than those for which the splash transition is experimentally observed. These results led us to conclude in Riboux & Gordillo (Reference Riboux and Gordillo2014) that: (i) dewetting is a necessary but not sufficient condition for splashing and also that (ii) the wedge angle
 $\unicode[STIX]{x1D6FC}$
cannot be calculated using either the lubrication theory in Riboux & Gordillo (Reference Riboux and Gordillo2014) or the more recent by Kamal et al. (Reference Kamal, Sprittles, Snoeijer and Eggers2019). Indeed, the lubrication approximation is not adequate to describe the flow at the wedge because the time scales associated with droplet splashing are so short that viscous effects in the liquid are confined to thin boundary layers (as sketched in figure 1
c), whereas, in Stokes flow, the momentum diffuses so efficiently across the liquid that boundary layers do not exist. Therefore, new theories retaining inertia and the highly transient nature of splashing or, alternatively, simulations of the type reported in Sprittles (Reference Sprittles2017) would be needed to predict the value of
 $\unicode[STIX]{x1D6FC}$
as a function of the wetting properties of the solid substrate and the material properties of the two fluids involved.
Physical properties of the different liquids and gases used to plot figure 3. Here,
 $T_{g0}=298.15$
K and
 $P_{g0}=10^{5}$
Pa. Therefore, for arbitrary values of the gas temperature
 $T_{g}$
and pressure
 $P_{g}$
,
 $\unicode[STIX]{x1D706}=\unicode[STIX]{x1D706}_{0}(T_{g}/T_{g0})(P_{g0}/P_{g})$
. [1] Xu et al. (Reference Xu, Zhang and Nagel2005), [2] Hao et al. (Reference Hao, Lu, Lee, Wu, Hu and Floryan2019) and [3] Stevens (Reference Stevens2014).

This said, in spite of its simplicity, our model is in good agreement with the experimental measurements depicted in figure 2(a) and nicely reproduces the experimental splash transition on inclined substrates reported by Hao et al. (Reference Hao, Lu, Lee, Wu, Hu and Floryan2019) (see figure 2
c); the good agreement between experiments and predictions is also captured by the modification in Hao et al. (Reference Hao, Lu, Lee, Wu, Hu and Floryan2019) of our original analysis in Riboux & Gordillo (Reference Riboux and Gordillo2014). In addition, our theory also predicts the spreading–splashing–spreading–splashing transition for reduced atmospheric pressures and increasing impact velocities, first reported by Xu et al. (Reference Xu, Zhang and Nagel2005) and later confirmed by Stevens (Reference Stevens2014) and Hao et al. (Reference Hao, Lu, Lee, Wu, Hu and Floryan2019) (see figure 3). Indeed, for the larger values of
 $P_{g}$
, the curves in solid lines in figure 3 have been calculated as those in figure 2, using (2.21) with
 $A=11\times 10^{-3}$
but, since the mean free path of gas molecules varies with pressure as
 $\unicode[STIX]{x1D706}\propto P_{g}^{-1}$
, the slip length at the solid wall becomes larger than
 $\ell _{\unicode[STIX]{x1D707}}^{\prime }$
for reduced pressures and hence, when
 $We_{\unicode[STIX]{x1D706}}>3[\unicode[STIX]{x1D707}_{g}/\unicode[STIX]{x1D707}]^{3/4}Oh^{1/4}$
,
 $K_{l}$
is calculated using (2.22), with
 $C=19.0$
and
 $K_{a}=0.7$
. Notice that, under rarefied gas conditions, the effect of the boundary layer thickness, quantified through the term proportional to
 $K_{a}$
in (2.22), needs to be retained in the expression of
 $K_{l}$
.
The physical interpretation of the results depicted in figure 3, which illustrate the non-monotonicity of the splash threshold velocity at reduced atmospheric pressures, is provided in what follows. First, notice that the vertical lubrication force would diverge logarithmically up to infinity if the slip lengths
 $\ell _{g}$
and
 $\ell _{\unicode[STIX]{x1D707}}^{\prime }$
were equal to zero, but the existence of slip at both the wall and at the gas–liquid interface limits the value of the lubrication force (see (2.14)–(2.15)). The lift force is bounded by the maximum value of either
 $\ell _{\unicode[STIX]{x1D707}}^{\prime }$
or
 $\ell _{g}$
, which are roughly given by (see (2.2) and (2.20))
 $$\begin{eqnarray}\ell _{\unicode[STIX]{x1D707}}^{\prime }\sim H_{t}(\unicode[STIX]{x1D707}_{g}/\unicode[STIX]{x1D707})^{3/4}Oh^{1/4}\sim R\,We^{-1}(\unicode[STIX]{x1D707}_{g}/\unicode[STIX]{x1D707})^{3/4}Oh^{1/4}\quad \text{and}\quad \ell _{g}\propto \unicode[STIX]{x1D706}\propto \unicode[STIX]{x1D706}_{0}(P_{g0}/P_{g}).\end{eqnarray}$$
For gas pressures
 $P_{g}$
of the order of, or slightly below
 $P_{g0}\simeq 100$
kPa,
 $\ell _{g}$
is
 ${\sim}10^{-7}$
m and, thus,
 $\ell _{g}\ll \ell _{\unicode[STIX]{x1D707}}^{\prime }$
. Hence, for moderate values of
 $P_{g}$
, the lubrication force on the wedge is bounded by the slip at the gas–liquid interface associated with the balance of shear stresses. When this happens, the lubrication lift force
 $K_{l}\unicode[STIX]{x1D707}_{g}V_{t}$
depends on
 $P_{g}$
weakly through
 $\unicode[STIX]{x1D706}$
(see (2.21)) – this being the reason for the large slope of the
 $P_{g}-V^{\ast }$
curve depicted in figure 3(a). However, for a fixed value of
 $P_{g}$
sensibly smaller than
 $P_{g0}$
, say
 $P_{g}\sim 30$
kPa (
 $\unicode[STIX]{x1D706}>\unicode[STIX]{x1D706}_{0}$
is fixed) and increasing impact velocities,
 $\ell _{g}>\ell _{\unicode[STIX]{x1D707}}^{\prime }$
– a fact yielding that the coefficient
 $K_{l}$
in the lubrication lift force,
 $K_{l}\unicode[STIX]{x1D707}_{g}V_{t}$
, decreases strongly when the mean free path becomes of the order of the thickness of the lamella; namely, when the ratio
 $\unicode[STIX]{x1D706}/H_{t}$
increases and becomes of order unity (see (2.22)–(2.23)). Therefore, for low values of the gas pressure
 $P_{g}$
and impact velocities
 $V$
such that
 $H_{t}$
is very small and
 $\ell _{g}\sim \ell _{\unicode[STIX]{x1D707}}^{\prime }$
, the lift force decreases abruptly – a fact explaining the transition from splashing to spreading. However, for even larger impact velocities, the lubrication lift force
 $K_{l}\unicode[STIX]{x1D707}_{g}V_{t}$
increases with
 $V$
because
 $K_{l}$
decreases with
 $V$
but only logarithmically – a fact explaining the second transition from spreading to splashing for very large impact velocities.
As a final remark, let us point out that the theoretical approach presented here, obtained by setting the multiplicative constant
 $K_{u}$
affecting the aerodynamic lift term
 $K_{u}\unicode[STIX]{x1D70C}_{g}V_{t}^{2}H_{t}$
equal to zero, is a simplification revealing that we overestimated the relative importance of this term in Riboux & Gordillo (Reference Riboux and Gordillo2014), where we reported that
 $K_{u}=0.3$
. But the approach used here does not mean that, in physical terms, the aerodynamic lift is zero: indeed, Jian et al. (Reference Jian, Josserand, Popinet, Ray and Zaleski2018) confirmed numerically our original result that splashing can be enhanced thanks to the aerodynamic lift. This conclusion is further supported in the supplementary material, where the comparison with the experimental results by Hao et al. (Reference Hao, Lu, Lee, Wu, Hu and Floryan2019) reveals that the magnitude of
 $K_{u}$
is only 10 % of the value we provided in Riboux & Gordillo (Reference Riboux and Gordillo2014) – a fact explaining why the available experiments in the literature can be explained by setting
 $K_{u}=0$
.
3 Concluding remarks
Making use of the model developed in Riboux & Gordillo (Reference Riboux and Gordillo2014) and Riboux & Gordillo (Reference Riboux and Gordillo2017), and thanks to the recent experimental results obtained by Hao et al. (Reference Hao, Lu, Lee, Wu, Hu and Floryan2019), here we provide a more accurate expression for the lift force exerted by the gas on the edge of the expanding lamella. We have shown that the expression for the lift force depends crucially on the value of the ratio
 $\ell _{\unicode[STIX]{x1D707}}^{\prime }/\ell _{g}$
, with
 $\ell _{\unicode[STIX]{x1D707}}^{\prime }$
the slip length at the gas–liquid interface and
 $\ell _{g}$
the slip length at the solid wall. It is precisely when
 $\ell _{\unicode[STIX]{x1D707}}^{\prime }\sim \ell _{g}$
that drops falling on a smooth substrate exhibit the spreading–splashing–spreading–splashing transition for a fixed value of the atmospheric pressure and increasing values of the impact velocity already reported by Xu et al. (Reference Xu, Zhang and Nagel2005), Stevens (Reference Stevens2014) and Hao et al. (Reference Hao, Lu, Lee, Wu, Hu and Floryan2019).
In addition, we provide an equation expressing the splash threshold velocity
 $V^{\ast }$
as a function of the inclination angle of the substrate, the drop radius
 $R$
, the material properties of the liquid and the gas, and the mean free path of gas molecules, which is in good quantitative agreement with experiments.
Acknowledgements
This work has been supported by the Spanish MINECO under Project DPI2017–88201–C3–1–R, partly financed through European funds.
Supplementary material
Supplementary material is available at https://doi.org/10.1017/jfm.2019.396.