1 Introduction
The phenomenon of illusory vowels has received a great deal of attention in recent literature (e.g. Dupoux et al. Reference Dupoux, Kakehi, Hirose, Pallier and Mehler1999, Dehaene-Lambertz et al. Reference Dehaene-Lambertz, Dupoux and Gout2000, Berent et al. Reference Berent, Steriade, Lennertz and Vaknin2007, Kabak & Idsardi Reference Kabak and Idsardi2007, Berent et al. Reference Berent, Lennertz, Smolensky and Vaknin-Nusbaum2009, Monahan et al. Reference Monahan, Takahashi, Nakao, Idsardi, Iwasakai, Hoji, Clancy and Sohn2009, Dupoux et al. Reference Dupoux, Parlato, Frota, Hirose and Peperkamp2011). The general finding of these studies is that listeners sometimes perceive illusory vowels in stimuli containing consonant sequences that are phonotactically illicit in their native languages. When a native speaker is presented with a nonsense word containing a consonant sequence that violates the phonotactic constraints in their language, an illusory vowel is perceptually induced between the consonants, thereby creating an illusory sequence that respects the phonotactic constraints of the language. For example, when a Japanese listener is auditorily presented with [ebzo], they may actually perceive [ebᵚzo], given that [bz] is an illicit consonant sequence in Japanese, as shown by Dupoux et al. (Reference Dupoux, Kakehi, Hirose, Pallier and Mehler1999).
As discussed by Dupoux et al. (2011), the contextual and phonetic effects observed with illusory vowels are difficult to account for in most current psycholinguistic models of speech recognition, in which the primary units are segments and phonological/phonetic features (McClelland & Elman Reference McClelland and Elman1986, Kuhl Reference Kuhl, de Boysson-Bardies, de Schonen, Jusczyk, MacNeilage and Morton1993, Best Reference Best, Goodman and Nusbaum1994, Lahiri & Reetz Reference Lahiri, Reetz, Gussenhoven and Warner2002, Reference Lahiri and Reetz2010, Norris & McQueen Reference Norris and McQueen2008). They suggest that this can be remedied by having phonotactic constraints which refer to surface sequences of segments interact with categorisation in a single processing step. We argue in this article that the phenomenon of illusory vowels shows that, along with surface phonotactic constraints and phonetic representations, there is also a need to take into account the phonological alternations present in a language in understanding speech perception. Inspired by Bayesian models of speech perception (e.g. Feldman & Griffiths Reference Feldman, Griffiths, McNamara and Trafton2007, Bever & Poeppel Reference Bever and Poeppel2010, Sonderegger & Yu Reference Sonderegger, Yu, Ohlsson and Catrambone2010, Poeppel & Monahan Reference Poeppel and Monahan2011, Yu Reference Yu2011, Wilson & Reference Wilson and DavidsonDavidson in press), we claim that the task of the listener in speech perception is primarily one of reverse inference: it is to identify the best estimate of the intended underlying categories of the utterance for the incoming acoustic token.Footnote 1 In this case, the underlying category information we make reference to is the phonemic representation. The knowledge about which underlying categories map to which surface categories must include information about both phonological alternations and phonotactic constraints, which are therefore both expected to play a role in speech perception, along with the phonetic characteristics of the language. As we show below, the actual quality of the illusory vowels in different contexts is modulated by the phonological processes of the language.
More generally, related work has argued for the need for the speech-perception mechanism to be sensitive to phonological alternations (Huang Reference Huang2001, Hume & Johnson Reference Hume and Johnson2003, Boomershine et al. Reference Boomershine, Hall, Hume, Johnson, Avery, Dresher and Rice2008, Johnson & Babel Reference Johnson and Babel2010). For example, Huang (Reference Huang2001) shows that the tone-sandhi alternation involving the contextual neutralisation of two otherwise contrastive tones in Mandarin Chinese (the low-falling-rising tone and the mid-rising tone) causes the two tones to be perceptually closer, and therefore more easily confusable for Mandarin Chinese listeners. In this article we extend the line of work that argues for the importance of phonological alternations in speech perception by showing that the concept is crucial in understanding the phenomenon of illusory vowels. Furthermore, we also present a particular point of view that can naturally account for such phonological sensitivity in speech perception.
As has been pointed out previously, a proper understanding of the phenomenon of illusory vowels, and of speech perception more generally, has a direct bearing on the theoretical literature on loanword adaptations, where there has been an extensive debate on the factors involved (e.g. Peperkamp Reference Peperkamp2005, Davidson Reference Davidson2007). Whereas some have claimed that perceptual factors are perhaps the primary factor influencing loanword-adaptation patterns (Peperkamp & Dupoux Reference Peperkamp and Dupoux2003, Peperkamp Reference Peperkamp2005), others have argued that perception is at best a minor factor in such patterns (Paradis & LaCharité Reference Paradis and LaCharité1997, Jacobs & Gussenhoven Reference Jacobs, Gussenhoven, Dekkers, van der Leeuw and van de Weijer2000, LaCharité & Paradis Reference LaCharité and Paradis2005, Uffmann Reference Uffmann2006). The account proposed here suggests, contrary to these claims, that the perceptual mechanism uses the phonological system for inference in some detail, and it is therefore perhaps impossible to separate the effects of speech perception on loanword patterns from those of the phonological system.
With respect to the locus of perceptual epenthesis, while earlier work in the domain of illusory vowels (Dupoux et al. Reference Dupoux, Kakehi, Hirose, Pallier and Mehler1999, Dehaene-Lambertz et al. Reference Dehaene-Lambertz, Dupoux and Gout2000) assumed that the relevant constraints driving the perceptual illusions were sequential phonotactic constraints, Kabak & Idsardi (Reference Kabak and Idsardi2007) argue that the relevant phonotactic constraints driving such perceptual illusions are the syllable-structure constraints of the language.Footnote 2 They ran an AX discrimination task using Korean speakers (with English speakers as controls), with two types of illicit consonant sequences. In one, the first consonant, C1, was an illicit coda consonant in Korean, and the corresponding consonant sequence, C1C2, was also illicit. In the other, C1 was a licit coda consonant, but the corresponding consonant sequence was illicit. They show that the perception of illusory vowels was consistently triggered by the first type of consonant sequence, but not by the second. They therefore argue that the illusory vowel phenomenon is better accounted for by syllable-structure constraints than by the surface consonant-sequence constraints of the language.
It has also been argued that the perception of illusory vowels is affected by the listener's knowledge of language universals related to the Sonority Sequencing Principle and syllable structure. In a series of experiments on Korean and English speakers, Berent and her colleagues show that universally dispreferred initial consonant sequences trigger a stronger perception of illusory vowels than universally preferred initial consonant sequences, even when neither sequence occurs in the subject's native language (Berent et al. Reference Berent, Steriade, Lennertz and Vaknin2007, Berent et al. Reference Berent, Lennertz, Jun, Moreno and Smolensky2008, Berent et al. Reference Berent, Lennertz, Smolensky and Vaknin-Nusbaum2009). For example, both [lb] and [bl] are illicit initial consonant sequences in Korean; however, only the former is a universally dispreferred sequence across the world's languages (Sievers Reference Sievers1881, Jespersen Reference Jespersen1904, Hooper Reference Hooper1976, Steriade Reference Steriade1982, Selkirk Reference Selkirk, Aronoff and Oerhle1984). Berent and her colleagues show that Korean speakers more readily misperceive the former than the latter.
Related work has shown that perceptual distortions are also driven by more abstract consonant-sequence constraints. Moreton (Reference Moreton2002) demonstrates that subjects make use of abstract featural co-occurrence constraints, showing that English speakers misperceive words beginning with [dl] much more often than those with [bw], though both are nearly zero-probability sequences in English. He argues that the asymmetry results from a specific featural co-occurrence constraint in English, a ban on two adjacent coronal consonants, which does not apply to a sequence of two adjacent labial consonants.Footnote 3
It has also been shown that illusory vowels are only one of the many possible perceptual repairs for phonotactically illegal consonant sequences (Hallé et al. Reference Hallé, Segui, Frauenfelder and Meunier1998, Davidson Reference Davidson2007, Davidson & Shaw Reference Davidson and Shaw2012). Davidson & Shaw (Reference Davidson and Shaw2012) show that when English subjects are auditorily presented with phonotactically illicit initial consonant sequences, they ‘repair’ the sequences in a variety of ways, including consonant deletion, metathesis, prothesis, consonant change and perception of illusory vowels.Footnote 4 They further show that the likelihood of a particular repair was affected by the type of illicit consonant sequence presented to the subject.
As can be seen from the above review, the bulk of previous research assumes that perceptual epenthesis of illusory vowels is driven purely by surface phonotactics and the phonetic characteristics of acoustic tokens. However, this is not to say that there is no evidence of abstract knowledge being used.Footnote 5 As discussed above, Moreton (Reference Moreton2002), Berent et al. (Reference Berent, Steriade, Lennertz and Vaknin2007), Berent et al. (Reference Berent, Lennertz, Jun, Moreno and Smolensky2008) and Berent et al. (Reference Berent, Lennertz, Smolensky and Vaknin-Nusbaum2009) have indeed shown that listeners access relatively abstract knowledge. However, the knowledge that listeners seem to be using could be making reference to surface representations in a phonological sense (rather than to the acoustic/auditory signal), since Berent and colleagues' Sonority Sequencing Principle and Moreton's constraint on alveolar co-occurrence can both be thought of as surface phonotactic constraints, as is standard in the Optimality Theory tradition. Therefore, on the basis of the results, there is no evidence that a more abstract phonological level of representation, the phonemic level, is accessed during perception.
With respect to the quality of the illusory vowel, Dupoux et al. (2011: 200) argue that it is ‘the phonetically minimal element of the language’, and therefore ‘the shortest vowel’ in the language (e.g. [ᵚ] in Japanese or [i] in Brazilian Portuguese). Their claim predicts that there can be at most one illusory vowel in a language.Footnote 6 We show that this claim is at best only partially consistent with what listeners actually do when encountering illicit sequences. We show that the quality of the illusory vowel is also modulated by the knowledge of phonological alternations in the language. And in some contexts, it is even possible to trigger more than one illusory vowel, as long as the phonology of the language supports it.
Acoustic studies of Korean have shown that [ᶤ] is the shortest vowel in the language (Han Reference Han1964, Kim Reference Kim1974, Chung et al. Reference Chung, Kim and Huckvale1999).Footnote 7 The typical duration of [ᶤ] in phrase-initial contexts is around 144 ms; the duration of [i] and [i] in similar positions is around 160 ms and 165 ms respectively (Chung et al. Reference Chung, Kim and Huckvale1999). Given Dupoux et al.'s (2011) claim that the phonetically minimal element or shortest vowel is the illusory vowel, one would expect [ᶤ] to be the illusory vowel in all contexts.
We propose in what follows that, while it is certainly true that surface phonotactics and the phonetic characteristics of acoustic tokens have an effect on perceptual epenthesis, the quality of the illusory vowel also depends on the phonological alternations in the language. As briefly discussed above, we take inspiration from Bayesian models of speech perception (Feldman & Griffiths Reference Feldman, Griffiths, McNamara and Trafton2007, Bever & Poeppel Reference Bever and Poeppel2010, Sonderegger & Yu Reference Sonderegger, Yu, Ohlsson and Catrambone2010, Poeppel & Monahan Reference Poeppel and Monahan2011, Yu Reference Yu2011, Wilson & Davidson in press) in claiming that the task of the listener in speech perception is primarily one of reverse inference – it is to identify the best estimate of the intended underlying categories (phonemic representations) of the utterance, given the acoustic token.Footnote 8 Knowledge of both phonological alternations and phonotactic constraints is required to reverse infer the phonemic representations from the acoustic tokens. Therefore, both phonological alternations and phonotactic constraints are expected to play a role in speech perception, along with the phonetic characteristics of the language.
More specifically, in regard to the quality of the illusory vowel, we see the perceiver's task as being an attempt to repair the illicit phonotactic sequence with a vowel phoneme that best maps onto the phonetic characteristics of the acoustic token. When there are no relevant phonological alternations to bias listeners towards a certain vowel in a particular segmental context, the best guess to repair the particular phonotactic violation is indeed the phonetically minimal/shortest vowel in the inventory, à la Dupoux et al. (Reference Dupoux, Parlato, Frota, Hirose and Peperkamp2011). This is because the shortest vowel is, in terms of duration, the closest in the inventory to the absence of a vowel. The illicit consonant sequences tested by Dupoux et al. were of the form V1C1C2V2. In Japanese and Brazilian Portuguese, consonantal sequences triggering the perception of illusory vowels, such as [bd bg gn], do not appear to be influenced by any phonological alternations relevant to the process of perceptual epenthesis (i.e. alternations that bias listeners towards a certain vowel), so the best vowel guesses for the perceiver are the phonetically minimal vowels in the respective languages. However, when relevant phonological alternations do bias listeners towards particular vowel percepts in a specific segmental context, the best guess depends on both the phonetics of the acoustic token and the phonological alternations themselves. The types of phonological processes that are likely to play a role are those that bias the listener's expectations about the quality of the illusory vowel. One such process is a regular vowel-deletion process targeting a particular vowel (/V1/→[∅]). The presence of such a process in the phonology of the language supports the reverse inference of the same vowel in the phonemic representation when the phonetic signal has nothing (reverse inference: [∅]→/V1/).Footnote 9 For these reasons, in a phonotactically illicit consonantal context where the condition can be perceptually repaired by a vowel the best vowel to repair the situation is the phoneme /V1/, which maps to [∅] in the surface/acoustic signal. A second type of process that is likely to bias a listener's expectations about the vowel quality of the illusory vowel is one that involves allophonic mappings before a specific vowel (/C1/→[C2] /—V2). In a phonotactically illicit consonantal context where the condition can be perceptually repaired by a vowel, when the phonotactically illicit consonant is the allophone [C2], the consonant inferred is the corresponding phoneme /C1/. In such situations, the best vowel to perceptually repair the context is the vowel /V2/, next to which the phoneme /C1/ surfaces as [C2], as this would also account for the acoustic properties of the illicit consonant.
In what follows, we briefly describe some regular phonological processes in Korean that are relevant for the phonological contexts tested in this paper. These processes exhibit exactly the abovementioned characteristics needed to bias the perception of the illusory vowels. Korean has a phonological vowel-deletion process that targets the high central unrounded vowel /ᶤ/ in certain environments during morphological concatenation (Ahn Reference Ahn1985, Sohn Reference Sohn1999). When, as a result of morpheme concatenation, /ᶤ/ is in a vowel-hiatus situation with another vowel, the /ᶤ/ always deletes, as shown in (1a). Furthermore, /ᶤ/ is often deleted in other contexts in Korean, especially in weak non-initial open syllables (Kim-Renaud Reference Kim-Renaud1987, Kang Reference Kang2003). Therefore, following the logic of reverse inference discussed in detail above, /ᶤ/ is a good vowel for a Korean listener to infer in an acoustic input where a vowel is not present, but is expected on the basis of the phonological patterns of the language. Finally, as mentioned above, /ᶤ/ also has the shortest phonetic duration of all the vowels in the language. These facts allow /ᶤ/, which already varies with ∅ in the phonetic representations, to be a good candidate for perceptual repairs in most contexts.
-
(1)


Furthermore, Korean has a phonological process of palatalisation of alveolar consonants before /i/; for example, /th/ and /ch/ neutralise to [ch], and /s/ surfaces as [∫] before /i/, as shown in (1b) (Ahn Reference Ahn1985, Iverson Reference Iverson, Hargus and Kaisse1993, Sohn Reference Sohn1999).Footnote 11 For a Korean listener, when a palatal stop segment [ch] is encountered in the acoustic token, there are two possible phonemic parses – it can either be from the alveolar stop /th/ or from the palatal stop /ch/, as shown in (2).Footnote 12
-
(2)
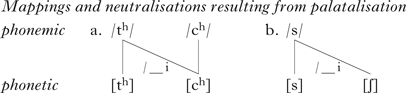
For example, when a Korean listener hears a nonsense word such as [echima], the surface consonant [ch] is consistent with the reverse inference of either /th/ or /ch/; thus the inferred phonemic parses for the nonsense word could be either /ethima/ or /echima/. As proposed above, inferences about the phonemic representations of the presented nonsense words affect the quality of the illusory vowel in illicit phonotactic contexts. More specifically, when a Korean listener encounters a nonsense word with a palatal sound [ch] as the first consonant of an illicit syllable context (e.g. [echma]), the quality of the illusory vowel is modulated by the reverse inference about the phoneme that corresponds to the surface pronunciation [ch] in the nonsense word; if the perceptual system infers the phoneme to be a palatal stop /ch/, the /ᶤ/ vowel (which we refer to as illusory vowel 1) is induced, for the reasons mentioned above; however, if the perceptual system infers the phoneme to be an alveolar stop /th/, then /i/ (illusory vowel 2) is induced in the illicit syllable context, because the only way that phonetic [ch] can result from the phoneme /th/ is if it is followed by /i/. Given this, we expect that the same illicit palatal coda can induce both an illusory /i/ and an illusory /ᶤ/. When an alveolar segment, [th] or [s], is encountered in the acoustic token, there is only one possible phonemic parse, the same alveolar phoneme, /th/ or /s/ respectively, as in (2a). In an illicit syllable context, /ᶤ/ (illusory vowel 1) is perceived, as shown above. Finally, when a palatal fricative, [∫], is encountered in the acoustic token, there is only one possible phonemic parse, the alveolar fricative /s/, as in (2b). However, if an alveolar fricative (/s/) is the inferred phoneme, then /i/ (illusory vowel 2) is perceived in the illicit syllable context, because the only way to get a phonetic [∫] from a phonemic /s/ is to have a following phoneme /i/.
From the above discussion, it should be clear that, unlike Dupoux et al. (Reference Dupoux, Parlato, Frota, Hirose and Peperkamp2011), we predict different sets of illusory vowels in different illicit phonotactic contexts for Korean listeners. In illicit phonotactic contexts following the alveolar consonants [th s], we predict the illusory vowel to be /ᶤ/, in those following the palatal stop [ch], we predict the possibility of both /i/ and /ᶤ/, and in those following the palatal fricative [∫], we predict only the vowel /i/.
In clarification of our position, we would like to note that though we predict the possibility of both /i/ and /ᶤ/ as illusory vowels for Korean listeners in the relevant palatal context [ch], we do not think that both the illusory vowels are simultaneously perceived in the same nonce word by a Korean listener. It is possible that for a single auditory input, two separate nonce-word phonemic percepts are inferred simultaneously, since both are consistent with the acoustic input, where each parse is assigned a certain probability, conditioned by other aspects, such as the lexical frequencies of the relevant phonemes.Footnote 13 It is also possible that for any single presentation of an auditory input only a single percept is inferred in a probabilistic way.
In the following sections, we present the results of three experiments involving identification and discrimination tasks with Korean subjects, with American English subjects as controls to ensure that the differences in the acoustic tokens are not what are driving the perceptual epenthesis effects observed with the Korean subjects. Three different paradigms – an AX task (Experiment 1), an ABX task (Experiment 2) and an identification task (Experiment 3) – were used to ensure that the effects are not artefacts of a particular experimental paradigm.
2 Experiment 1
Experiment 1 investigated perceptual epenthesis effects using an AX task, in which listeners heard two stimuli and decided whether the two stimuli were the same or different. In this paradigm, if listeners perceive an illusory vowel /ᶤ/ between consonants in a cluster [sm], for instance, they will find it difficult to distinguish between [esma] and [esᶤma].Footnote 14 Crucially, as claimed in the previous section, we expect that Korean listeners will have much more difficulty than English listeners in distinguishing the following two sets of stimulus pairs: (a) [ethᶤma–ethma], [esᶤma–esma], [echᶤma–echma], (b) [echima–echma], [e∫ima–e∫ma]. In set (a), the Korean listeners are likely to perceive an illusory /ᶤ/ in the second stimulus in each pair ([ethma, esma, echma]); therefore, for the Korean listeners the pairs in (a) should be more confusable than for English listeners, as they are likely to sound more similar to each other. Similarly, in set (b), the Korean listeners are likely to perceive an illusory /i/ in the second stimulus of each pair ([echma, e∫ma]); for the same reason, the pairs should again be more confusable for the Korean listeners.
2.1 Method
2.1.1 Participants
Twenty native Korean speakers (10 men, 10 women; age 20–38) and 19 native English speakers (8 men, 11 women; age 19–23) participated in the experiment voluntarily. All the subjects were recruited at Michigan State University and reported that they had normal hearing. None of the Korean speakers had learned English before the age of eleven, nor had they lived in English-speaking countries for more than four years, except for one participant who started to learn English at the age of eight in Korea and had lived in the United States for ten years.
2.1.2 Stimuli
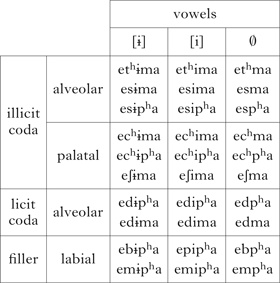
The experimental stimuli consisted of those that were relevant for this article and those that were relevant for another independent hypothesis (see Appendix: Table II for the full list). Thirty nonce words of the form [eC1V1C2] were used, in which C1 was alveolar, palatal or labial [th d s ch ∫ b m], V1 was [ᶤ i ∅] and C2 was a labial stop or nasal [ph m]. None of the stimuli were words in either Korean or in English. They had stress on the first vowel, and were naturalistic recordings by the first author, a trained male phonetician, who is a native speaker of Indian English and Telugu, and a near-native speaker of standard Hindi. There were two reasons for the use of this particular speaker. Firstly, he could naturally produce all the stimuli, as they are phonotactically licit in his dialects of both Hindi and Telugu. The use of a native Korean speaker to record the stimuli would have only been possible if the speaker had neutralised their own linguistic biases, as many of the sequences are not licit in the language. We strongly suspect that the use of Korean speakers to record stimuli would have introduced biases into the stimuli (in the form of very short excrescent vowels), especially for those sequences that are not licit in the relevant language, thereby making the interpretation of the results much more challenging. Secondly, the use of an English speaker to record the stimuli was also avoided, because those that we tried had difficulty in producing unstressed medial vowels that were unreduced (i.e. they couldn't block the vowel-reduction process in their dialect). Furthermore, we did not want to introduce a bias that would help the control group, as the phonetic patterns would have been more natural for the English listeners than for the Korean listeners. The interpretation of the results would therefore have been confounded by this. For these reasons, we used the first author's voice for recording stimuli. Furthermore, the Korean-speaking co-author confirmed that the segmental and suprasegmental quality of the stimuli was naturalistic and consistent between stimuli.
Each item was recorded using Praat (Boersma & Weenink Reference Boersma and Weenink2012), with a Logitech USB desktop microphone (frequency response 100 Hz–16 KHz) at a 44 KHz sampling rate (16-bit resolution; 1 channel). Two tokens were used for each item in the experiment. The stimuli were all normalised in Praat to have a mean intensity of 60 dB, and were then multiplied by a Hanning window applied to the whole stimulus, to induce smooth ramping.
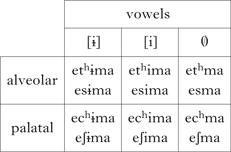
Table I shows all the clusters and the test items relevant to the current paper. All of the test items without intervening vowels, [ethma, esma, echma, e∫ma], had an illicit coda in Korean, and the clusters were also all illicit linear sequencss, so that issues regarding the distinction between syllable-structure violation and surface phonotactic violation did not arise (Kabak & Idsardi Reference Kabak and Idsardi2007). As all the clusters violated both types of phonotactic constraints, they were expected to trigger perceptual epenthesis.
Test tokens in Experiment 1.

2.1.3 Procedure
Following Kabak & Idsardi (Reference Kabak and Idsardi2007) and Monahan et al. (Reference Monahan, Takahashi, Nakao, Idsardi, Iwasakai, Hoji, Clancy and Sohn2009), an AX discrimination (i.e. same/different) task was used to investigate the perceptual epenthesis effect. We tested all combinations of the vowels [ᶤ i ∅]. Thus, for the cluster [sm], the word-pairs were [esᶤma–esima], [esᶤma–esma], [esima–esma], [esᶤma–esᶤma], [esima–esima] and [esma–esma]. The word-pairs with different intervening vowels, such as [esᶤma–esima], served as controls and were expected to be successfully distinguished by all participants.
Two recordings were used for each item. The order of tokens in a word-pair was counterbalanced. For instance, in the case of [esima–esma], there were four ‘different’ word-pairs, [esima1–esma1], [esima1–esma2], [esima2–esma1], [esima2–esma2], and an additional four ‘different’ word-pairs in reverse order. All combinations of ‘same’ word-pairs were also presented. For instance, in the case of [esima], there were four ‘same’ word–pairs: [esima1–esma1], [esima1–esma2], [esima2–esima1], [esima2–esima2]. Each of the above word-pairs was presented twice, giving a total of 720 test trials in the experiment.
The experiment was conducted individually in a quiet room, using a laptop computer. The stimuli were presented to each participant through an AX discrimination task scripted in Praat with a low-noise headset (Koss R80 headphones). The participants were asked to listen to stimuli word-pairs to determine whether the two stimuli were the ‘same’ or ‘different’, and click on the corresponding box on the screen with a mouse. Before the actual experiment, each participant completed a practice session to ensure familiarity with the task. The practice session had nine trials with another set of nonce words, [emᶤma], [emima] and [emma], which were not used in the actual experiment.Footnote 15 Both the interstimulus interval and the intertrial interval were 1000 ms. All the trials were randomised for each participant. The subjects were allowed to take a break after every 240 trials (roughly every 15 minutes); thus there were two breaks. Each subject took approximately 45 minutes to complete the experiment.
2.2 Results
As in Kabak & Idsardi (Reference Kabak and Idsardi2007) and Monahan et al. (Reference Monahan, Takahashi, Nakao, Idsardi, Iwasakai, Hoji, Clancy and Sohn2009), we took poorer discriminability between word-pairs with and without vowels, indicated by lower A′, to suggest the induction of an illusory vowel (A′ ≈ 0·5 reflects no discriminability; A′ ≈ 1 reflects little to no confusion between word-pairs). A′ is a non-parametric measure of discriminability that takes into account response bias (Pollack & Norman Reference Pollack and Norman1964, Macmillan & Creelman Reference Macmillan and Creelman2005). A′ is presented instead of its parametric counterpart, d′, because with AX tasks it is actually not possible to assess if the d′ parametric assumptions are upheld, and at least in some AX tasks the assumptions are not tenable (Stanislaw & Todorov Reference Stanislaw and Todorov1999). When the parametric assumptions are violated, d′ is liable to vary with response bias (Stanislaw & Todorov Reference Stanislaw and Todorov1999).
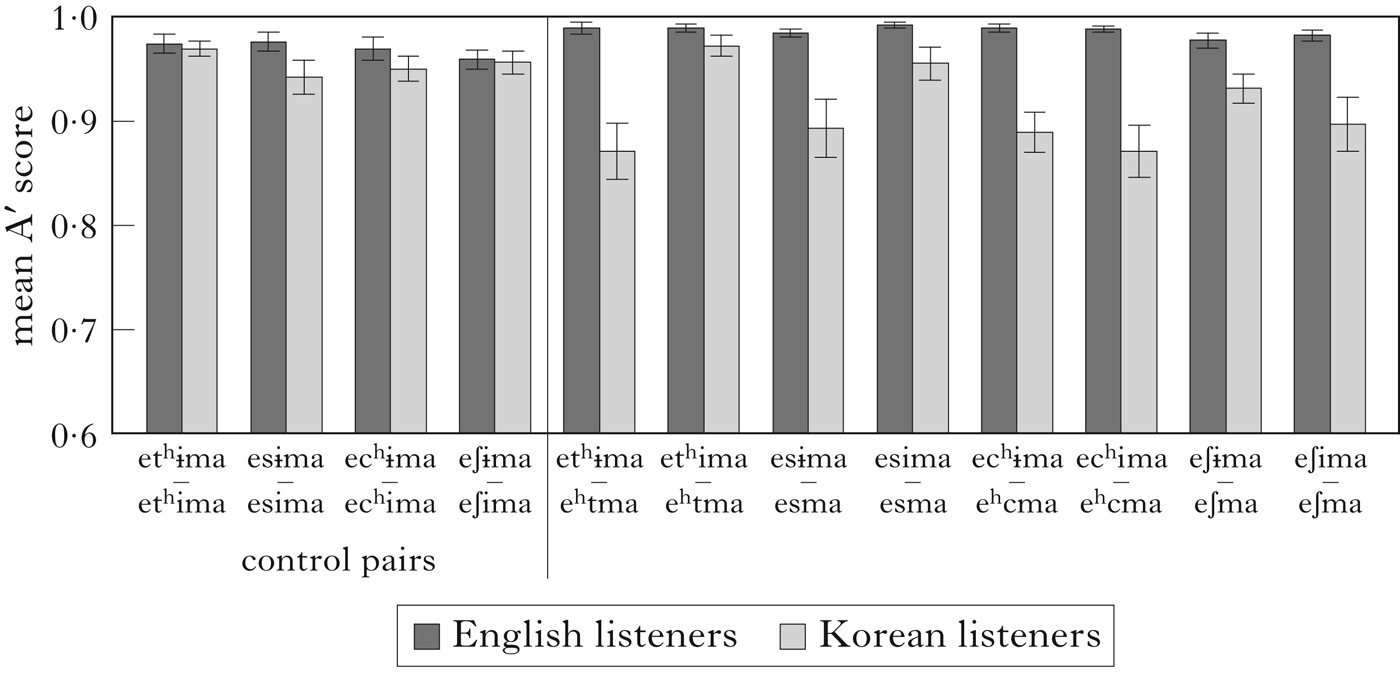
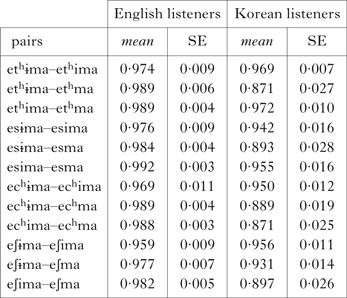
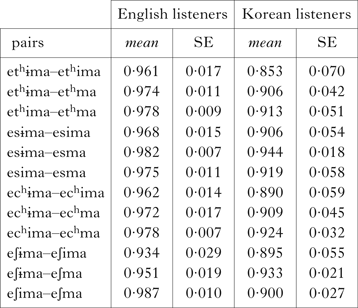
Figure 1 shows average A′ scores for English and Korean listeners on all the relevant word-pairs (see Appendix: Table III for the values). The A′ scores for the control [ᶤ–i] word-pairs ranged between 0·942 and 0·976, suggesting that both groups were successfully able to distinguish the control word-pairs which had two items with a different vowel.
Mean Aˊ (discriminability) values for English and Korean listeners in Experiment 1. Error bars represent standard errors.

Statistical analyses were conducted using SPSS. As Mauchly's test showed that the assumption of sphericity was violated for the main effects of Word-pair (χ2(65)=326·528, p<0·001), degrees of freedom were corrected using Greenhouse-Geisser (ε=0·330). A mixed ANOVA of A′ scores revealed a main effect of Language (F(1,37)=16·042, p<0·001, ηp2=0·302), a main effect of Word-pair (F(3·634,134·460)=5·020, p=0·001, ηp2=0·119) and an interaction of Word-pair by Language (F(3·634,134·460)=7·809, p<0·001, ηp2=0·174). The Korean listeners therefore achieved significantly lower A′ scores than the English listeners for some word-pairs, but not others.
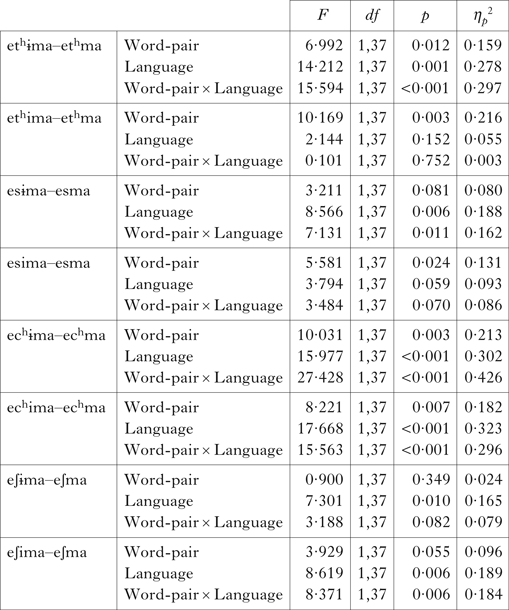
In order to investigate for which word-pairs the performance of the two groups of listeners differed statistically from the control [ᶤ–i] pairs, we ran repeated measures ANOVAs to compare A′ values for Korean and English listeners against average control A′. We used the average of all the control A′ scores, since it is a more accurate estimate than the A′ of an individual control word-pair (see Appendix: Table IV for the ANOVA results). Therefore, in the post hoc ANOVAs presented below, the factor Word-pair had two levels (i.e. average control A′ and the relevant test pair).
When the two language groups' A′ scores for [ethᶤma–ethma] were compared against the control A′ scores, there was a main effect of Word-pair (F(1,37)=6·992, p=0·012, ηp2=0·159), a main effect of Language (F(1,37)=14·212, p=0·001, ηp2=0·278) and a significant interaction between Word-pair and Language (F(1,37)=15·594, p<0·001, ηp2=0·297). On the other hand, in the comparison between [ethima–ethma] and the controls for the two language groups, there was a main effect of Word-pair (F(1,37)=10·169, p=0·003, ηp2=0·216), no main effect of Language (F(1,37)=2·144, p=0·152, ηp2=0·055) and no interaction between Word-pair and Language (F(1,37)=0·101, p=0·752, ηp2=0·003). This suggests that, compared to the English listeners, the Korean listeners performed significantly worse on [ethᶤma–ethma] than on the control pairs, but not on [ethima–ethma].
A similar pattern was observed when the A′ scores of [esᶤma–esma] and [esima–esma] were compared against the control A′ scores. When the two listener groups' A′ scores of [esᶤma–esma] were compared against the control A′ scores, there was no main effect of Word-pair (F(1,37)=3·211, p=0·081, ηp2=0·08), but there was a main effect of Language (F(1,37)=8·566, p=0·006, ηp2=0·188) and an interaction between Word-pair and Language (F(1,37)=7·131, p = 0·011, ηp2=0·162). In contrast, when [esima–esma] were compared to controls for the two language groups, there was a main effect of Word-pair (F(1,37)=5·581, p=0·024, ηp2=0·131), but not of Language (F(1,37)=3·794, p=0·059, ηp2=0·093), and no interaction between Word-pair and Language (F(1,37)=3·484, p=0·07, ηp2=0·086). In summary, for word-pairs with an alveolar cluster type, the Korean listeners were significantly worse than the English listeners for [ethᶤma–ethma] and [esᶤma–esma] compared to the control pairs, but not for [ethima–ethma] and [esima–esma].
When the two groups' A′ scores for [echᶤma–echma] were compared against the control A′, there was a main effect of Word-pair (F(1,37)=10·031, p=0·003, ηp2=0·213), a main effect of Language (F(1,37)=15·977, p<0·001, ηp2=0·302) and an interaction between Word-pair and Language (F(1,37)=27·428, p<0·001, ηp2=0·426). Furthermore, the same pattern was found when the A′ scores for [echima–echma] were compared against the controls. There was a main effect of Word-pair (F(1,37)=8·221, p=0·007, ηp2=0·182), a main effect of Language (F(1,37)=17·668, p<0·001, ηp2=0·323) and a significant interaction between Word-pair and Language (F(1,37)=15·563, p<0·001, ηp2=0·296). Therefore, in comparison with the control pairs, the Korean listeners had significantly lower A′ scores than the English listeners for both [echᶤma–echma] and [echima–echma].Footnote 16
For the comparison of A′ scores for [e∫ᶤma–e∫ma] and the controls, there was a main effect of Language (F(1,37)=7·301, p=0·01, ηp2=0·165); however, there was neither a main effect of Word-pair (F(1,37)=0·900, p=0·349, ηp2=0·024) nor an interaction between Word-pair and Language (F(1,37)=3·188, p=0·082, ηp2=0·079). In contrast, for the comparison between [e∫ima–e∫ma] and the controls, there was no main effect of Word-pair (F(1,37)=3·929, p=0·055, ηp2=0·096); however, there was a main effect of Language (F(1,37)=8·619, p=0·006, ηp2=0·189) and a significant interaction between Word-pair and Language (F(1,37)=8·371, p=0·006, ηp2=0·184). Thus, for word-pairs with a [∫], the Korean listeners performed significantly worse than the English listeners on [e∫ima–e∫ma] compared to the controls, but not on [e∫ᶤma–e∫ma].
As the above statistical analysis shows, the Korean listeners were, as predicted, significantly worse than the English listeners at discriminating the word-pairs [ethᶤma–ethma], [esᶤma–esma], [echᶤma–echma], [echima–echma] and [e∫ima–e∫ma], as compared to the control [ᶤ–i] word-pairs.
3 Experiment 2
The results of the AX task in Experiment 1 showed that Korean listeners perceived different sets of illusory vowels in different phonological contexts, as would be expected on the basis of the phonological processes of vowel deletion and palatalisation in Korean. However, given the somewhat high A′ values for all pairs in Experiment 1, it is possible that the experimental results are actually the result of a more phonetic listening mode.Footnote 17 But it is unclear what set of hypotheses of phonetic perception would result in this particular pattern of differences between the English and Korean speakers. A more reasonable explanation, we think, is that the observed differences are smaller as a result of the ease of the AX task; i.e. the differences are smaller because the task allows for a more phonetic perception. Nevertheless, given that such phonetic factors are commonly assumed to be strongly present in an AX task,Footnote 18 in Experiment 2 we ran an ABX task in which listeners were presented with three stimuli, and asked to decide whether the first or the second stimulus was more similar to the third stimulus. The ABX task is much more memory-intensive and is therefore typically viewed as encouraging higher-level or phonological listening (Gerrits & Schouten Reference Gerrits and Schouten2004). As discussed in relation to Experiment 1, we expect that Korean listeners should have much more difficulty than English listeners in distinguishing the following two sets of stimulus pairs: (a) [ethᶤma–ethma], [esᶤma–esma], [echᶤma–echma], (b) [echima–echma], [e∫ima–e∫ma].
3.1 Method
3.1.1 Participants
Seventeen native Korean speakers (9 men, 8 women; age 20–31) and 17 native English speakers (2 men, 15 women; age 19–22) participated in the experiment. All the subjects were recruited at Michigan State University, and reported that they had normal hearing. None of the Korean speakers had come to the U.S.A. or visited other English-speaking countries before the age of 13, nor had they lived in English-speaking countries for more than four years.
3.1.2 Stimuli
The stimuli for Experiment 2 were the same twelve test items used in Experiment 1, as described in Table I above.
3.1.3 Procedure
In Experiment 2 we used an ABX task to investigate a perceptual epenthesis effect. As in Experiment 1, we tested all combinations of the vowels [ᶤ i ∅]. For example, for the cluster [sm], the AB word-pairs were [esᶤma–esma], [esima–esma] and [esᶤma–esima]. Two recordings were used for each item, as in Experiment 1, and the order of tokens in each AB word-pair was counterbalanced. For instance, in the case of [esima–esma], there were four AB word-pairs, [esima1–esma1], [esima1–esma2], [esima2–esma1] and [esima2–esma2], and an additional four word-pairs in reverse order. Either A or B was added as an X to each of these AB word-pairs. When adding Xs, the same token was never repeated in a single trial. Therefore, in the case of [esima–esma], there were four ABA word-triplets [esima1–esma1–esima2], [esima1–esma2–esima2], [esima2–esma1–esima1], [esima2–esma2–esima1], and an additional four ABB word-triplets [esima1–esma1–esma2], [esima1–esma2–esma1], [esima2–esma1–esma2], [esima2–esma2–esma1]. The same permutations were used for the other clusters ([thm chm ∫m]), giving a total of 192 trials in the experiment.
The experiment was conducted in a quiet room, with a group of at most four participants per session. The stimuli were presented to each participant as an ABX task scripted in Praat with a low-noise headset (Plantronics SupraPlus HW261). The participants were asked to listen to word-triplets, and to determine whether the last sound was more similar to the first or the second and click on the corresponding box (1 or 2) on the screen. All the instructions were in English for the English speakers (‘decide whether the last sound is more similar to the first or the second’) and in Korean for the Korean speakers (‘세번째 소리가 첫번째 소리와 비슷한지 두번째 소리와 비슷한지 고르세요’). Before the actual experiment, each participant completed a practice session, to ensure familiarity with the task. The practice session had twelve trials with another set of nonce words. The interstimulus interval was 500 ms and the intertrial interval was 1500 ms. All 192 trials were randomised for each participant. The subjects were allowed to take a break after half of the trials; the experiment took about 17 minutes.
3.2 Results
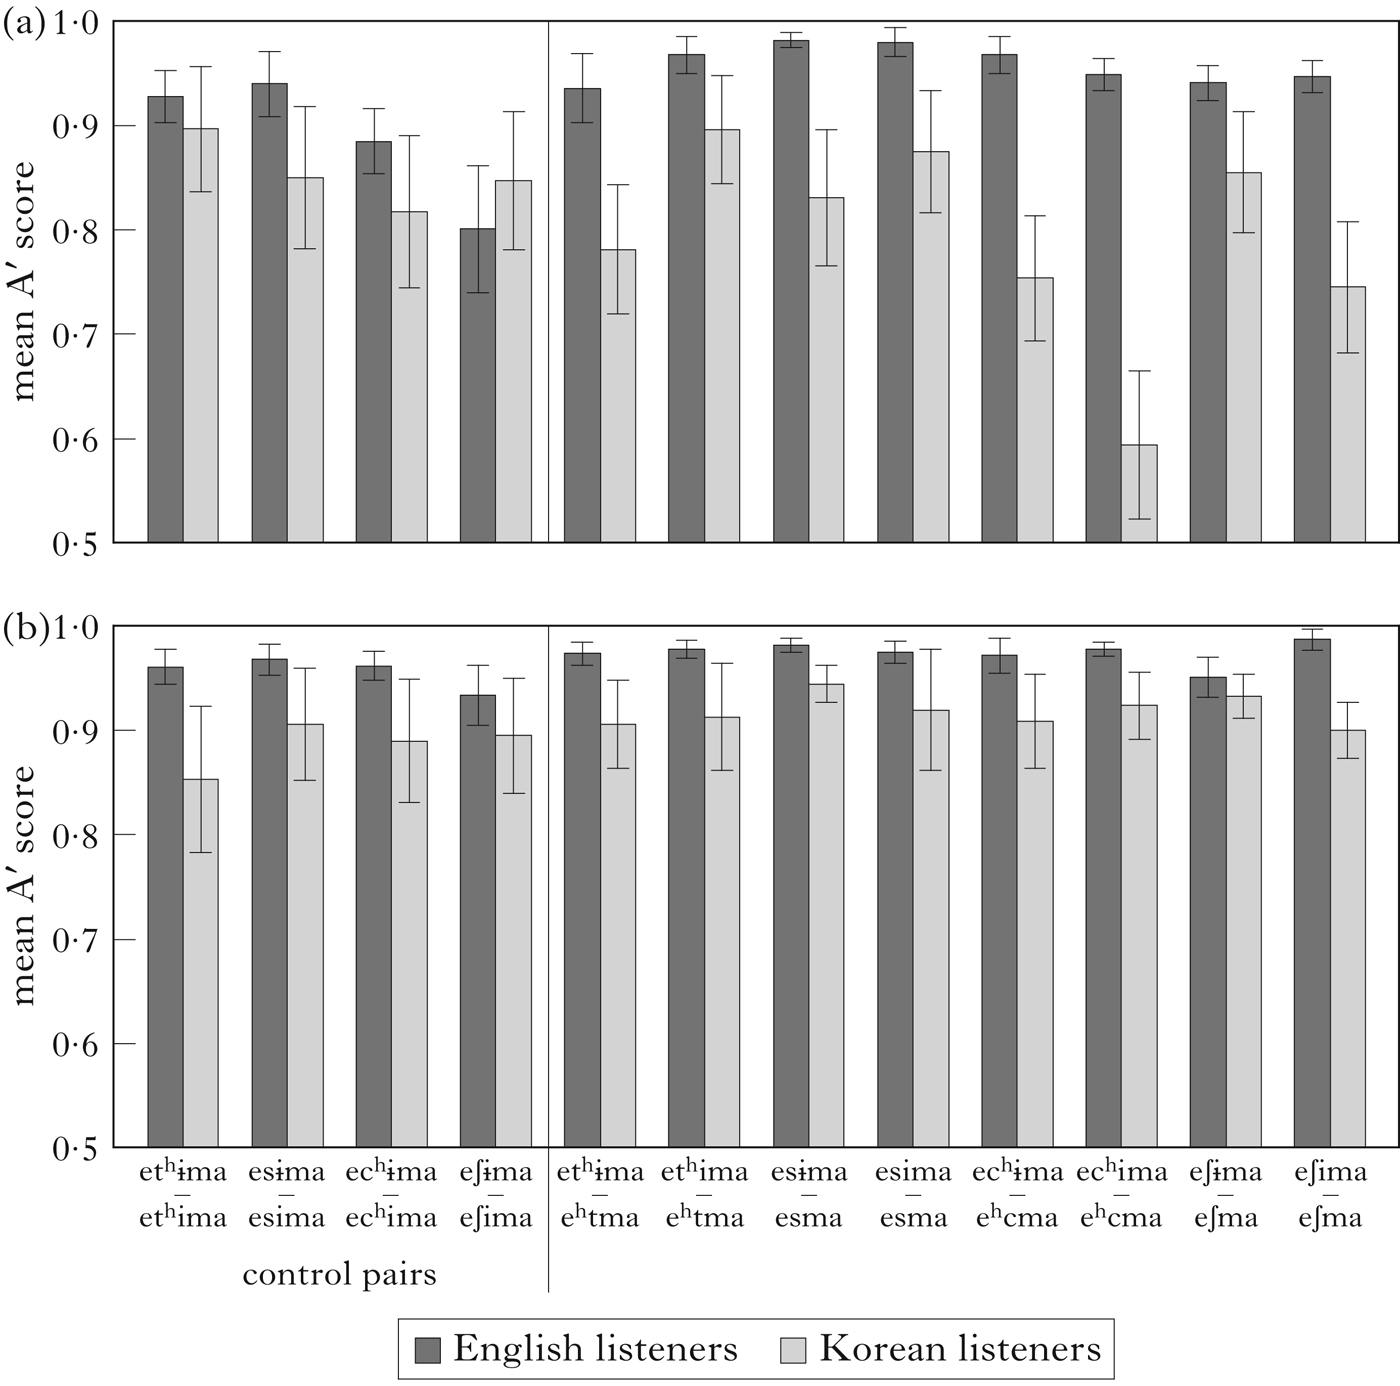
As in Experiment 1, we calculated A′ as a measure of perceptual epenthesis. Figures 2a and b show the mean A′ values for English and Korean listeners for all the word-pairs for ABA and ABB orders respectively (see Appendix: Tables V and VI for the individual values). Overall, the figures illustrate that the English listeners have higher A′ values than Korean listeners. Interestingly, both the English and Korean listeners seem to have higher A′ scores for the ABB order than for the ABA order.
Mean Aˊ (discriminability) values for English and Korean listeners in Experiment 2: (a) for the ABA order; (b) for the ABB order. Error bars represent standard errors.

In order to test statistical significance, a three-way mixed ANOVA was run, with Word-pair and Order (i.e. ABA and ABB) as within-subject variables and Language (i.e. English and Korean) as a between-subjects variable. The three-way mixed ANOVA for A′ scores revealed that there was an effect of Language (F(1,32)=4·377, p=0·044, ηp2=0·120). There was a main effect of Word-pair (F(5·335,170·713) = 2·764,Footnote 19 p=0·018, ηp2=0·079) and an interaction of Word-pair by Language (F(5·335,170·713) = 2·992, p=0·011, ηp2=0·086). There was also a main effect of Order with a very large effect size (F(1,32)=24·476, p<0·001, ηp2=0·433), and an interaction of Order by Language (F(1,32)=5·74, p=0·022, ηp2=0·153). There was an interaction of Word-pair by Order (F(5·619,179·798) = 3·217, p=0·006, ηp2=0·091) and a three-way interaction between Word-pair, Order and Language (F(5·619,179·798)=3·725, p=0·002, ηp2=0·104).
As Order had a main effect with a very large effect size, participants' responses for ABA and ABB orders were analysed separately, using two two-way mixed ANOVAs, with Word-pair as a within-subject variable and Language as a between-subjects variable. A two-way mixed ANOVA for the ABA order revealed a main effect of Language (F(1,32)=5·410, p=0·027, ηp2=0·145), a main effect of Word-pair (F(5·350,171·214)=4·056, p=0·001, ηp2=0·112) and an interaction between Word-pair and Language (F(5·350,171·214) = 4·783, p<0·001, ηp2=0·130). However, a two-way mixed ANOVA for the ABB order did not find a significant main effect of Language (F(1,32)=2·643, p=0·114) or Word-pair (F(3·558,113·847) = 0·852, p=0·485), or an interaction between Word-pair and Language (F(3·558,113·847) = 0·479, p=0·729).
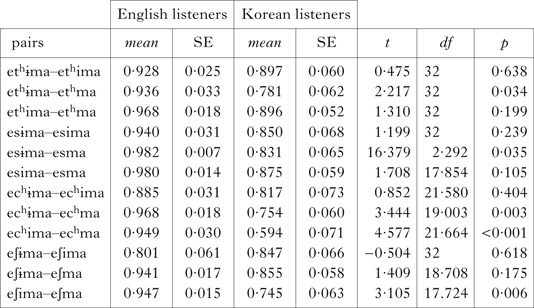
As only the ABA order showed a main effect of Language and an interaction between Word-pair and Language, follow-up planned comparisons were conducted on the English and Korean listeners' responses for the ABA order (see Appendix: Table V for the t-test results). The results showed that there was no significant difference between English and Korean listeners in the control Word-pairs with different vowels (t(32)=0·475, p=0·638 for [ethᶤma–ethima]; t(32)=1·199, p=0·239 for [esᶤma–esima]; t(21·580)=0·852, p=0·404 for [echᶤma–echima]; t(32)=—0·504, p=0·618 for [e∫ᶤma–e∫ima]). Among the test word-pairs, the English and Korean listeners were significantly different only for the predicted word-pairs (t(32)=2·217, p=0·034 for [ethᶤma–ethma]; t(16·379)=2·292, p=0·035 for [esᶤma–esma]; t(19·003)=3·444, p=0·003 for [echᶤma–echma]; t(21·664)=4·577, p<0·001 for [echima–echma]; t(17·724)=3·105, p=0·006 for [e∫ima–e∫ma]). The two Language groups were not significantly different for the rest of the word-pairs (t(32)=1·310, p=0·199 for [ethima–ethma]; t(17·854)=1·708, p=0·105 for [esima–esma]; t(18·708)=1·409, p=0·175 for [e∫ᶤma–e∫ma]).
To summarise the results of the ABX task in Experiment 2, Order (i.e. ABA, ABB) had a main effect with a very large effect size, in which the Korean and English listeners had no significant difference in their responses to the ABB order, whereas they did show significant differences for the ABA order.Footnote 20 The effect of Order could be explained by the fact that comparison to the second member of the triplet is affected by recency effects (Gerrits & Schouten Reference Gerrits and Schouten2004). The listeners could have had lower memory load in the case of ABB trials, as it is the second member of the triplet that is the same as the third. Given the lower memory load in the ABB trials, it is likely that the listeners used a more phonetic mode of perception.
The responses for the ABA order followed our predictions. Only the Korean listeners perceived an /ᶤ/ between consonants in the [thm] and [sm] clusters. They also reported that they heard both /ᶤ/ and /i/ in [chm], but /i/ in [∫m]. The results showed that there was no group difference in the control word-pairs with different vowels. However, it is interesting to see that the English listeners had relatively low A′ scores for the control word-pairs with different vowels in comparison to the rest of the word-pairs, both with and without a medial vowel, which seems to reflect that they may have been influenced by English phonology, particularly the process of vowel reduction in unstressed syllables (Burzio Reference Burzio1994). This issue definitely deserves a more thorough examination; however, it is beyond the scope of the current article.
Furthermore, the fact that there was no observable effect of Language in the ABB order also shows that the experimental results for both Experiment 1 and the ABA order of Experiment 2 were very unlikely to be due to a more phonetic perception mode or to stimuli artefacts. If this had been the case, then the same pattern of results should have been observable in the ABB results.
4 Experiment 3
Experiment 2 showed that the results of the ABX task also followed our predictions, demonstrating the same patterns as the results of the AX task in Experiment 1. However, a potential problem with AX and ABX tasks is that the locus of the difference perceived by the listener is unclear. For example, if the listener distinguishes the two stimuli [ethima–ethma], it is true that, by hypothesis, the expected locus is indeed the medial vowel; however, it is not clear if the listener is distinguishing it on the basis of the presence/absence of the medial vowel, or on the basis of any other changes that they might have perceived in the consonants. More specifically, it is possible that the Korean listeners in Experiment 1 had a higher discriminability for the pair [ethima–ethma] than for [ethᶤma–ethma] in comparison to English listeners because the first pair involves a case of ‘perceptual palatalisation’, where the [th] before [i] was perceived as a palatal consonant, i.e. [ethima] was perceived as /echima/. Therefore, the pair in which both the first consonantal and the medial vowel were perceived to be different might have been discriminated better than that with just the presence vs. absence of a vowel.
For this reason, in Experiment 3 we decided to run a task in which listeners heard a stimulus, and had to decide whether there was a vowel between the two consonants, and if there was a vowel, what it was. The identification task was different from the AX and ABX tasks in Experiments 1 and 2, in that Experiment 3 required participants to focus on the medial vowel. It was clearly a more metalinguistic task. Given that the identification task is more metalinguistic, and that it forces the participants to focus on just one part of the stimuli, it is possible that there could be slightly stronger task-related effects due to response bias, selective attention focused on particular parts of the stimuli, and the effect these have on auditory coding (Caporello Bluvas & Gentner Reference Caporello Bluvas and Gentner2013). Despite these concerns, it is useful to run an identification task, as it can give us yet another perspective into what is happening during the perception of the relevant stimuli.
Following the view of perception laid out in §1, we expect the Korean listeners, unlike the English listeners, to hear illusory vowels in two sets of stimuli; (a) in the stimuli [ethma], [echma] and [esma], we expect the Korean listeners to hear the illusory vowel /ᶤ/, (b) in the stimuli [echma] and [e∫ma], we expect them to hear the illusory vowel /i/.
4.1 Method
4.1.1 Participants
The participants were the same as in Experiment 2.
4.1.2 Stimuli
The stimuli were the same twelve test items used in Experiments 1 and 2 (see Table I above). There were two recordings used for each item as in Experiments 1 and 2, and they were each presented twice; there were therefore four tokens of each item, and a total of 48 tokens in the experiment.
4.1.3 Procedure
We used an identification task to investigate the perceptual epenthesis effect. The experiment was conducted in a quiet room, with a group of at most four participants per session. Experiment 3 drew participants' attention to the medial vowel in the stimuli. Therefore, it was conducted after Experiment 2 (after a short break), so as not to have the participants focus only on the vowel in Experiment 2. The stimuli were presented to each participant as an identification task scripted in Praat with a low-noise headset (Plantronics SupraPlus HW261). The participants were asked to listen to a stimulus and determine whether the medial vowel was [ᶤ], [i] or ∅, and click on the corresponding box on the screen (the actual choices were ‘u’, ‘i’ and ‘nothing’ for the English listeners, and ‘으’, ‘이’ and ‘없음’ for the Korean listeners).Footnote 21 All the instructions were in English for the English speakers (‘choose the vowel between the two consonants’) and in Korean for the Korean speakers (‘두 자음 사이의 모음을 고르세요’). Before the actual experiment, each participant completed a practice session, to ensure familiarity with the task. The practice session had nine trials with a different set of nonce words. The intertrial interval was 1000 ms. All 48 trials were randomised for each participant.
4.2 Results
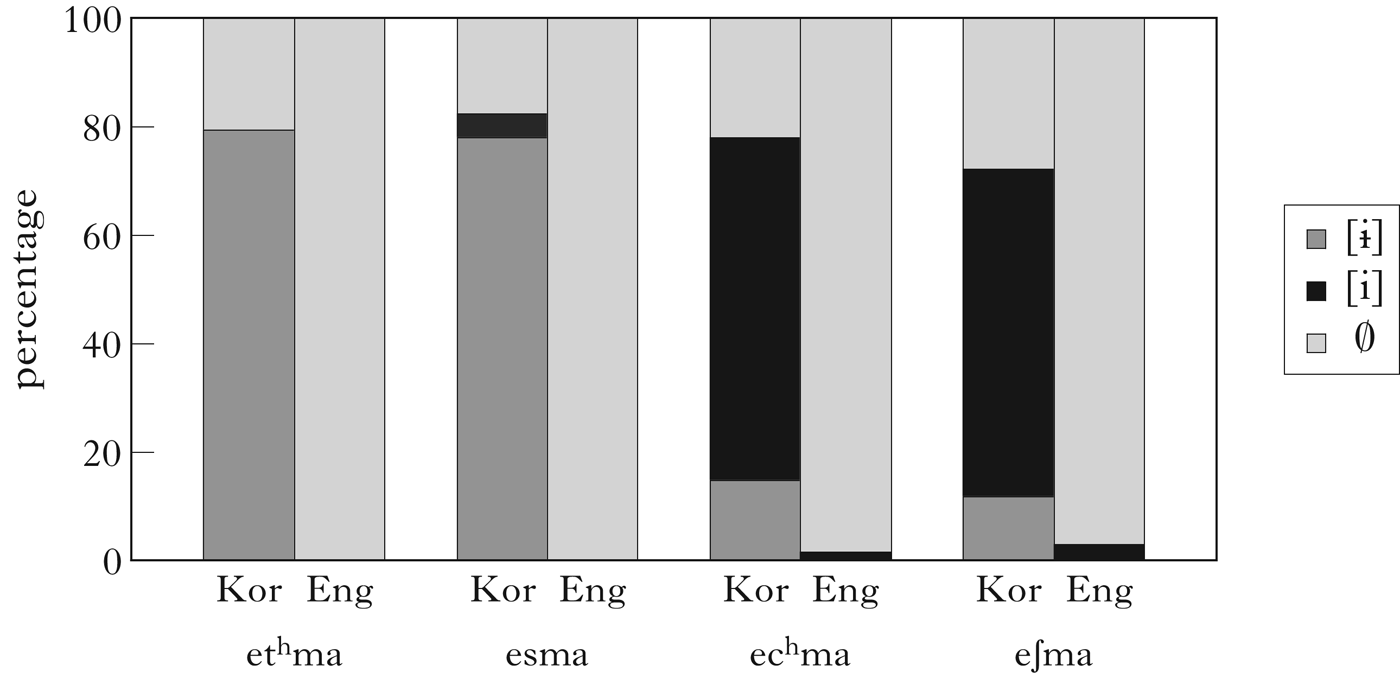
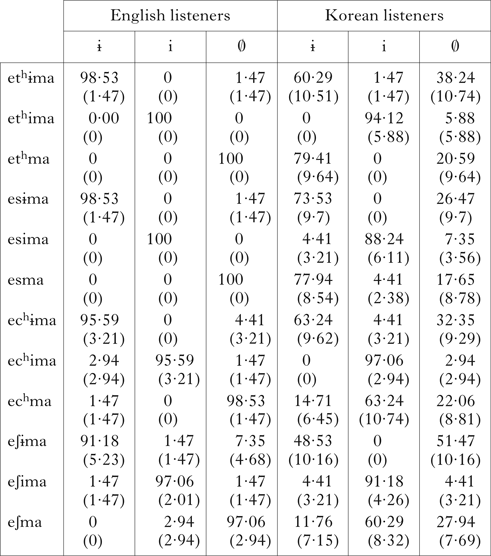
Participants had to determine whether the medial vowel in a stimulus was [ᶤ], [i] or ∅. The mean percentage of vowel responses to the stimuli can be found in Table VII in Appendix. Figure 3 gives percentages of vowel responses (i.e. [ᶤ i ∅]) for the [eCma] stimuli (where C=consonant). The figure shows that the English listeners in general correctly identified the absence of the vowels in all cases, whereas the Korean listeners generally identified an [ᶤ] in [ethma] and [esma], and an [i] in [echma] and [e∫ma]. Korean listeners also identified an [ᶤ] for [echma].
Percentages of vowel responses for [eCma] stimuli.

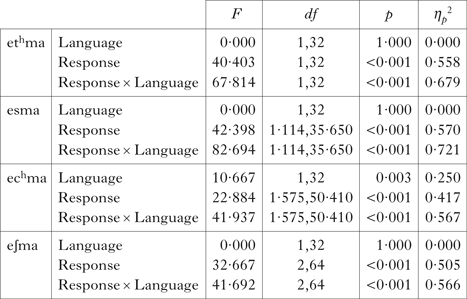
To examine whether Korean and English listeners responded differently when they heard stimuli with no medial vowels, separate two-way mixed ANOVAs were run for [eCma] stimuli (i.e. [ethma, esma, echma, e∫ma]), with Response (i.e. [ᶤ i ∅]) as a within-subject variable and Language (i.e. Korean, English) as a between-subjects variable (see Appendix: Table VIII for the ANOVA results). For [ethma], there was a main effect of Response (F(1,32)=40·403, p<0·001, ηp2=0·558), and an interaction between Response and Language (F(1,32)=67·814, p<0·001, ηp2=0·679). For [esma], there was a main effect of Response (F(1·114,35·650) = 42·398, p<0·001, ηp2=0·570), and an interaction between Response and Language (F(1·114,35·650) = 82·694, p<0·001, ηp2=0·721). For [echma], there were main effects of Language (F(1,32)=10·667, p=0·003, ηp2=0·250) and Response (F(1·575,50·410) = 22·884, p<0·001, ηp2=0·417), and an interaction between Response and Language (F(1·575,50·410) = 41·937, p<0·001, ηp2=0·567). For [e∫ma], there was a main effect of Response (F(2,64)=32·667, p<0·001, ηp2=0·505), and an interaction between Response and Language (F(2,64)=41·692, p<0·001, ηp2=0·566). To summarise the results of the four mixed ANOVAs, English and Korean listeners responded differently for all four stimuli.
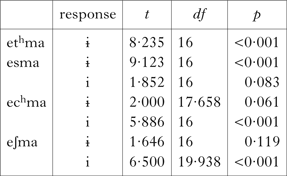
In order to test our predictions, follow-up planned comparisons were conducted on the responses to the stimuli with no medial vowel. Planned comparisons showed that the English and Korean listeners' responses conformed to the predictions (see Appendix: Table IX for the results). For [ethma], Korean listeners identified [ᶤ] more often than English listeners (t(16)=8·235, p<0·001), but none of the English or Korean listeners identified an [i]. For [esma], there was a group difference in [ᶤ] identification (t(16)=9·123, p<0·001), but not in [i] identification (t(16)=1·852, p=0·083). When presented with [echma], Korean listeners identified [i] more than English listeners (t(16)=5·886, p<0·001), and they also showed a marginally significant increase in [ᶤ] compared to English listeners (t(17·658)=2·000, p=0·061). When presented with [e∫ma], Korean listeners identified [i] more often than English listeners (t(19·938)=6·500, p<0·001); however, there was no statistical group difference in [ᶤ] identification (t(16)=1·646, p=0·119).
In summary, the results of the identification task in Experiment 3 showed that the Korean listeners perceived an illusory /ᶤ/ more often in [ethma] and [esma] than the English listeners. In [echma], the Korean listeners perceived both illusory /ᶤ/ and /i/, and in [e∫ma], they perceived an illusory /i/ more often than the English listeners; they also perceived a statistically non-significant number of illusory /ᶤ/'s compared to the English listeners.
Overall, the results of Experiment 3 were consistent with the expectations laid out above. However, there are two aspects of the results that need more discussion and future exploration. First, although we predicted that Korean listeners would hear both /i/ and /ᶤ/ in [echma] more often than the English listeners, we made no predictions about which of the two would be perceived more frequently. At least in Experiments 2 and 3, there is clearly a preference for /i/. Whether this is a bias due to the experimental task or a more general bias due to the phonological facts of the Korean needs further investigation. Secondly, there is also a small, but non-significant, number of cases of the perception of illusory /ᶤ/ in [e∫ma] in Experiment 3. Again, it is unclear if this is due to facts about the auditory coding of segments that are not distinct phonemes. Perhaps the auditory segment [∫] is more likely to be coded as [s] (i.e. the more general member of the phonemic pair) because the focus on the medial vowel hampers the coding of adjacent consonants.Footnote 22 A second possibility is that the vowel /ᶤ/ is a more default illusory vowel in Korean, given its participation in general vowel-deletion processes and its being the shortest vowel in the language. A third interesting explanation suggested to us by an anonymous reviewer is the possibility of there being an illusory /j/ after the phonome inferred for [∫] (since palatalisation in Korean is also triggered before the palatal glide /j/), and consequently an illusory /ᶤ/ after the /j/, thereby sometimes resulting in the phonemic percept /sjᶤm/ for [∫m]. This third account is consistent with the overall picture presented in this article of reverse inference to the underlying representation. With respect to all three possibilities mentioned above, it is important to notice that the perceptual illusion of the vowel /ᶤ/ was least in the context of [∫] (and was somewhat inconsistent in all three experiments), suggesting that the locus of the explanation for this particular effect might be different from the ones we have been discussing in this article. Again, none of these possibilities detracts from the predictions in the current paper, but they do suggest very interesting directions for further inquiry.
5 Discussion
In this paper we have shown that the location and quality of the illusory vowels in illicit phonotactic sequences of consonants is modulated by the native phonology of the listeners, using an AX discrimination task, an ABX task and an identification task on Korean speakers with English speakers as a control group. Contrary to Dupoux et al.'s (2011) claim that the illusory vowel is the phonetically minimal or shortest vowel in the language, we have shown that it is possible to obtain more than one illusory vowel in the same language, and even in the same context, as long as the phonology of the language and the acoustic tokens themselves motivate such a reanalysis of the illicit sequences. The phonological processes of vowel deletion and palatalisation in Korean provide specific expectations of illusory vowels in different consonantal contexts. In consonantal sequence contexts where the first (coda) consonant is an alveolar consonant (i.e. [ethma] and [esma]), the phonological alternations in the language lead us to expect /ᶤ/ as the illusory vowel; in consonant contexts where the first (coda) consonant is an aspirated palatal stop consonant ([echma]), we expect either /ᶤ/ or /i/; and finally, in consonant contexts where the first (coda) consonant is a palatal fricative consonant ([e∫ma]), we expect /i/. We have shown that the observed cases of illusory vowel perception were exactly the ones expected.
Our results clearly indicate that listeners can hear different illusory vowels in different contexts, modulated by language-specific factors. In contrast, Dupoux et al.'s (2011) approach predicts that the illusory vowel in Korean will be /ᶤ/, perhaps due to its phonetically minimal characteristics. However, this does not account for the specific patterns of illusory vowels observed in the data. If this were the hypothesis, it is unclear why [chm] and [∫m] would trigger an illusory /i/ for Korean listeners. However, this is not to say that the proposed account is not partially compatible with the claim that the illusory vowel in some contexts can be the shortest vowel in the language (Dupoux et al. Reference Dupoux, Parlato, Frota, Hirose and Peperkamp2011). In illicit phonotactic contexts where the phonology of the language does not bias the listener towards a particular vowel (or set of vowels), the illusory vowel could indeed be expected to be the phonetically minimal or shortest vowel.
Furthermore, the patterns of illusory vowel perception observed cannot be explained purely on the basis of surface phonotactic patterns in the language. It is true that illusory vowels were perceived by the Korean listeners in phonotactically illicit sequences *[thm chm sm ∫m]. However, again, the focus needs to be on the quality of the illusory vowel perceived. The perception of the illusory vowel /i/ in the [∫m] context could be alternatively explained by surface phonotactic constraints that ban [∫] from being followed by any vowel except [i] in Korean (since only [∫i] is possible in Korean). Similarly, one could also account for the absence of the illusory vowel /i/ in the [sm] context by appealing to a surface phonotactic constraint banning *[si]. However, attempting to account for all the illusory vowels observed in this paper using purely surface phonotactics is problematic for a number of reasons. Firstly, the account proposed for the absence of the illusory vowel /i/ in [sm] contexts does not by itself explain why some illusory vowel other than /ᶤ/ is not inferred in the [sm] contexts (note that [sam sem som] are also possible sequences in Korean.Footnote 23 Secondly, on a similar note, the purely surface phonotactic account cannot explain why some vowel other than /i/ and /ᶤ/ is not a possible illusory vowel in the [chm] context ([cham chem chom] are possible sequences). Finally, and most importantly, the purely surface phonotactic account cannot explain why /i/ is not a possible illusory vowel in the [thm] context, even though [thim] is a possible sequence in Korean.Footnote 24 In parallel with the first two reasons, it also does not easily account for why there are no other possible illusory vowels. In contrast to the problems associated with a purely surface phonotactic account, the account based on phonological alternations laid out above is able to accurately predict the quality of the illusory vowel in different contexts.
The account of illusory vowels motivated by the current paper provides an explanation for the somewhat unexpected results presented by Monahan et al. (Reference Monahan, Takahashi, Nakao, Idsardi, Iwasakai, Hoji, Clancy and Sohn2009), who attempted to obtain more than one illusory vowel for Japanese speakers. Based on the patterns of loanwords in Japanese such as [makᵚdonarᵚdo] ‘McDonald's’, it is possible to hypothesise that the illusory vowel adjacent to non-coronal consonants (e.g. [k g]) is /ᵚ/, and adjacent to coronal consonants (e.g. [t d]) /o/. However, as they show, while Japanese speakers confuse [egᵚma] and [egma], they do not seem to confuse [etoma] and [etma]. From the perspective developed in the current article, there appear to be no native Japanese phonological processes that motivate other possible illusory vowels in the contexts tested by Monahan et al. On our account, the only illusory vowel expected for the contexts they tested is /ᵚ/, as it is the shortest vowel in the language.Footnote 25 We further predict that there will be other illusory vowels in Japanese. Japanese has a process palatalising alveolar consonants before /i/ which is similar to Korean; the account proposed here therefore predicts that the set of illusory vowels triggered adjacent to illicit palatal codas in Japanese should include the vowel /i/.
Finally, this article has provided support for the view that speech perception involves the reverse inference to the phonemic representation level. Such a conception of speech perception, we believe, falls out quite naturally from a Bayesian perspective, and we therefore see it as offering support more generally for the Bayesian view of speech perception (Feldman & Griffiths Reference Feldman, Griffiths, McNamara and Trafton2007, Bever & Poeppel Reference Bever and Poeppel2010, Sonderegger & Yu Reference Sonderegger, Yu, Ohlsson and Catrambone2010, Poeppel & Monahan Reference Poeppel and Monahan2011, Yu Reference Yu2011, Wilson & Davidson in press). Having said this, it is important to reiterate the point made earlier (note 1) that what we show in this article is consistent with any view of speech perception that makes crucial reference to the concept of reverse inference to the phonemic representation level.
Finally, in line with some previous research on the topic (Huang Reference Huang2001, Hume & Johnson Reference Hume and Johnson2003, Boomershine et al. Reference Boomershine, Hall, Hume, Johnson, Avery, Dresher and Rice2008, Johnson & Babel Reference Johnson and Babel2010), the results of the current article show that speech perception is modulated not only by the acoustics of the speech tokens and the surface phonotactics of a language, but also by the phonological alternations, and thereby by the phoneme-to-allophone mappings of a language.
Appendix
Complete list of test tokens in Experiment 1. Items relevant to the experiment are given in Table I above.

Means and standard errors of Aˊ values for English listeners (n=19) and Korean listeners (n=20) in Experiment 1.

Results of ANOVAs comparing Aˊ scores of Korean and English listeners against average control Aˊ in Experiment 1.

Means and standard errors of Aˊ values and t-test results for English listeners (n=17) and Korean listeners (n=27) for the ABA order in Experiment 2.

Means and standard errors of Aˊ values for the ABB order in Experiment 2.

Means and standard errors (in parentheses) of percentages of vowel responses in Experiment 3.

Results of ANOVAs in Experiment 3.

Results of planned comparisons of English and Korean listeners' responses in Experiment 3.