I. INTRODUCTION
Household appliances used to be operated only in the relatively stable environment of the home. However, due to technological advances, there has been a proliferation of mobile devices. Mobile devices are used everywhere in a variety of conditions, including: at the beach or swimming pool, and while hiking, climbing, or jogging, where they may be exposed to high temperatures and humidity. Therefore, mobile devices must be highly durable because of these varied environments and the increased likelihood of accidental impact. Solder alloys, which play a crucial role in mobile devices, must also be stable in high temperature and high humidity and should be able to withstand accidental impact.Reference Zaal, van Driel, Kessels and Zhang1, Reference Long, Dutta, Sarihan and Frear2 Furthermore, in 2006, the EU enacted legislation, Restriction of Hazardous Substances, that prohibits the use of Pb in electronic devices because of health and environmental concerns.3 Consequently, Pb-bearing solder alloys have been replaced with Pb-free solder alloys, specifically, Sn-based Sn–Ag, Sn–Cu, and Sn–Ag–Cu solder alloys.Reference Moon, Boettinger, Kattner, Biancaniello and Handwerker4–Reference Huh, Kim and Suganuma6 However, Sn-based Pb-free solders have technical issues that must be overcome to ensure the reliability of mobile devices.
A major drawback of using Sn-based Pb-free solders is the growth of Sn whiskers. Sn whiskers are mainly observed on Sn-rich thin surfaces such as electroplated finishes.Reference Schetty7 However, it was recently reported that Sn whiskers can grow on the solder joint as well as on Sn surface finishes.Reference Chuang8, Reference Ye, Xue, Zhang, Xiao, Hu, Lai and Zhu9 A Sn whisker is a single crystal that grows spontaneously from a Sn-rich surface where two different materials form a joint and diffuse into one another. Sn whiskers grow easily in conditions of high temperature and high humidity, which are common conditions for mobile devices.Reference Su, Howell and Chopin10 Additionally, Sn whiskers can induce current leakage and short-circuiting. The cause and growth mechanisms of Sn whiskers have been widely reportedReference Lee and Lee11–Reference Galyon and Palmer14 but are not fully understood, although compressive stress in Sn appears to be an important factor. Compressive stress arises from the interdiffusion of the Sn and Cu substrates during Cu6Sn5 formation.Reference Tu15 Adding Be (which has a small atomic radius) to Sn-based Pb-free solders consequently restrains the interdiffusion and reduces the compressive stress and may also help to suppress the growth of Sn whiskers. However, Be is highly toxic, and thus, we used a very small amount of Be (less than 0.02 wt%) in this research to reduce the toxicity of Be.
Mobile devices need to withstand impact, but Sn-based Pb-free solders are inherently weak because they form large intermetallic compounds (IMCs)Reference Jeong, Kim and Lee16 and voids at the interface of solders and substratesReference Cho, Kang, Shih and Lee17 and also suffer from IMC spalling during the reflow process.Reference Sohn, Yu, Kang, Shih and Lee18 To solve these problems and to increase their durability, we added a minor Co alloying element to Sn-based Pb-free solders. This step can effectively reduce the undercooling of Sn–Ag solder alloys,Reference Kim, Cho, Seo and Lee19 improve the mechanical properties,Reference Kim, Huh and Suganuma20 and suppress void formation in interfacial reactions with Cu under bump metallurgy (UBM).Reference de Sousa, Henderson, Parry, Kang and Shih21
In this study, we observed the growth of Sn whiskers on the surfaces of Be-doped and undoped Sn-based solders. We also investigated the effect of Be doping on the growth of Sn whiskers. Furthermore, we analyzed the thermal properties, microstructure, and microhardness of these alloys to evaluate how Be and Co affected the properties of Sn–1.0Ag–0.5Cu–xBe–xCo solders (in wt%). Finally, our study investigated the interfacial reactions of Cu/OSP and electroless Nickel electroless Palladium immersion Gold (ENEPIG) UBMs and researched the optimal amounts of Be and Co doping for Sn-based Pb-free solders for optimal performance under the harsh conditions that mobile devices are subjected to.
II. EXPERIMENTAL PROCEDURES
In this experiment, Sn–0.1Cu, Sn–0.5Cu, Sn–1.0Ag–0.5Cu solders containing up to 0.02 wt% of Be were melted in a graphite crucible at 1000 °C for 2 h under nitrogen. We used the Cu–0.04 wt% Be master alloy to reduce the toxicity of Be. A Cu sheet was then dipped into the molten solders for 3 s to generate the solder finishes. The Cu sheet was 99.9% pure; it was cleaned with hydrochloric acid and distilled water and then spread by means of a flux (TAMURA, SOLDERITE EC-19S-8, Kitatama-gun, Tokyo, Japan). After the dip soldering, the soldered samples were cleaned with ethyl acetate and ultrasonication. Each sample was subsequently used in four test conditions: as received, after 1000 cycles of a temperature cycling range of −55 to +80 °C, after 1000 h of storage at a temperature of 80 °C and a relative humidity of 90%, and after 12 mo of storage in uncontrolled ambient conditions (temperature: 20–25 °C; relative humidity: 40–70%). Scanning electron microscope (SEM) surface observations of the samples were then conducted per the JESD22A121 standard. The samples were then sectioned for focused ion beam (FIB) imaging (Nova230; FEI Co., Hillsboro, OR) and the sectioned sides were examined by electron backscattering diffraction (EBSD, Nova200; FEI Co.).
To evaluate the properties of solder alloys, we used Sn–1.0Ag–0.5Cu solder as the reference solder composition and alternately or jointly added 0.02 wt% Be and 0.01–0.05 wt% of Co. Each composition of the Sn–1.0Ag–0.5Cu–xBe–xCo solders was prepared from high-purity (>99.99%) Sn, Ag, Cu, Be, and Co elemental mixtures encapsulated in a quartz tube under high vacuum and melted at 1000 °C or higher. Solder balls (400 μm) were produced during a 5-min reflow at 250 °C in a vacuum oven and were then cooled in air (at a cooling rate of 2 °C/s). Differential scanning calorimetry (DSC) experiments were conducted with a diamond differential scanning calorimeter (Perkin-Elmer, Inc., Waltham, MA); heating and cooling occurred at a rate of 6 °C/min under nitrogen. After the DSC experiments, the microstructures of the bulk solders were observed by optical microscopy and SEM. Microhardness tests were used to evaluate the effects of Be and Co on the solder’s mechanical properties; tests were performed on the cross-sectioned surface of solder balls at a 10-g force and a 5-s dwell time. The Vickers hardness number (VHN) was based on an average of 10 or more indentations. Interfacial reaction experiments were subsequently conducted by reflowing the solders on Cu/OSP and ENEPIG UBMs in a vacuum oven at 250 °C for 90 s with a rosin-activated flux. After the reflow, a cross section of the interface of the solders and UBMs was observed after a mounting and polishing process. We used a SEM backscattered electron mode (Nova200; FEI Co.) to observe the IMCs and energy-dispersive x-ray spectroscopy (EDS) for compositional analyses.
III. RESULTS AND DISCUSSION
A. Effects of Be addition on the growth of Sn whiskers
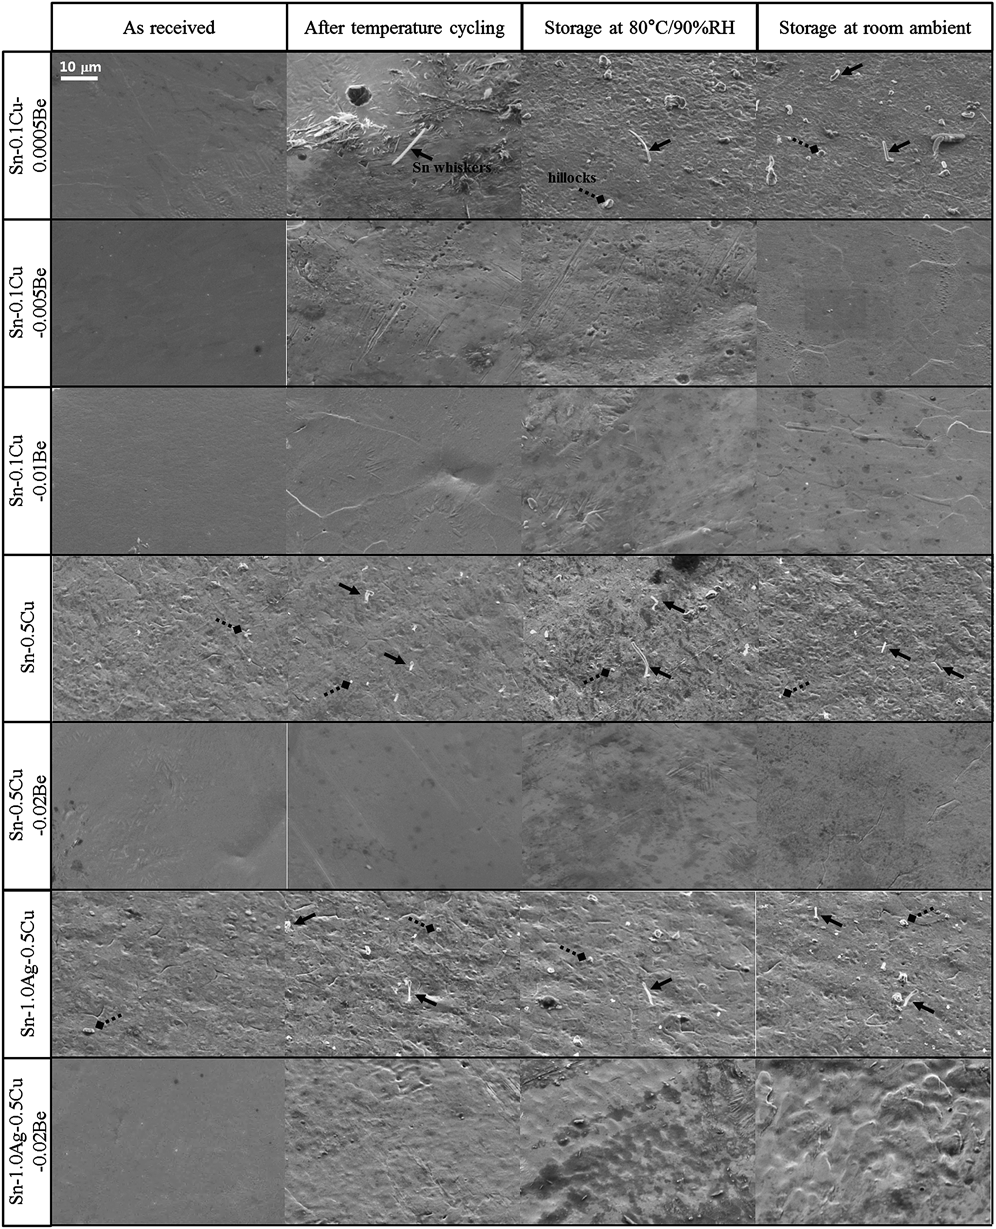
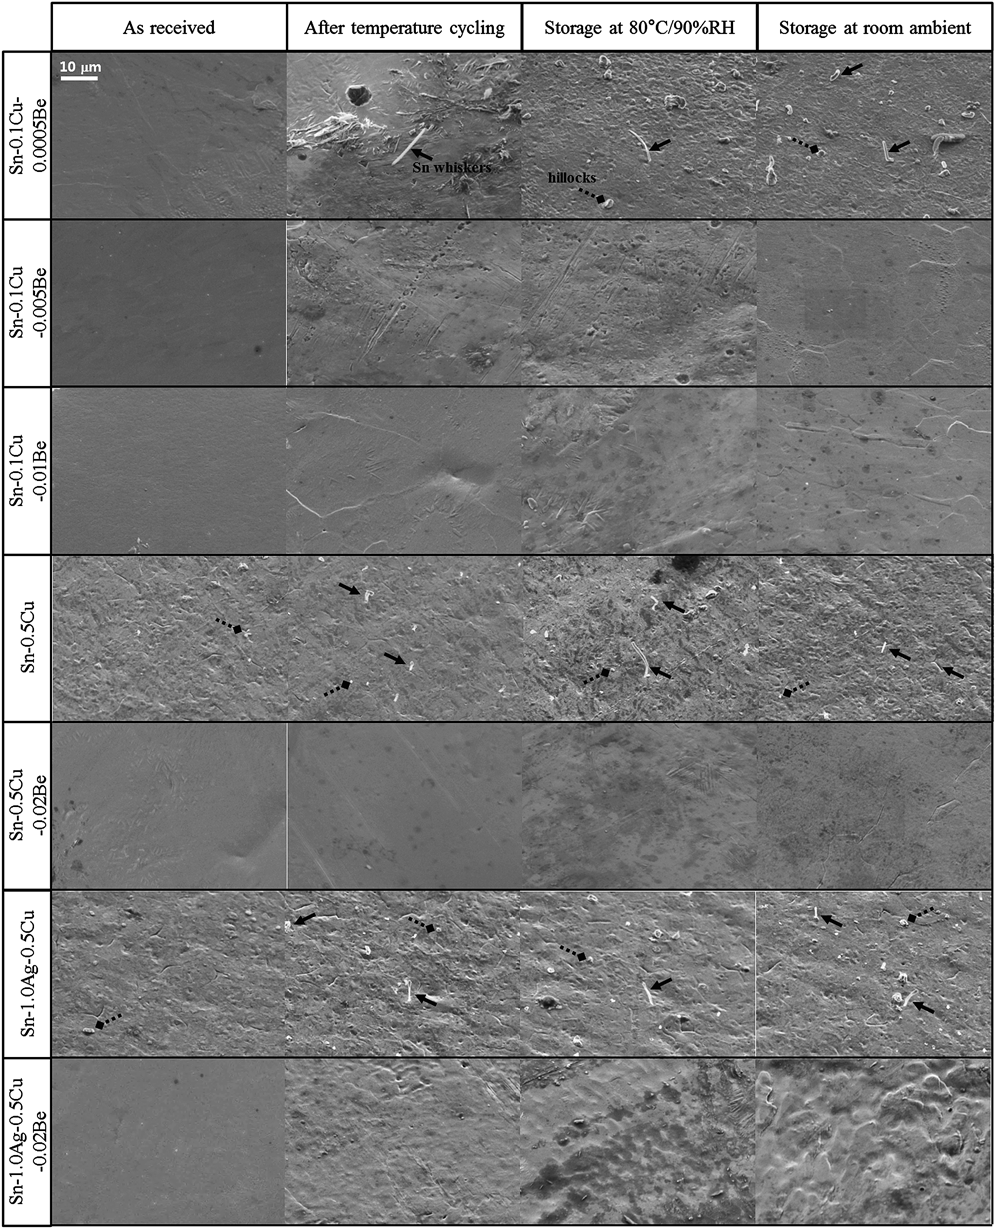
Figure 1 shows backscattered SEM images of the surfaces of Sn–0.1Cu–xBe, Sn–0.5Cu–xBe, and Sn–1.0Ag–0.5Cu–xBe solders on Cu sheets under different conditions. The as-received samples of the Sn–0.5Cu solder had only a few hillocks on the surface, while all other Sn–0.5Cu solder samples had many Sn whiskers and hillocks. The longest Sn whisker (15 μm) was observed on the surface of the sample stored at a temperature of 80 °C and a relative humidity of 90%. However, the 0.02 wt% Be-doped Sn–0.5Cu solder had no Sn whiskers or hillocks on any part of the surface for all four test conditions. Furthermore, under various conditions, the surfaces of Sn–0.5Cu–0.02Be solder were cleaner than those of the Sn–0.5Cu solder and had no holes.
SEM images of the surfaces of Sn–0.1Cu–0.0005Be, Sn–0.1Cu–0.005Be, Sn–0.1Cu–0.01Be, Sn–0.5Cu, Sn–0.5Cu–0.02Be, Sn–1.0Ag–0.5Cu, and Sn–1.0Ag–0.5Cu–0.02Be (in wt%) solders on Cu sheets under different conditions: as received, after temperature cycling, storage at 80 °C/90% RH, and storage at room ambient.
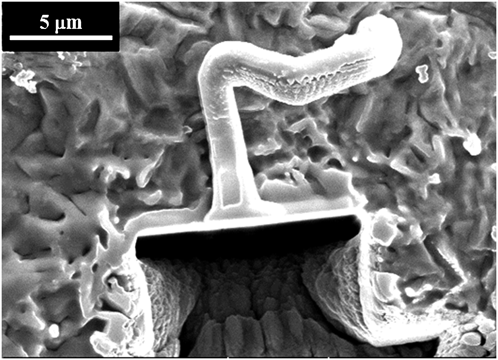
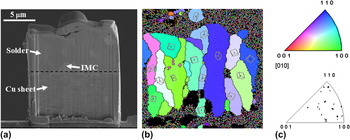
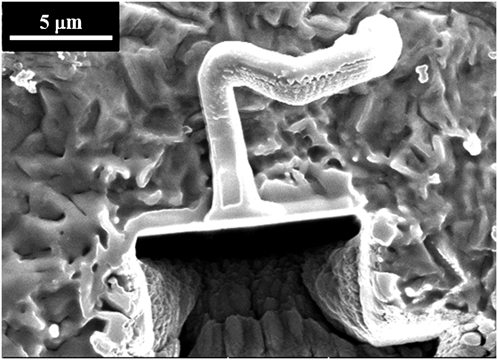
FIB sectioning was conducted to observe the grain structure at the base of a Sn whisker and to examine the thickness of the solder finish. Figure 2 shows a FIB-sectioned Sn whisker on the Sn–0.5Cu solder after being stored at high temperature and high humidity. The FIB process was used to cut the solder down into the Cu sheet. Figure 3(a) shows an incision at the base of the Sn whisker from Fig. 2. The solder finish was approximately 8-μm thick. A very thin layer of IMCs (approximately 1.5 μm) was observed between the solder and the Cu sheet. EBSD analysis was used to identify the crystal orientation of the Sn grain in the solder. Figure 3(b) shows an EBSD image taken from the solder area at the base of the Sn whisker. The Sn grains formed perpendicularly to the Cu sheet because the cooling starts from the surface of the Cu sheet. Figure 3(c) compares the EBSD color contrasts and the point distribution in the inverse pole figure; the comparison reveals many crystal orientations almost aligned with the <100> and <110> directions.
SEM image of a FIB-sectioned Sn whisker on the Sn–0.5Cu (in wt%) solder after 1000 h of storage at a temperature of 80 °C and a relative humidity of 90%.
EBSD analysis of the Sn–0.5Cu (in wt%) solder after 1000 h of storage at a temperature of 80 °C and a relative humidity of 90%: (a) SEM image of a FIB incision, (b) EBSD image of solder section, and (c) inverse pole figure.

To determine the minimum effective level of Be needed to suppress the growth of Sn whiskers, we investigated Sn–0.1Cu solders with Be levels of 0.0005, 0.005, and 0.01 wt%. We observed many hillocks and Sn whiskers in the Sn–0.1Cu–0.0005Be solders but none on the surfaces of Sn–0.1Cu–0.005Be solders and Sn–0.1Cu–0.01Be solders for all test conditions. Thus, the growth of Sn whiskers can be restrained by adding a small amount of Be (0.005 wt%) to the Sn-based solders. Sn–0.1Cu–0.0005Be solder samples had Sn whiskers up to 13 μm long after the temperature cycling; the samples stored under conditions of high temperature and high humidity had the longest average Sn whisker length. Comparing these results to previous data from the Sn–0.5Cu solder reveals that the Sn whisker growth is most active when exposed to high temperature and high humidity.
The minor alloying element Be also affects the growth of Sn whiskers on Sn–Ag–Cu solder, such as Sn–Cu solders. Sn–1.0Ag–0.5Cu solder had hillocks and Sn whiskers under all test conditions; however, there were no hillocks or Sn whiskers on the surface of Sn–1.0Ag–0.5Cu–0.02Be solder. Additionally, the surface of Be-doped Sn–Ag–Cu solder was not as clean as the surface of Be-doped Sn–Cu solders, except under the as-received condition. The Sn whiskers on Sn–1.0Ag–0.5Cu solder had a shorter average length than the Sn whiskers on Sn–Cu solder. This result is in agreement with that of a previous report stating that Sn–Ag solders have fewer and shorter Sn whiskers than matte Sn.Reference Vo, Kwoka and Bush22
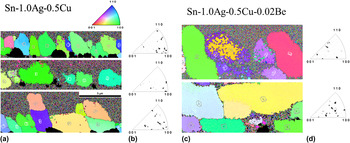
We investigated Ag–Be,Reference Okamoto and Tanner23 Be–Sn,Reference Okamoto and Tanner23 and Cu–BeReference Subramanian, Charkrabarti and Laughlin24 binary phase diagrams to determine how the addition of Be to Sn–Cu solder and Sn–Ag–Cu solder controls the growth of Sn whiskers. The Be–Sn binary system has no IMCs, and the Ag–Be binary system has only a δ phase. Additionally, Be is not soluble in either Sn or Ag. However, in the Cu–Be binary system, three IMCs are formed: the β phase, the γ phase, and the δ phase. The maximum solubility of Be in Cu is approximately 2.2 wt% at 863 °C. So, when Be is added to a Sn–Cu system or a Sn–Ag–Cu system, the Be atoms can substitute for Cu atoms and/or occupy the interstitial sites of Ag atoms or Sn atoms; the atomic radius of Ag and Sn atoms is 22% smaller than the atomic radius of Be. Thus, Be atoms are likely to disturb the diffusion of the solder system, thereby suppressing the growth of Sn whiskers. To verify the position of Be atoms in the Sn–Ag–Cu–Be system, we conducted line and area scanning analyses with an electron probe microanalyzer (Shimadzu, EPMA1600, Nakagyo-gu, Kyoto, Japan). However, we had difficulty determining the exact position of the Be atoms because we were unable to observe any Be on the area of interest owing to an insufficient amount of the alloying element. Adding Be also affects Sn whisker growth by changing grain orientation. Figure 4 shows EBSD data of cross-sectioned samples of as-received Sn–1.0Ag–0.5Cu and Sn–1.0Ag–0.5Cu–0.02Be solder alloys. The EBSD results show that the grains of Sn–1.0Ag–0.5Cu are almost precisely aligned in either <100> or <110> directions, whereas the grains of the Be-doped solder are randomly oriented. The randomness induced in the grains by the minor alloying element Be may help to explain why the addition of Be suppresses the growth of Sn whiskers.
EBSD data of cross-sectioned samples of as-received Sn–1.0Ag–0.5Cu and Sn–1.0Ag–0.5Cu–0.02Be (in wt%): (a, c) EBSD images and (b, d) inverse pole figures.

B. Thermal properties of Sn–1.0Ag–0.5Cu–xBe–xCo solder alloys
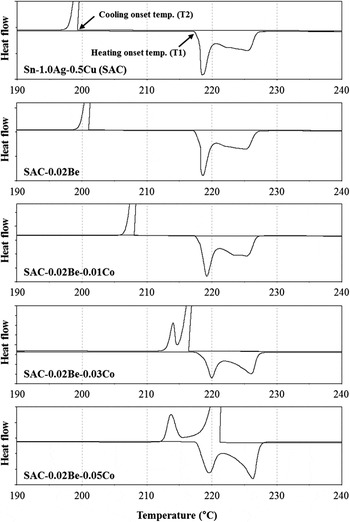
DSC measurements were taken to assess the thermal properties of Sn–1.0Ag–0.5Cu–xBe–xCo solder alloys. Figure 5 shows DSC measurement curves of the following solder alloys: Sn–1.0Ag–0.5Cu, Sn–1.0Ag–0.5Cu–0.02Be, Sn–1.0Ag–0.5Cu–0.02Be–0.01Co, Sn–1.0Ag–0.5Cu–0.02Be–0.03Co, and Sn–1.0Ag–0.5Cu–0.02Be–0.05Co. The onset temperature of the heating curve, indicated by T1, is the starting point of the melting process; the onset temperature of the cooling curve, indicated by T2, is the starting point of the solidification process. The amount of undercooling was measured as the difference between the two onset temperatures (ΔT = T1–T2 in Celsius). Table I lists the heating and cooling onset temperatures, peak temperature, and the amount of undercooling of the given solder alloys. The Sn–1.0Ag–0.5Cu–xBe–xCo solder alloys had a constant onset temperature in the heating curve, T1, near 218 °C with or without Be and Co. However, the cooling curves exhibited a different trend. The onset temperature for the first phase transformation increased during the cooling process as a function of the Be and Co content. Thus, less undercooling was observed after adding the minor alloying elements Be and Co. The undercooling of Sn–1.0Ag–0.5Cu was 18.75 °C; however, the undercooling of Sn–1.0Ag–0.5Cu was slightly reduced to 17.18 °C when 0.02 wt% Be was added to the solder. In contrast, the undercooling of Co-doped Sn–1.0Ag–0.5Cu–0.02Be solder was significantly reduced to less than 10 °C. Furthermore, the addition of 0.05 wt% Co to Sn–1.0Ag–0.5Cu–0.02Be decreased the undercooling to a negative temperature value. As a result, adding either Be or Co (or both) is effective at suppressing the undercooling of Sn–1.0Ag–0.5Cu solder alloys because Be and Co have a hexagonal close-packed crystal structure. The relatively low interfacial energy between Sn and the elements with a hexagonal close-packed crystal structure appears to promote the heterogeneous nucleation of β-Sn phases during solidification.Reference Cho, Kim, Seo and Lee25Figure 5 shows that Sn–1.0Ag–0.5Cu–0.02Be solder alloys that contain more than 0.03 wt% of Co have dual exothermal peaks during the cooling process. The new peak temperatures for the Sn–1.0Ag–0.5Cu–0.02Be solder alloys doped with 0.03 and 0.05 wt% Co are near 214 °C. These peak temperatures may be due to the formation of CoSn2 IMCs. Cheng et al.Reference Cheng, Nishikawa and Takemoto26 observed similar results in the presence of CoSn2 IMCs, with dual exothermal peaks at approximately 213 and 215 °C in Sn–3.0Ag–0.5Cu–0.2Co solders.
DSC measurement curves of the Sn–1.0Ag–0.5Cu (SAC, in wt%), SAC–0.02Be, SAC–0.02Be–0.01Co, SAC–0.02Be–0.03Co, and SAC–0.02Be–0.05Co solder alloys.

DSC results of undercooling in the Sn–1.0Ag–0.5Cu–xBe–xCo solder alloys.

C. Microstructure and microhardness of Sn–1.0Ag–0.5Cu–xBe–xCo solder alloys
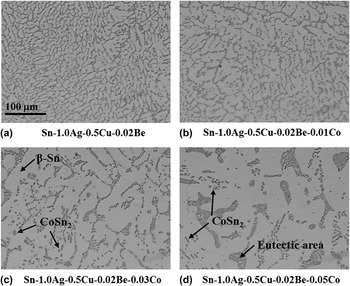
Optical microscopy was used to investigate the microstructural changes that accompany compositional changes in the solder. To investigate the microstructure, we mounted solder balls and cross-sectioned them by polishing. Figure 6 shows optical images of cross-sectioned Sn–1.0Ag–0.5Cu–0.02Be–xCo solder balls. The microstructure of the Sn–1.0Ag–0.5Cu–0.02Be–xCo solder consisted of β-Sn dendrites (light contrast), eutectic phases (dark contrast), and IMCs, which is typical for the Sn–Ag–Cu ternary alloy system. The microstructure of the Sn–1.0Ag–0.5Cu–0.02Be solder alloys was similar to that of Sn–1.0Ag–0.5Cu; however, the size of the β-Sn dendrites and the area of the eutectic region appeared to increase with increasing amounts of alloying Co. Figure 6 shows that a Co content greater than 0.03 wt% creates major microstructural changes that include larger β-Sn dendrites and a thicker eutectic region. Adding Co to the alloy causes microstructural changes because of the amount of undercooling that occurs during solidification. As a general rule, a smaller amount of undercooling results in a finer microstructure due to more nucleation sites.Reference Dudek, Sidhu, Chawla and Renavikar27, Reference Dudek and Chawla28 In this study, however, Co-doped solders experienced much less undercooling than solders that were not doped with Co and had microstructures characterized by larger β-Sn dendrites and thicker eutectic regions. This phenomenon occurs because nucleation and growth of the solidifying phases in the Co-doped solders occur at a higher temperature than the freezing temperature of Co undoped solders due to a smaller amount of undercooling. In general, the solidifying grains grow faster at high temperatures and form a large grain structure. Several studies have reported similar results to ours. For example, one study found that solders with less undercooling tended to have a coarse microstructure comprised of large β-Sn dendrites and thick eutectic regions. This behavior is especially evident during the casting of solder alloys,Reference Xiao, Nguyen and Armstrong29 when the volume of the solder alloys is controlled,Reference Gao and Takemoto30 and when a small amount of the Zn element is added.Reference Cho, Kang, Seo, Shih and Lee31 The microstructure of Sn–1.0Ag–0.5Cu–0.02Be and Sn–1.0Ag–0.5Cu–0.02Be–0.01Co solders display β-Sn dendrites and a eutectic region but no IMCs. However, as shown in Figs. 6(c) and 6(d), small CoSn2 IMCs can be observed for Sn–1.0Ag–0.5Cu–0.02Be doped with either 0.03 or 0.05 wt% Co. The small round CoSn2 IMCs are mainly located in the β-Sn matrix of the sample containing 0.03 wt% Co, but the morphology of the CoSn2 changed to rod-shaped particles after adding 0.05 wt% Co. As shown in Figure 5, this outcome agrees with the DSC results, which shows the formation of CoSn2 in Sn–1.0Ag–0.5Cu solder alloys containing more than 0.03 wt% Co.
Optical images of inside Sn–1.0Ag–0.5Cu–0.02Be–xCo solder balls with air cooling: (a) Sn–1.0Ag–0.5Cu–0.02Be, (b) Sn–1.0Ag–0.5Cu–0.02Be–0.01Co, (c) Sn–1.0Ag–0.5Cu–0.02Be–0.03Co, and (d) Sn–1.0Ag–0.5Cu–0.02Be–0.05Co.

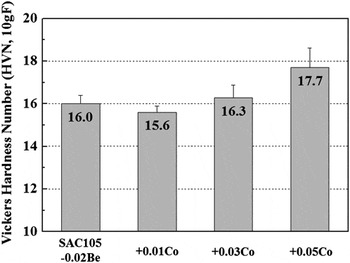
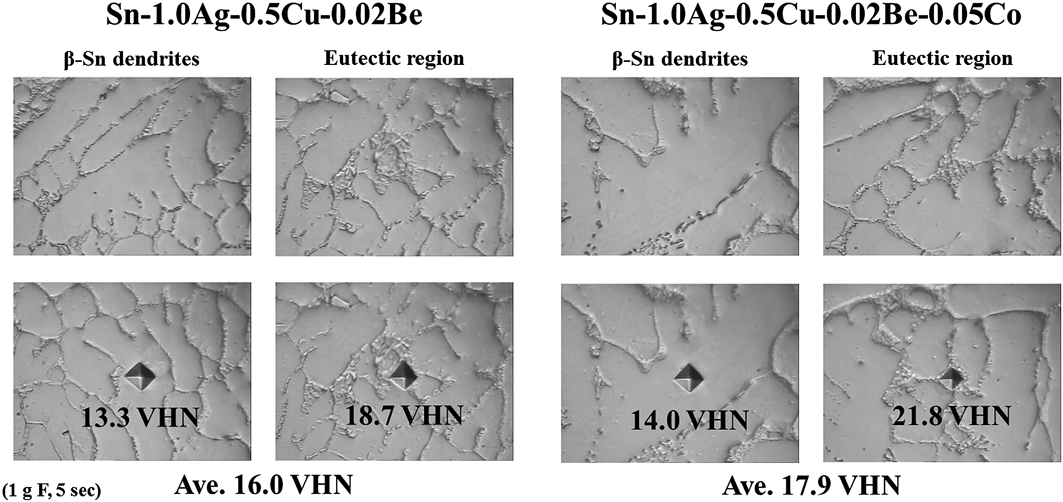
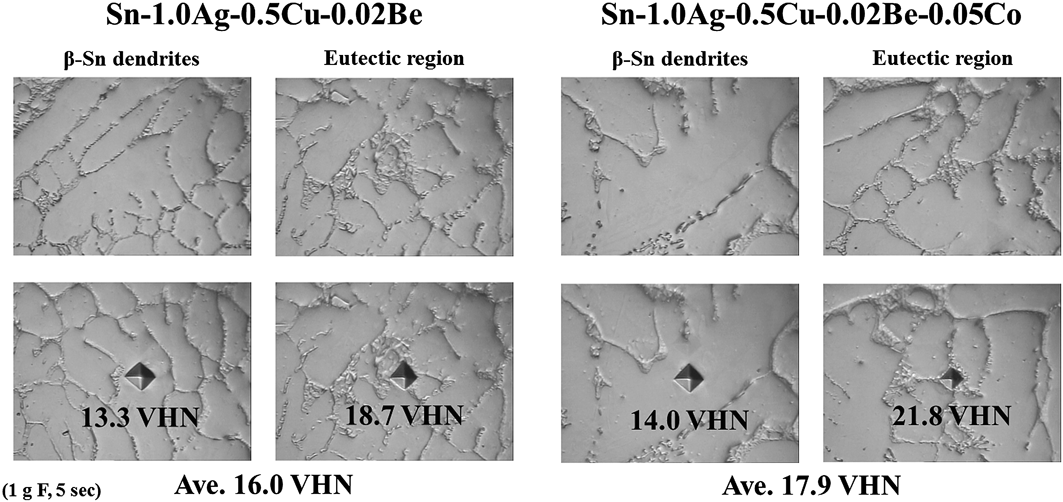
Microhardness testing was carried out to evaluate the mechanical properties of the given solder alloys. The test used a 10-g force load and a 5-s dwell time on a random surface of solder balls. The bulk solder balls used in the microhardness test were the same as those used for the microstructural observation. Figure 7 shows the VHN values of Sn–1.0Ag–0.5Cu–0.02Be–xCo solder alloys by Co content. The VHN value decreased slightly from 16.0 to 15.6 when 0.01 wt% of Co was added to the Sn–1.0Ag–0.5Cu–0.02Be solder alloys but increased steadily when the Co content exceeded 0.03 wt%. Remarkably, the VHN for the 0.05 wt% Co-doped solders increased by approximately 10% (from 16.0 to 17.7). The strengthening of solder alloys is generally related to the alloying elements, which contribute to the solid solution hardening and the precipitation hardening. However, the precipitation hardening effect of Co is difficult to elicit in Co-doped solders because of the low volume fraction of CoSn2. Therefore, to verify the solid solution hardening effect in Co-doped solders, we performed a microhardness test on both the β-Sn dendrites and the eutectic region, using a 1-g force load and a 5-s dwell time. Figure 8 shows optical micrographs of the β-Sn dendrites and eutectic region before and after the indentations; it also shows the VHN values of the selected region of Sn–1.0Ag–0.5Cu–0.02Be solder alloy samples with Co doping (0.05 wt%) and without Co doping. The addition of Co to Sn–1.0Ag–0.5Cu–0.02Be increased the VHN to 0.7 for the β-Sn dendrites and to 3.1 for the eutectic region. Solid solution hardening occurred in the β-Sn dendrites and the eutectic region when Co was added to the solder; however, the eutectic region was larger than the other regions. The VHN at the random location shown in Fig. 7 was similar to the average VHN value of the β-Sn dendrites and the eutectic region. Thus, the increase in microhardness number is due to Co-based solid solution hardening. The microhardness number reached its largest value when 0.05 wt% Co was added to the solder.
Microhardness results of the Sn–1.0Ag–0.5Cu–0.02Be–xCo solder alloys.

Microhardness results for the selected region of the Sn–1.0Ag–0.5Cu–0.02Be–xCo solder alloys.
D. Effects of Be and Co addition on the interfacial reaction with Cu and ENEPIG UBMs
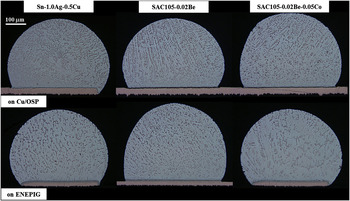
We also investigated the interfacial reaction between the UBM and the Be-doped and Co-doped Sn–1.0Ag–0.5Cu solders. Two types of UBM finishes were used: a Cu/OSP UBM and an ENEPIG UBM. The reflow process was conducted in a vacuum oven at 250 °C for 90 s and was repeated 1, 4, and 10 times. Figure 9 shows a cross section of Sn–1.0Ag–0.5Cu–xBe–xCo solders on Cu/OSP and ENEPIG UBMs after a single reflow. For Sn–1.0Ag–0.5Cu–0.02Be solders reflowed on a Cu/OSP UBM, the internal microstructure of the solder remained unchanged, regardless of whether Be was added. The size of the β-Sn dendrites and the area of the eutectic region remained constant when Be was added. However, when 0.05 wt% of Co was added to the Sn–1.0Ag–0.5Cu–0.02Be solders, the size of the β-Sn dendrites and the eutectic region increased; moreover, an increase in the size and amount of IMCs was also observed inside the solder. These results are similar to the microstructural changes observed in the bulk solder alloys. However, the internal microstructure of solder balls reflowed on the ENEPIG UBM differed from that of solder balls reflowed on Cu/OSP UBM. When 0.02 wt% Be was added to Sn–1.0Ag–0.5Cu solders, the β-Sn dendrites and the eutectic region became smaller. Nevertheless, for Sn–1.0Ag–0.5Cu solders doped with both Be and Co, the β-Sn dendrites and the eutectic region became larger than those of undoped Sn–1.0Ag–0.5Cu solder, and the IMCs were appreciably reduced. The microstructural changes have different trends in solders reflowed on an ENEPIG UBM because of the Ni element in the ENEPIG UBM.
Optical inside images of cross-sectioned solders on Cu/OSP and ENEPIG UBMs after a single reflow.

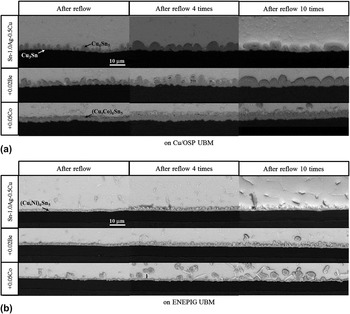
The SEM images in Fig. 10(a) show the interface of the given solders and the Cu/OSP UBM as a function of the reflow time. When Be was added, the IMCs showed no changes in the morphology or thickness at the interface on the Cu/OSP UBM; they were identified as Cu6Sn5 by EDS. When 0.05 wt% of Co was added to the solders, Cu6Sn5 changed to (Cu,Co)6Sn5 and the morphology at the interface was flat; there was no resemblance to the scallop-like morphology observed in the Sn–1.0Ag–0.5Cu and Sn–1.0Ag–0.5Cu–0.02Be solders. Similar results were found for Sn–3.5Ag–1.0Co solders on a Cu substrate.Reference Nishikawa, Komatsu and Takemoto32 Nishikawa et al.Reference Nishikawa, Komatsu and Takemoto32 reported that Co enhanced the nucleation site density for Cu6Sn5 by reducing the amount of undercooling; IMCs containing Co caused the morphology of Cu6Sn5 to become flat. The thickness of Cu6Sn5 on the Cu/OSP UBM increased from 4.4 to 5.2 μm after four reflows of all three solders. The increase was identical for each solder. However, there was no change in the thickness of Cu6Sn5 on the Cu/OSP UBM after more than four reflows. Although the thickness of Cu6Sn5 did not change, the scallop-like Cu6Sn5 became coarser with each reflow of the Sn–1.0Ag–0.5Cu and Sn–1.0Ag–0.5Cu–0.02Be solders but no changes were observed in the Sn–1.0Ag–0.5Cu–0.02Be–0.05Co solders.
SEM images of the interface in the Sn–1.0Ag–0.5Cu–xBe–xCo solders (a) on Cu/OSP and (b) on ENEPIG UBMs after reflow 1, 4, and 10 times.

The SEM images in Fig. 10(b) show the interface of the given solders and the ENEPIG UBM by the number of reflows. The EDS results show that Cu6Sn5 changed into (Cu,Ni)6Sn5 because of the Ni element in the ENEPIG UBM. Song et al.Reference Song, Liu, Su, Lai and Chiu33 confirmed the presence of (Cu,Ni)6Sn5 at the interface of the Sn–3.3Ag–0.5Cu–0.5Co solder on the ENIG UBM. No changes were observed when Be was added to the alloy; the thickness of (Cu,Ni)6Sn5 remained similar to that of Cu6Sn5 (1.7 μm). For the Sn–1.0Ag–0.5Cu solders (with and without Be doping), the thickness of (Cu,Ni)6Sn5 increased slightly to 2.1 μm during the first four reflows but remained constant thereafter. However, when Co was added to the solder, the interface of the solder on the ENEPIG UBM was quite different. Adding Co halved the thickness of (Cu,Ni)6Sn5 to 0.8 μm. Although the thickness of (Cu,Ni)6Sn5 was constant during repeated reflows, we observed numerous spalled IMCs at the interface on the ENEPIG UBM. Despite the IMC spalling, the thinness of the IMCs enabled the Co-doped solders to remain competitive for a limited number of reflows.
IV. CONCLUSIONS
We investigated how the addition of Be and Co affected the growth of Sn whiskers and the properties of Sn–1.0Ag–0.5Cu–xBe–xCo solders and studied the interfacial reaction of Cu/OSP and ENEPIG UBMs.
The addition of a Be alloying element restrained the growth of Sn whiskers on Sn–0.1Cu, Sn–0.5Cu, and Sn–1.0Ag–0.5Cu solders. The Be atoms appeared to disturb the diffusion of the solder system by acting as a substitute for Cu atoms or by occupying the interstitial sites of Ag and Sn. The random grain directions induced by the Be alloying element may also have helped suppress the growth of Sn whiskers.
The addition of Be and Co effectively reduced the undercooling of Sn–1.0Ag–0.5Cu solders. Adding more than 0.03 wt% Co to Sn–1.0Ag–0.5Cu–0.02Be reduced the undercooling significantly, and dual exothermal peaks from the formation of CoSn2 were observed during the cooling process.
The microstructures of Sn–1.0Ag–0.5Cu–0.02Be solder alloys were similar to those of Sn–1.0Ag–0.5Cu. However, the size of the β-Sn dendrites and the eutectic region appeared to increase with the amount of alloying Co. This behavior is attributed to the fact that there is less undercooling during the solidification process. The Sn–1.0Ag–0.5Cu–0.02Be solder doped with 0.03 wt% Co produced CoSn2 with a round microstructure, whereas the Sn–1.0Ag–0.5Cu–0.02Be solder doped with 0.05 wt% Co produced CoSn2 with a rod-shaped microstructure. Furthermore, the addition of Co to solders increased the microhardness number by affecting the solid solution hardening; the largest microhardness number was attained with the addition of 0.05 wt% Co to the solder alloys.
The addition of Be caused no changes in the morphology or thickness of Cu6Sn5 at the interface of the Cu/OSP UBM. However, the scallop-like Cu6Sn5 microstructure changed to a flat (Cu,Co)6Sn5 microstructure when 0.05 wt% of Co was added to Sn–1.0Ag–0.5Cu–0.02Be solders. However, Cu6Sn5 changed to (Cu,Ni)6Sn5 on the ENEPIG UBM. Moreover, numerous spalled IMCs were observed at the interface of Sn–1.0Ag–0.5Cu–0.02Be–0.05Co solders on the ENEPIG UBM.
ACKNOWLEDGMENTS
This study was supported by Iljin Materials Co., Ltd. Additional support by the Fundamental R&D Programs for Core Technology of Materials funded by Ministry of Knowledge Economy, Republic of Korea (10037275) is also acknowledged. We appreciate the support of Young Hoon Ha of the KAIST central research instrument facility for the SEM and EBSD analysis.