Personality is a crucial determinant of health and psychological outcomes (Bolger & Zuckerman, Reference Bolger and Zuckerman1995). Individuals with elevated neuroticism (N) experience more interpersonal stressors, perceive daily events as more threatening, and use maladaptive coping to combat stressors (Vollrath, Reference Vollrath2001). Previous studies have examined the influence of neurotic personality, especially under stressful situations, on individual, family, and marital functioning (Bolger & Schilling, Reference Bolger and Schilling1991; Bolger & Zuckerman, Reference Bolger and Zuckerman1995; Claxton, Rourke, Smith, & DeLongis, Reference Claxton, O’Rourke, Smith and DeLongis2012; Gunthert, Cohen, & Armeli, Reference Gunthert, Cohen and Armeli1999; Penley & Tomaka, Reference Penley and Tomaka2002). Neuroticism alone is responsible for 10% of all variance in marital satisfaction (Karney & Bradbury, Reference Karney and Bradbury1995). Personality also moderates the stress process, starting from the evaluation of the stress experience to the choice of coping strategies and ultimately to the emotional outcome. McCrae and Costa (Reference McCrae, Costa, Pervin and John1999) identified five core dimensions of personality: extraversion, agreeableness, conscientiousness, neuroticism, and openness to experience. The current study relates to neuroticism; therefore, the discussion will be limited to this dimension only.
Neuroticism
Zobel et al. (Reference Zobel, Barkow, Schulze-Rauschenbach, von Widdern, Metten, Pfeiffer and Maier2004) defined neuroticism as a temperamental sensitivity to negative stimuli. Neuroticism also refers to a predisposition towards experiencing anxiety, tension, self-pity, hostility, irrational thinking, impulsivity, self-consciousness, depression, and low self-esteem (Penley & Tomaka, Reference Penley and Tomaka2002). Ormel and Wohlfarth (Reference Ormel and Wohlfarth1991) assert that neuroticism accompanies a susceptibility to psychological distress and indicates a proclivity to hold unrealistic ideas, inefficient ways of coping with stress, and an inability to control urges. Neuroticism consists of two poles of a single dimension: emotional stability and negative emotionality; moreover, neuroticism has been used interchangeably with “negative affectivity” (McCrae, Reference McCrae1990; Ormel & Wohlfarth, Reference Ormel and Wohlfarth1991; Schwebel & Suls, Reference Schwebel and Suls1999). Furthermore, Eysenck's biological theory of personality claims that neuroticism is closely associated with an activity in the autonomic nervous system that causes higher sympathetic arousal and psychobiological reactivity in response to stressors (Eysenck, Reference Eysenck1967).
Stress
Stress is defined as a burden placed on individuals by external conditions that overwhelm their psychological capacities to adapt (McCrae, Reference McCrae1990). Bolger and Zukerman (Reference Bolger and Zuckerman1995) identified two fundamental stages of the stress process, which include stress exposure and stress reactivity. Stress exposure represents the degree to which a person is likely to experience a stressful event; whereas, stress reactivity is the degree to which a person is likely to manifest emotional or physical symptoms in response to a stressor (Bolger & Zukerman, Reference Bolger and Zuckerman1995). According to Dedovic, D'Aquiar, and Pruessner (Reference Dedovic, D’Aguiar and Pruessner2009), stress poses a threat to homeostasis, which is followed by a stress response to restore homeostasis. When a person perceives stress, deactivation of the hippocampus takes place, resulting in the dis-inhibition of the hypothalamic pituitary adrenal (HPA) axis. HPA is the main human stress hormone axis that leads to the release of glucocorticoids (cortisol) in the human body (Dedovic et al., Reference Dedovic, D’Aguiar and Pruessner2009). In controlled settings, researchers use different methods to induce stress, which include public speaking, recalling previous stressful experiences, and watching stressful films (Kirschbaum, Pirke, & Hellhammer, Reference Kirschbaum, Pirke and Hellhammer1993; Lazarus, Reference Lazarus1993). According to Nejtek (Reference Nejtek2002), psychological stressors such as public speaking, medical exams, parachute jumping, and watching suspenseful films such as “The Shining” and “Psycho” significantly increase human salivary cortisol above the "at-rest" baseline cortisol levels. Schneider, Rench, Lyons, and Riffle (Reference Schneider, Rench, Lyons and Riffle2012) examined the effect of a validated math stressor (partial Trier social stress test, TSST) on neuroticism, extraversion, and openness to experience. The primary and secondary appraisal were assessed through four items (two items each), and the affect was assessed through the positive affect and negative affect schedule (PANAS). The results show that neuroticism uniquely predicts greater threat appraisals, higher negative affect, and lower positive affect. Moreover, neuroticism negatively affects performance on the stress task due to experiencing greater threat (Schneider et al., Reference Schneider, Rench, Lyons and Riffle2012).
Neuroticism and negative affect
Neuroticism is an inclination towards experiencing negative affect; moreover, neurotic traits predispose individuals to suffer more acutely from one's misfortunes (McCrae, Reference McCrae1990). According to the contrast avoidance model, high neurotics maintain high baseline levels of negative affect that functions to reduce the degree of unexpected emotional shifts (Newman & Llera, Reference Newman and Llera2011). Mooradian and Olver (Reference Mooradian and Olver1994) also report that neurotic individuals show higher baseline or chronic negative affect. The relationship between neuroticism and negative affect can be explained by the following two views. The temperamental theory claims that neurotics are prone to experiencing negative affect in a given situation; whereas, the instrumental view proposes that neurotics may be putting themselves in more disadvantageous situations, which causes them to experience more negative affect (Mooradian & Olver, Reference Mooradian and Olver1994).
Neuroticism, appraisal, and coping
Vollrath (Reference Vollrath2001) asserts that personality outlines the stress process that begins at the stress appraisal, followed by the choice of coping techniques, and eventually leads to an emotional outcome. Neurotic individuals appraise stressors as more aversive and are prone to making negative appraisals of self, others, and their experiences when compared with low neurotic individuals, (Gunthert, Cohen, & Armeli, Reference Gunthert, Cohen and Armeli1999; Schwebel & Suls, Reference Schwebel and Suls1999). Neuroticism is also associated with feelings of ineffective coping ability (Schneider, Reference Schneider2004). Past research shows that in response to a major life event, neurotic individuals employ maladaptive emotion-focused coping (Penley & Tomaka, Reference Penley and Tomaka2002).
Present Study and Hypotheses
Schneider et al. (Reference Schneider, Rench, Lyons and Riffle2012) note that neuroticism is frequently examined in stress research; nevertheless, only a few studies have examined the influence of personality on stress appraisal and affect in response to an impending stressor. In the present study, the influence of neuroticism on stress and affect responses is explored. Notwithstanding that neuroticism is a continuous variable, the scope of this study is to determine the presence or absence of a significant difference in the stress perception and negative affect scores of the high and low N group. This difference, if it exists, would be remarkable in the extreme N groups; therefore, we examine only the extreme groups (top and bottom quartiles) for our study. The hypotheses of the present study include:
H1: The high N group will show higher baseline negative affect and higher stress perception, than the low N group, in response to the neutral pictures.
H2: The high N group will react with higher stress perception and higher negative affect, than the low N group, during the stress task.
H3: The high N group will maintain higher stress perception and higher negative affect, than the low N group, in response to positive pictures
Method
Participants
Potential participants for this study were recruited from the psychology research pool at San Jose State University (SJSU). Students were pre-screened to obtain a sample with extreme scores on the neuroticism subscale of the Big Five Inventory (BFI) that was developed by John, Donahue, and Kentle in 1991. The Institutional Review Board (IRB) approved the study and all ethical standards were complied with. Three hundred and sixty six SJSU students took the survey that comprised of demographic questions and 15 BFI items. The 15 BFI items included all eight neuroticism subscale items along with seven random fillers, which were not scored (Appendix A). Exclusionary criteria included self-reported anxiety, post-traumatic stress disorder, depression, and other affective disorders. After exclusion, three hundred and eleven participants were scored on N subscale and their scores were divided into quartiles. We examined the extreme groups (top and bottom quartiles) in our study. The low N participants (bottom quartile) were operationally defined as those who scored 18 or lower; while, high N participants (top quartile) were operationally defined as those who scored 28 or higher out of the maximum possible score of 40. Power analysis was conducted using G power (3.1; Faul, Erdfelder, Buchner, & Lang, Reference Faul, Erdfelder, Buchner and Lang2009) to estimate the total sample size with a power of 0.80 and medium effect size of 0.25. The total estimated sample size was 28 (14 per group). However, this study included 52 participants (34 women and 18 men; Mage = 19.5 years, SD = 2.42). The high N group included 24 participants (21 women and three men), and low N included 28 participants (13 women and 15 men). The participants were given one and a half hour of course credit for their participation; while those who did not need course credit were given monetary incentive.
Measures
The big five inventory (BFI)
The big five inventory contains 44 short and easy items that take five minutes to complete. BFI contains eight neuroticism subscale items, but the low number does not compromise “content coverage or psychometric properties” (John, Naumann, & Soto, Reference John, Naumann, Soto, John, Robins and Pervin2008, p. 130). The mean internal consistency of BFI neuroticism subscale is higher (0.87) than the mean internal consistency of all the subscales within BFI (0.83). Neuroticism scale includes items such as ‘I see myself as someone who a) does a thorough job; b) tends to find fault with others; c) is reserved; d) is depressed and blue…’ The response format is based on a 5-point scale (1= disagree strongly and 5 = agree strongly).
The positive affect and negative affect schedule (PANAS)
The positive affect and negative affect schedule (PANAS) developed by Watson, Clark, and Tellegen (Reference Watson, Clark and Tellegen1988) was used to assess momentary affect before, during, and after the stress task. The negative affect scale consists of 10 adjective items each with a negative connotation, such as afraid, ashamed, distressed, guilty, nervous, etc. The positive affect scale consists of 10 adjective items each with a positive connotation, such as alert, attentive, determined, enthusiastic, inspired, strong, etc. Watson et al. (Reference Watson, Clark and Tellegen1988) claim that both positive and negative affect scales are internally consistent, which gives PANAS high internal consistency reliability values (coefficient α = 0.84–0.90). Watson et al. also report that the reliability of the scales is unaffected by differing time instructions, such as right now, today, past few weeks, or in general. For this study, we were interested only in the momentary affect, whose reliability coefficient is .89 for PA and .85 for NA (Watson et al., Reference Watson, Clark and Tellegen1988). For this study, participants rated the degree to which they were experiencing each of the 20 mood conditions, at that particular moment, on a 5-point scale (1 = Not at All and 5 = Extremely). For this study, the analyses only included the NA subscale of PANAS. An additional adjective ‘stressed’ was included in the PANAS, as a manipulation check only, and was not included during scoring the NA subscale.
International affective picture system (IAPS)
In this study, all participants were shown 12 Footnote 1 neutral pictures (4.1 < M valence < 5.3; M arousal < 3.5 ) and 12 Footnote 2 positive pictures (M valence > 6.3; M arousal > 4.6 ) from the International Affective Picture System (IAPS) for eight seconds each, through a projector on the wall. The IAPS is the most widely employed instrument in a laboratory setting to manipulate affect, which consists of a standardized set of emotion-evoking colored photographs that vary in valence and arousal (Lang, Reference Lang1995; Lang, Bradley, & Cuthbert, Reference Lang, Bradley and Cuthbert2008). Lang (Reference Lang1995) reported split-half coefficients for valence and arousal as 0.93 and 0.94 respectively, and presented evidence that IAPS is largely culture free and can rapidly be administered. For this study, the neutral pictures included scenes of household objects; while, positive pictures included pleasant scenes. In prior mood studies, negative affect of healthy individuals diminished after exposure to positive pictures (Mendonca-De-Souza et al., Reference Mendonça-De-Souza, Souza, Vieira, Fischer, Souza, Rumjanek and Volchan2007).
Perceived stress scale (PSS)
The Perceived Stress Scale (PSS) is a brief scale that measures the perceived degree to which environmental demands exceed a person’s ability to cope (Cohen, Kamarck, & Mermelstein, Reference Cohen, Kamarck and Mermelstein1983; Cohen & Williamson, Reference Cohen and Williamson1988). For this study, a 10-item version of PSS was used that has a satisfactory internal reliability with Cronbach’s alpha equaling .78 (Cohen & Williamson, Reference Cohen and Williamson1988). Participants rated their momentary stress perception using a modified response format covering a short period on a 5-point scale (0 = not at all and 4 = completely).
Trier social stress test (TSST)
For this study, we used a widely administered psycho-social laboratory stressor, developed by Kirschbaum et al. (Reference Kirschbaum, Pirke and Hellhammer1993) at the University of Trier in Germany, called the Trier Social Stress Test. TSST consists of an anticipation period, which is followed by a preparation time to deliver a timed free speech and perform a timed mental arithmetic task. The performance is videotaped and judges provide feedback at the end of each performance (Kirschbaum et al., Reference Kirschbaum, Pirke and Hellhammer1993).
In the present study, to induce greater stress perception, TSST was manipulated. The usual TSST includes an anticipation period followed by preparation time and stress task performance. In the present study, to increase social evaluative threat, participants were included in the audience along with the judges similar to the study conducted by Childs, Vicini, and De Wit (Reference Childs, Vicini and De Wit2006). Smyth et al. (Reference Smyth, Ockenfels, Porter, Kirschbaum, Hellhammer and Stone1998) found that the cortisol levels increased not only with an acute stressor but also with an anticipation of an impending stressor. To further increase the perceived threat, a female mock participant (confederate) was included who poorly performed on the free speech and mental arithmetic task.
Procedure
All participants agreed to the terms of the study and signed the consent form. In the beginning, all participants viewed 12 neutral pictures (one after the other without any interval) for eight seconds each. After viewing the pictures together, all participants completed PSS and PANAS based on their momentary feelings (Appendices B & C). Once the completed inventories were collected, participants were convinced that each participant would be asked to deliver a five-minute free speech and perform a three-minute mental arithmetic task, while being videotaped, in the presence of two judges and other participants. The instructions were followed by five-minute preparation time, after which two judges entered the room with a video camera. The video camera was set, and participants were informed that judges would randomly select participants, one by one, for performance. The mock participant was selected, as planned, and the judges used a stop-watch to signal the beginning and end of the allowed speech time. The mock participant performed poorly and delivered a pre-scripted speech. The judges intently listened and made notes. At the end of the speech, the judges gave a pre-scripted poor performance feedback. The mock participant was then asked to loudly serially subtract the number 13 from 1022 for three minutes. The mock participant made pre-scripted mistakes and was asked to start over from 1022 after every mistake. A pre-scripted poor performance feedback was given again at the end of the arithmetic task. As planned, the judges sought time to finalize their comments before the next performance. The PSS and PANAS were repeated for the second time. Once the completed inventories were collected, one judge announced that the previous speech had not been recorded due to a technical fault. The researcher announced that the speech and mental arithmetic part would need to be cancelled. After that, all participants viewed a set of 12 positive pictures (one after the other without any interval) for eight seconds each. After all the pictures were shown, the PSS and PANAS were repeated for the last time. Once the last set of completed inventories were collected, participants were debriefed and given information about the campus-counseling center. Before their dismissal, they were asked whether their mood and stress level changed after each treatment condition. The participants confirmed that anticipation of giving a speech and performing an arithmetic task was successful in inducing stress.
Results
Statistical Analyses
Statistical analyses were performed using SPSS (version 20.0). The data were analyzed using the 2x3 mixed design general linear model (GLM) repeated measures and independent sample t-tests (with a pre-determined alpha value of .05). Personality was the quasi-independent variable. The dependent variables were the perceived stress scores on the PSS and negative affect scores on the NA subscale of the PANAS. The between-groups condition was high and low neuroticism and the within-groups conditions were repeated measures (before, during, and after the stress task). The within group design was used to mimic people's routine fluctuations in mood and stress level, and also to assess their perceptions regarding the intensity of stress and their subsequent affect during those fluctuations. The hypotheses were tested to see whether high N group would report higher stress perception and higher negative affect after each of the three treatment conditions.
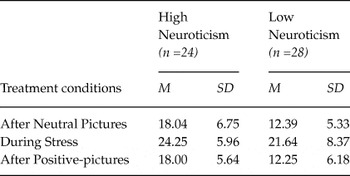
Table 1 shows the mean differences between high N group and low N group on PSS during the three treatment conditions. For stress perception, GLM tests of between-subjects effects revealed a main effect for neuroticism, F(1, 50) = 10.51, p = .002, ηp 2 = .17, suggesting that on average across all three conditions there is a significant difference between low and high neurotics. Similarly, GLM tests of within-subjects effects showed a main effect for condition F(2, 100) = 44.68, p < .001, ηp 2 = .47, indicating that the perceived stress mean scores differed significantly between the treatment conditions. However, for stress scores, there was no interaction between neuroticism and any of the three time conditions, F(2, 100) = 1.8, p = .176, ηp 2 = .03. After neutral pictures, t-test show a significant difference in the PSS scores of high N group (M = 18.04, SD = 6.75) and low N group (M = 12.39, SD = 5.33); t(50) = –2.95, p = .005. During the stress task, t-test show a non-significant difference between the PSS scores of high N group (M = 24.25, SD = 5.96) and low N group (M = 21.64, SD = 8.37); t (50) = –1.27, p = .200. After positive pictures, t-test again show a significant difference between the PSS scores of High N group (M = 18.00, SD = 5.64) and low N group (M =12.25, SD = 6.18); t(50) = –3.42, p = .001.
Mean and Standard deviation of Perceived Stress Score between high neuroticism and low neuroticism group during three treatment conditions (N =52).

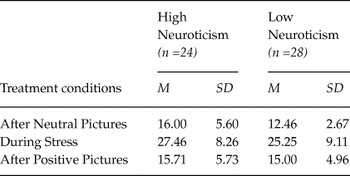
Table 2 shows the mean differences between high N group and low N group on PANAS during the three treatment conditions. For the negative affect mean scores, GLM tests of between-subjects effects did not reveal a main effect for neuroticism, F(1, 50) = 2.46, p = .123, ηp 2 = .05, suggesting that on average across all three conditions there is a non-significant difference between low and high neurotics. But, GLM tests of within-subjects effects showed a main effect for condition F(2, 100) = 83.97, p < .001, ηp 2 = .63, indicating that the negative affect mean scores differed significantly between the treatment conditions. However, for negative affect scores, there was no interaction between neuroticism and any of the three treatment conditions, F(2, 100) = 0.94, p = .338, ηp 2 = .02. After neutral pictures, t-test reveal a significant difference between the NA scores of the high N group (M = 16.00, SD = 5.60) and low N group (M = 12.46, SD = 2.67); t(50) = –3.37, p = .001. During the stress task, t-test reveal a non-significant difference between high N group (M = 27.46, SD = 8.26) and low N group (M = 25.25, SD = 9.11); t(50) = –.91, p = .367. After positive pictures, t-test did not show a significant difference in the NA scores of high N group (M = 15.71, SD = 5.73) and low N group (M = 15.00, SD = 4.96); t(50) = –.441, p = .661.
Mean and Standard deviation of Negative Affect Score between high neuroticism and low neuroticism group during three treatment conditions (N =52)

Discussion
In agreement with our first hypothesis, after neutral pictures, we found a significant difference in the baseline stress perception and negative affect scores of high N and low N groups. The high N group showed a significantly greater stress perception and a higher negative affect. If elevated N and stressful experiences predispose individuals to illnesses, then the results from our study imply that individuals high in N may be at health risk due to being in a chronic higher state of stress perception and negative affect. Schneider (Reference Schneider2004) reports that neuroticism intensifies stress reactivity, which in turn causes greater stress vulnerability and negative health outcomes. Our findings are in line with previous studies that support that high N individuals experience chronic negative affect and also that people with elevated N report higher base level of negative affect, even in the absence of a stressful situation (Costa & McCrae, Reference Costa and McCrae1980; Mooradian & Olver, Reference Mooradian and Olver1994; Vollrath, Reference Vollrath2001).
Contrary to our second hypothesis, we found non-significant differences between the stress perception and negative affect scores of high N and low N groups, during the stress task. These finding are in contrast with other studies that reported that high N individuals show greater reaction and appraisal to the same stressful event, and elevated stress levels are accompanied with greater increases in negative affect, than the low N individuals (Gunthert, Cohen, & Armeli, Reference Gunthert, Cohen and Armeli1999; Schneider et al., Reference Schneider, Rench, Lyons and Riffle2012; Vollrath, Reference Vollrath2001). One reason for this conflicting finding may be because Schneider et al. (Reference Schneider, Rench, Lyons and Riffle2012) only used the mathematical segment of TSST to induce stress; while, we manipulated TSST and also added a confederate to induce stress. Other studies that showed contradictory findings measured fluctuations in cortisol levels, which is a natural body response to stress; while in our study, we assessed the momentary stress perception and affect using PSS and PANAS during the three treatment conditions. From the conflicting findings of our and previous studies, it may be inferred that, if the cortisol level of high N group is higher during stress, there may be a delay in the natural body response and actual experience of stress. Put simply, higher body cortisol levels may have to be maintained for a longer time before greater stress perception and higher negative affect can be experienced and reported. One possible explanation of the non-significant increase in the negative affect score of the two groups, during the stress task, could be because the high N group started with significantly higher negative affect than the low N group. Therefore, the high N participants may have reached their respective threshold for negative affect.
For our last hypothesis, high N group show significantly higher stress perception scores, but not higher negative affect scores, than the low N group, after positive pictures. It is interesting to note that after positive stimuli, both groups went back to their respective baseline stress perception scores, which were significantly higher than the low N group. However, after positive pictures, the low N group showed higher NA scores than its baseline NA score; whereas, the high N group went back to its baseline NA scores. One possible explanation for the High N group responding more positively to the pleasant pictures may be attributable to the gender differences. A study by Bradley, Codispoti, Sabatinelli, and Lang (Reference Bradley, Codispoti, Sabatinelli and Lang2001) suggests that women report more happy emotions when they view pictures of babies and families, as compared to men. Men report more happy emotions in response to erotic pictures, as compared to women. Therefore, the null result for the third hypothesis may be due to the selection of pleasant pictures (mostly families) and high N group, which consisted mostly of women. Mendonca-De-Souza et al. (Reference Mendonça-De-Souza, Souza, Vieira, Fischer, Souza, Rumjanek and Volchan2007) presented healthy subjects with either a block of pleasant or unpleasant pictures to induce positive or negative mood before a psychological stress task. The results showed that negative affect increased after the stress task and decreased significantly after exposure to pleasant pictures, when compared to their baseline scores. This study finds that, in a neuroticism paradigm, positive pictures are a reliable source of restoring the stress-induced negative affect back to the respective base-level negative affect. To our knowledge, this was the first study that used partial TSST with a special manipulation to induce stress. The manipulation checks along with the fluctuation in scores confirmed that the partial TSST successfully induced stress in both groups.
The inferences from this study are limited in some ways. First, the results from this study can only be generalized to the young population, since most (91%) of our study sample was between the ages of 18 to 20 years. Second, though the partial TSST successfully produced stress, we did not measure the cortisol levels during the study. Moreover, we did not track the amount of sleep, smoking, and food intake before the study. Previous research shows that these variables are associated with an increase in cortisol levels (Hanson, Maas, Meijman, & Godaert, Reference Hanson, Maas, Meijman and Godaert2000). Moreover, an unequal number of males and females in both groups may also have affected the results. Future studies can measure cortisol at base-level and after also after each manipulation. Future studies can also limit the amount of food intake before the experiment, measure sleep before the study, and either exclude smoking as a blocked variable or add it as a covariate.
The author wishes to acknowledge the extraordinary support of the San Jose State University (SJSU), Psychology faculty, particularly Dr. Gregory Feist, Dr. Ronald Rogers, Dr. Clifton Oyamot, Dr. Neelam Rattan, Dr. Sheila Bienenfeld, and Dr. Mildred Alvarez
Appendix A

Appendix B

Appendix C