A Hawthorne effect found in election studies is that pre-election survey participation increases voter turnout (for example, Clausen Reference Clausen1968). Using the Swedish National Election Studies (SNES), Granberg and Holmberg (Reference Granberg and Holmberg1992) showed evidence in support of this effect 20 years ago. However, their findings have recently been criticized and experimental studies have failed to find any positive treatment effect of survey participation (Mann Reference Mann2005).
I re-examine an updated version of Granberg and Holmberg's time-series cumulative data file covering eight additional election studies (14 in total). These studies are very well suited to evaluate this question, since they have an experimental component randomly assigning half of the sample to be interviewed before the election and the other half to be interviewed after the election. By comparing validated turnout in the pre-election sample with the turnout in the post-election sample, it is possible to estimate the causal effect of survey participation on voter turnout. The main contribution of this study compared to previous research in the field is the superior external validity of the research design.
The results presented in this study show that participating in the pre-election survey indeed has a significant and positive effect on voter turnout. Moreover, the article evaluates whether the treatment effect is unevenly distributed in the population. Results show that the treatment effect is larger for citizens with a low propensity to vote than citizens with a high propensity.
An important question that previous studies have not been able to study is whether survey participation has any long-term effects. Results show that participating in an election survey can have significant effects on voter turnout several years later.
Theory
A Hawthorne effect means that people change their behavior as a consequence of being research subjects. The effect got its name from the studies conducted at the Hawthorne Works factory. Researchers claimed to show that factory workers changed their actions as a result of the research projects that went on at the factory.Footnote 1
Clausen (Reference Clausen1968) is usually credited as the first to demonstrate a Hawthorne effect in election studies. He compared voter turnout among participants in the University of Michigan's pre-election survey with turnout levels among participants in a post-election survey carried out by the Census Bureau. Clausen showed that the participants in the pre-election survey voted more frequently (a treatment effect of about 6 percentage points).
While other studies replicated—and, to a large extent, confirmed—Clausen's findings (for example, Kraut and McConahay Reference Kraut and McConahay1973; Yalch Reference Yalch1976), criticism of these early studies remains. Clausen relied on self-reports of voter turnout, and it is well known that some individuals over-report electoral participation (cf. Belli, Moore and VonHoewyk Reference Belli, Moore and VanHoewyk2006; Holbrook and Krosnick Reference Holbrook and Krosnick2010; Granberg and Holmberg Reference Granberg and Holmberg1991; Persson and Solevid Reference Persson and Solevid2014). In addition, since the pre- and post-election surveys compared in Clausen's study came from different studies, it was not a true experiment with a randomized treatment. Kraut and McConahay's (1973) study had a very small sample size, which makes it hard to draw conclusions from this study.
The study of Granberg and Holmberg (Reference Granberg and Holmberg1992) overcomes most of these problems. In the SNES, respondents are randomly assigned to either the pre- or post-election survey. Hence, these election studies incorporate the design of a randomized experiment. Moreover, the SNES surveys include measures of validated voting from the official register files. Granberg and Holmberg used six election studies from national parliamentary elections (1973–88) and found an average treatment effect of about 2 percentage points. This might seem small, but Sweden is a high-turnout context in which it is not possible to increase voting drastically, given the already high levels. In their pooled sample, voter turnout was 93 percent in the pre-election study and 95 percent in the post-election study. Moreover, they found a slightly higher effect among citizens with low levels of political interest than with high levels.
Granberg and Holmberg could not establish the exact causal mechanism at work, but it seems reasonable to believe that talking about politics stimulates the survey participants’ political interest, and as a consequence they become more likely to cast their votes on election day. This assumption could be strengthened by recent experimental work showing that inducing feelings of social desirability affects the likelihood of voting (for example, Gerber, Green and Larimer Reference Gerber, Green and Larimer2010; Panagopoulos Reference Panagopoulos2010). In the SNES pre-election survey, participants were asked whether they intended to vote. It is likely that many respondents would give a positive answer, given that when providing answers in surveys, participants may have a desire to express attitudes that concur with social norms. Studies have shown that asking individuals whether they intend to vote increases their actual voting rates (Greenwald et al. Reference Greenwald, Carnot, Beach and Young1987).Footnote 2 Moreover, during the last decade a large number of studies has shown that citizens can be mobilized by means such as personal canvassing, phone calls and mail (Gerber and Green Reference Gerber and Green2000; Green and Gerber Reference Green and Gerber2008; Gerber, Green and Larimer Reference Gerber, Green and Larimer2008, Reference Gerber, Green and Larimer2010). Granberg and Holmberg's study provides evidence that participating in an election survey can have the same kind of mobilizing effect. To sum up, there are two possible causal mechanisms that explain why survey participation increases turnout: it might increase political interest or participants might feel social pressure to vote. Neither previous research nor this study can establish which of these two possible mechanisms mediates the effect.
The most recent attempt to analyze the effect of survey participation on voter turnout comes from three large-scale experiments in US states during the 2002 elections (Mann Reference Mann2005). In these experiments, the treatment was a 10–12 minute interview, and voter turnout rates were subsequently validated with register files. Mann found no significant effect of pre-election survey participation on voter turnout in these experiments. He also criticizes previous studies; for example, he argues that Granberg and Holmberg's results show “small effects that are easily within the sampling variability” (2005, 156).
However, Mann's study has some limitations. The treatment was relatively weak compared to the treatment in the SNES, since it consisted of only a short telephone interview. From previous research we know that interviewer effects are stronger when there is more interaction with an interviewer (Kreuter, Presser and Tourangeau Reference Kreuter, Presser and Tourangeau2008; Díaz de Rada Reference Díaz de Rada2011). Therefore the reason why no effect was found in Mann's study might be that the treatment was too weak to produce any significant effect. The treatment in the SNES studies should be more relevant to other researchers, since this treatment better resembles most election studies.
Data
The SNES are very well suited to estimate the effect of survey participation on voter turnout. First, they consist of samples of the entire adult Swedish national population drawn from the official registers (there is no separate voter registration process in Sweden).Footnote 3 Hence, no individuals were excluded because they were not registered voters or because they did not have a telephone. Second, they have an experimental component that randomly assigns half of the individuals to a pre- or post-election interview. Third, they are two-wave panels between elections (meaning that at each election, half of the sample was included in the previous election survey and the other half of the sample will be included in the next election survey), rendering it possible to test the long-term effects of survey participation on voter turnout. Randomization to the panel waves was made independently of the randomization to the pre- and post-election groups. For each new election, respondents were randomized into a pre- or a post-election survey. Fourth, voter turnout was measured using validated information from the official register files. Hence, there is no uncertainty in the dependent variable due to social desirability bias. Fifth, the stimulus is strong; the interviews are approximately one-hour-long face-to-face interviews. Sixth, they cover a large timespan that makes it possible to test whether the effect is robust over time and in different election contexts.
The SNES surveys are conducted by the University of Gothenburg in collaboration with Statistics Sweden.Footnote 4 The first study was conducted in 1956, and it has since been conducted in conjunction with every national parliamentary election. It includes a random sample of Swedish citizens 18–80 years old. This article uses the 12 parliamentary studies conducted from 1973–2010 and the studies from 1960 and 1964.Footnote 5 Since 1973, the SNES surveys have been two-wave panels.Footnote 6 When we study the long-term effects of participation the sample is restricted to the 12 studies performed after 1973.Footnote 7
During the time period under study, voter turnout has been relatively high in Sweden. The highest level of turnout during this period was in 1973 (92 percent) and the lowest in 2002 (80 percent). Voter turnout was lower for those not participating in the study (on average 76 percent for the pooled dataset).
Modeling Strategy
To estimate whether the treatment effect is unevenly distributed among the population, this article adopts an approach recently introduced by Enos, Fowler and Vavreck (Reference Enos, Fowler and Vavreck2014) in an analysis of whether “Get Out The Vote” experiments affect inequalities in turnout. Previous tests of whether this kind of treatment effect differs in the population have interacted the treatment variable with variables such as political interest or age. The approach presented by Enos, Fowler and Vavreck reduces all pre-treatment influences on the probability of voting into one dimension. This approach facilitates comparisons between different studies and elections. Moreover, combining all variables that predict voter turnout into one variable facilitates more easily interpretable and informative tests of whether the treatment effect differs for individuals with different propensities to vote. Since the propensity scores are formed ex ante, it reduces model specification issues.
More precisely, the following steps were conducted. For each election survey a regression model was fit in which turnout was regressed on a number of explanatory factors. This model was estimated in the control groups only (post-election samples). These models included age, age squared, voting in the previous election, education, political interest, civil status, rural/urban residence, amount of newspaper reading, amount of watching TV news and the amount of involvement in discussions about politics.Footnote 8 R-squared for these models varied between 0.15 and 0.30.
From each of these models a propensity score variable was produced that measured the a priori propensity of voting in the absence of any treatment. Since individuals were assigned to the pre- or post-election survey by randomization, this a priori propensity should be equal in the treatment and control groups. Values on the propensity variable were calculated for each individual in the treatment groups using imputation to represent their a priori probability to vote. In order to be able to compare this variable between different election studies, it was rescaled to have a mean of 0 and a standard deviation of 1. After this step, all election studies were pooled and the propensity variables from each study were combined into a single propensity variable. At that point, all respondents in the dataset had a new variable indicating the a priori propensity to vote. By interacting this variable with the treatment variable, it is possible to compare the effect of the treatment across individuals with different propensities to vote.
Results
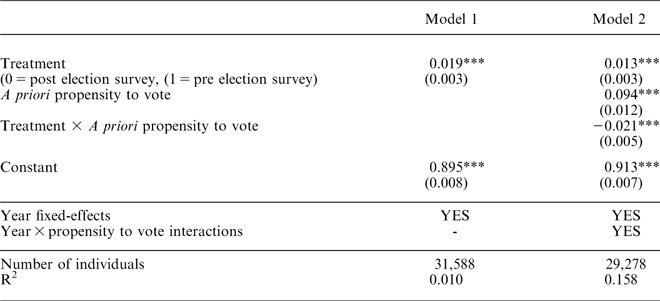
We begin by looking at the main effect of survey participation. Table 1 presents the short-term effects of survey participation. Since the surveys are two-wave panels between elections, those who participated in a previous panel wave were excluded from this analysis. The left column in Table 1 shows the results from a regression model in which voter turnout is regressed on the treatment variable (all models also include year-fixed effects to control for differences across studies).Footnote 9
Effects of Participation in a Pre-election Survey on Voter Turnout

Note: OLS regression with heteroskedasticity-corrected standard errors. Standard errors in parentheses, *p < 0.10, **p < 0.05, ***p < 0.01.
The coefficient for the treatment variable is highly significant.Footnote 10 Translated into predicted probabilities, turnout among individuals in the control group was 91.0, while turnout in the treatment group was 93.1.Footnote 11 This corresponds to a difference of 2.1 percentage points between the treatment group and the post-election survey participants.Footnote 12 Given that the response rate in this pre-election sample was 74 percent, the treatment effect is 2.8 percentage points when controlling for the response rate (using the formula proposed by Angrist, Imbens and Rubin Reference Angrist, Imbens and Rubin1996).Footnote 13
The differences in turnout between the pre- and post-election samples are shown in Figure 1 and the treatment effects for each study are shown in Figure 2. Looking at each separate election, turnout among pre-election participants is higher than among post-election participants in 13 of the 14 election studies. For most of the studies, the treatment effect is 1–4 percentage points. These are not necessarily large effects, but they are statistically significant and occur regularly over time.
Voter turnout among pre- and post-election participants by year
Treatment effect by year
Model 2 in Table 1 tests the interaction between the a priori propensity to vote and the treatment. In addition to year-fixed effects, the model also includes study-propensity interactions to control for differences in the propensity variable across elections. We find a significant interaction term between the treatment and propensity variable, indicating that the treatment effect varies for individuals with different levels of vote propensity. To facilitate a more detailed interpretation of the treatment effect for individuals with different vote propensities, Figure 3 shows results from kernel regression. The solid line represents the probability of voting for individuals who experienced the treatment, while the dashed line represents the probability of voting for individuals in the control group.Footnote 14 The graph shows that the treatment has no effect on persons with a mean level, or higher than the mean level, of a priori propensity to vote. But as the propensity to vote decreases, the treatment effect gets larger. For persons with voting propensity below the mean, the predicted treatment effect is of substantial size.Footnote 15
Treatment effect by different propensities to vote Note: The graph shows the effect of participation in a pre-election survey on voter turnout for individuals with different levels of a priori propensity to vote. Results from kernel regression.
We turn next to the long-term effects of voting. From 1973 to 1994 elections were held every three years, and thereafter elections were held every four years. For these analyses we also include those who participated in the past wave of the election surveys. Figure 4 shows predicted probabilities of voting for individuals who participated in the pre- and post-election surveys and who were (or were not) included in the previous wave.Footnote 16 The results show clear evidence of long-term effects of survey participation. Persons who did not participate in the election study before and were interviewed after the election showed the lowest level of turnout. The highest level of turnout was among those who had participated in the previous wave of the panel study and were included in the pre-election survey (that is, they had experienced the treatment twice). The estimated difference between this group and those who did not participate in any election study before the election is about 3 percent.
Long-term effects of participation in a pre-election survey on voter turnout
To gauge whether the long-term effect differs for individuals with different levels of a priori propensity to vote, we turn to Figure 5. Again we find that survey participation has no effect on persons with a high propensity to vote. But for persons with a low propensity to vote, participation in the pre-election survey increases turnout. In particular, survey participation has a strong effect for low-propensity voters who took part in two election surveys prior to election day.
Long-term treatment effect among respondents with different levels of propensity to vote Note: the graph shows the long-term effect of participation in a pre-election interview and previous survey participation on voter turnout for individuals with different levels of a priori propensity to vote. Results from kernel regression.
Conclusion
To summarize, this article brings three contributions to the debate. First, it reconfirms the conclusion from Granberg and Holmberg's study by showing that the effect of survey participation on voter turnout is stable over time in Swedish national representative data covering 14 elections over 50 years. Second, it shows that the treatment effect is unevenly distributed in the population: it is stronger for individuals with a low propensity to vote. Third, it tests the long-term effects of survey participation and confirms that it has an impact on voter turnout even several years later. The SNES has the important advantage of covering the entire population, which makes it possible to draw conclusions about a treatment effect in the population, and it relies on official register data of validated voting. This is important, since studies show that politically engaged citizens consistently misreport voting (for example, Ansolabehere and Hersch Reference Ansolabehere and Hersh2012; Granberg and Holmberg Reference Granberg and Holmberg1991) and that any study drawing on self-reported voting would likely be biased.
The long-term effects found in this study reveal a particularly important message about the potential impact of election studies. To my knowledge, the only previous study examining the effects of survey participation on voting in subsequent elections is that of Yalch (Reference Yalch1976). But his study examined two elections during a short time span and failed to show any long-term effects. This study, on the other hand, shows that the treatment effect remains several years later and that it is strong in magnitude for low-propensity voters.
The stimulus in the SNES surveys is strong—roughly one-hour face-to-face interviews—and it is possible that this kind of stimulus is necessary in order for the treatment to have effect. Shorter interviews via telephone or mail may have weaker effects, which may explain the differences between studies. But the relevant question here is which treatment has the most relevance to other researchers? One major reason to study this question is to understand how election studies bias our inferences about populations. Since many of the major election studies used in political science, such as the ANES, are rather similar to the SNES, the results from this study should be more relevant to other researchers than those from studies using, for example, shorter telephone interviews. In other words, we should care about the Hawthorne effect found in this study since the most important surveys in political science have this kind of strong treatment. In fact, the treatment used in Mann's study does not match the treatments of most election surveys. Consequently, the contribution of this study compared to previous research in the field is, first and foremost, the superior external validity of the research design.
To conclude, election studies might have unintended long-term consequences on participants’ political behavior that we have previously been unaware of. Electoral research does not only study the political behavior of individuals; it also changes the political behavior of the participants studied. However, the exact causal mechanism at work remains hidden. A Hawthorne effect suggests that mere participation in the study affects behavior. But some studies have concluded that the observed increase in turnout was based on subjects being asked to predict whether they would vote (Greenwald et al. Reference Greenwald, Carnot, Beach and Young1987; Spangenberg and Greenwald Reference Spangenberg and Greenwald1999). In the broader literature this is referred to as a question-behavior effect (Sprott et al. Reference Sprott, Spangenberg, Block, Fitzsimons, Morwitz and Williams2006). In the SNES surveys, respondents were asked whether they intended to vote, in addition to other questions related to their behavior in the upcoming election.Footnote 17 It is an open question whether these particular questions regarding future behavior, or merely participation in a pre-election survey, triggers voter turnout. Further studies could answer this question by randomly assigning survey questions about future participation to some respondents in the pre-election sample, while other respondents are not assigned questions about future behavior.