1 Introduction
Turbulent mixing in stratified flows is found in many geophysical and industrial situations and relies on a complex process where the kinetic energy is irreversibly converted into potential energy (Fernando Reference Fernando1991; Fernando & Hunt Reference Fernando and Hunt1996). The present paper considers the case of an initially sharp density interface impinged by a turbulent round jet. The discharge of light fluid (water) of density
 $\unicode[STIX]{x1D70C}_{1}$
from the nozzle impinges onto a volume of denser fluid (salt water) of density
 $\unicode[STIX]{x1D70C}_{2}>\unicode[STIX]{x1D70C}_{1}$
, such that the outflow of the jet is orthogonal to the initial density interface. The jet is driven by an upstream pump. The salt water is progressively mixed with the fresh water until the gradients of concentration disappear. In this process, two mechanisms can be identified: entrainment and mixing. The entrainment corresponds to the advection at the interface of dense fluid patches into the lighter fluid, where the flow is turbulent. The mixing consists in the thinning of the fluid patches by the turbulence until the spatial scale reaches the molecular diffusion scale, where both fluids are irreversibly mixed. The turbulent entrainment is quantified by the entrainment rate (Baines Reference Baines1975)
 $$\begin{eqnarray}E_{i}=\frac{Q_{e}}{\unicode[STIX]{x03C0}{b_{i}}^{2}u_{i}},\end{eqnarray}$$
where
 $Q_{e}$
refers to the volume flux entrained across the interface, and
 $u_{i}$
and
 $b_{i}$
correspond to the vertical velocity and the width of the jet at the interface. Baines (Reference Baines1975) suggested that, for a turbulent flow, the entrainment rate
 $E_{i}$
depends only on the interfacial Froude number, where the Froude number is
 $Fr_{i}=u_{i}/\sqrt{b_{i}g^{\prime }}$
, with
 $g^{\prime }=g(\unicode[STIX]{x1D70C}_{2}-\unicode[STIX]{x1D70C}_{1})/\unicode[STIX]{x1D70C}_{1}$
the reduced gravitational acceleration. The Froude number characterizes the competition between the inertial force, which perturbs the interface, versus the restoring buoyancy force. Since Baines (Reference Baines1975), the entrainment flux has been commonly expressed as a power-law function of
 $Fr_{i}$
with
 $E_{i}\propto Fr_{i}^{n}$
and
 $n\in [0,3]$
.
The significant scatter in measurements of the entrainment rate has been summarized in a recent review by Shrinivas & Hunt (Reference Shrinivas and Hunt2014) for jet, plumes and fountains. They report the entrainment rates of different studies (Baines Reference Baines1975; Kumagai Reference Kumagai1984; Baines, Corriveau & Reedman Reference Baines, Corriveau and Reedman1993; Lin & Linden Reference Lin and Linden2005) and they show that, at low Froude number, two distinct trends are observed. The measurements of Baines et al. (Reference Baines, Corriveau and Reedman1993) and Lin & Linden (Reference Lin and Linden2005) for fountains and of Baines (Reference Baines1975) for plumes follow approximately the scaling law
 $E_{i}=0.07Fr_{i}^{3}$
for
 $0.3<Fr_{i}<1.4$
. The measurements of Kumagai (Reference Kumagai1984) for a plume display a distinct branch with larger entrainment rates. Kumagai (Reference Kumagai1984) originally characterized the scaling law by
 $E_{i}\sim Fr_{i}^{3}$
for small Froude numbers, but Shrinivas & Hunt (Reference Shrinivas and Hunt2014) propose the scaling law
 $E_{i}=0.24Fr_{i}^{2}$
. Cotel et al. (Reference Cotel, Gjestvang, Ramkhelawan and Breidenthal1997) have also studied the entrainment rate for an impinging jet. They observed two different behaviours: a linear scaling with
 $E\propto Fr_{i}$
for
 $0.3<Fr_{i}<1$
, which decays to a constant for
 $Fr_{i}<0.14$
. A universal law for the entrainment rate as a function solely of the Froude number seems to be ruled out by the previous experimental investigations, which suggest that other parameters must be taken into account.
Breidenthal (Reference Breidenthal1992) and Cotel & Breidenthal (Reference Cotel and Breidenthal1996) proposed to characterize the regimes with the Reynolds number
 $Re=u_{i}b_{i}/\unicode[STIX]{x1D708}$
, where
 $\unicode[STIX]{x1D708}$
is the kinematic viscosity, in addition to the Froude number. Baines (Reference Baines1975) showed that the entrainment rate does not depend on the Reynolds number providing the flow is turbulent. However, Shy (Reference Shy1995) observed that the properties of the flows inside the impinged region change drastically when the Reynolds number is increased. For moderate Reynolds number (
 $10^{3}<Re<10^{4}$
), the density interface in the impinged region remains sharp, with a small mixed layer thickness, but above
 $Re\simeq 10^{4}$
, the thickness of the density gradient increases by a factor of
 $10$
: this is the so-called mixing transition. Shy (Reference Shy1995) interpreted this transition as a strong enhancement of baroclinic turbulence inside the dome. Cotel et al. (Reference Cotel, Gjestvang, Ramkhelawan and Breidenthal1997) verified the presence of this transition, but the authors confirmed the experiments of Baines (Reference Baines1975) by showing that
 $E_{i}$
remains independent of the Reynolds number for
 $Re\in [2200,12\,400]$
. The problem of how the phenomenology differs at the transition without modifying
 $E_{i}$
is still open.
Describing the turbulent flow as a superposition of vortices, models of erosion are commonly based on the mixing capacity of vortices, determined by their Froude number
 $Fr_{\unicode[STIX]{x1D706}}=u_{\unicode[STIX]{x1D706}}/\sqrt{\unicode[STIX]{x1D706}g^{\prime }}$
, with
 $\unicode[STIX]{x1D706}$
and
 $u_{\unicode[STIX]{x1D706}}$
the characteristic radius and velocity of the considered vortex (Linden Reference Linden1973; Shy Reference Shy1995; Cotel & Breidenthal Reference Cotel and Breidenthal1996; Cotel et al.
Reference Cotel, Gjestvang, Ramkhelawan and Breidenthal1997). Only the vortices with
 $Fr_{\unicode[STIX]{x1D706}}>1$
are expected to contribute significantly to the entrainment in the impinging region. The classical model of engulfment of Linden (Reference Linden1973) states that the eddies rebounding on the interface engulf the dense fluid before being advected by the mean flow outside the dome. Linden (Reference Linden1973) proposed a law
 $E_{i}\propto Fr_{i}^{3}$
based on scaling arguments and kinetic and potential energy balance.
From density measurements, Shy (Reference Shy1995) and Cotel et al. (Reference Cotel, Gjestvang, Ramkhelawan and Breidenthal1997) observed the presence of persistent vortices localized around the periphery of the dome. They deduced that the vortices are driven by baroclinic torque and are responsible for the entrainment across the interface. The baroclinic vortices are generated by the incident small-scale vortices advected by the turbulent jet. From these observations, Shrinivas & Hunt (Reference Shrinivas and Hunt2014) suggested a mechanism of entrainment based on a stationary circulation driven by like-sign vortices forced by baroclinic mechanisms. For the low-Froude-number regime, it leads to a scaling
 $E_{i}\propto Fr_{i}^{2}$
in unconfined geometries. In confined geometries, Shrinivas & Hunt (Reference Shrinivas and Hunt2015) suggested that the presence of large-scale oscillations of the interface leads to a correction
 $Fr_{i}^{3}$
, such that the entrainment rate becomes
 $E_{i}\sim Fr_{i}^{2}+KFr_{i}^{3}$
, with the constant
 $K$
vanishing in the unconfined limit. From this model, they explained how the confinement leads to the scatter of the data observed in their
 $(Fr_{i},E_{i})$
graphics; more precisely, the existence of two branches at low Froude number.
Shrinivas & Hunt (Reference Shrinivas and Hunt2014) offer a rationalization for the different entrainment laws, developing a theoretical model for the quasi-steady entrainment flux that centres on the presence of vortices driven by baroclinic forces. The presence of the mixing transition suggests that the strength of the baroclinic vortices inside the dome depends on the Reynolds number of the turbulent jet. Turbulence in jets with large Reynolds numbers (
 $Re>10^{4}$
) is expected to be developed and to display small-scale structures, whereas jets with moderate Reynolds numbers (
 $10^{3}<Re<10^{4}$
) remain dominated by large-scale structures (Dimotakis Reference Dimotakis2000). Shy (Reference Shy1995) suggested that the small-scale turbulence of the jet is more efficient at generating baroclinic vorticity than large-scale vortices because the Froude number
 $Fr_{\unicode[STIX]{x1D706}}$
increases when the size of the vortices decreases. Turbulent jets with high Reynolds number very likely contain vortices with
 $Fr_{\unicode[STIX]{x1D706}}>1$
, which may induce baroclinic force at the interface, while the presence of such eddies in jets with moderate Reynolds number is questionable. These points raise two questions: Can the vortices inside the jet drive baroclinic eddies for Reynolds numbers below the mixing transition? What is the mechanism of entrainment at moderate Reynolds numbers if the baroclinic vortices are absent? These questions will be addressed here.
In the present paper, we aim to determine the mechanism of entrainment of a non-buoyant jet impinging a sharp density interface via velocity and density measurements for Reynolds numbers below the mixing transition. Our experimental set-up is presented in §§ 2 and 3. Our study holds for moderate
 $Fr_{i}$
, i.e.
 $Fr_{i}$
close to but smaller than 1, corresponding to a relatively small deformation of the interface, and for moderate Reynolds numbers (
 $Re\simeq 2\times 10^{3}$
). Our measurements support a mechanism where the entrainment is driven by interfacial gravity waves as shown in § 4. Initially generated by incident vortices, the waves are amplified during their propagation outside the impinged region. This amplification leads to wave breaking associated with local mixing. We show that the steps leading to the breaking (wave generation and amplification) do not require baroclinic mechanisms since the energy transfer from the mean flow to the waves is well described by barotropic mechanisms. The large wave steepness, due to the increase of potential energy, triggers the wave breaking and the generation of baroclinic vorticity. Based on our measurements and on this mechanism, we introduce in § 5 a model describing the continuous change of the scaling law for turbulent entrainment from small to large Froude number.
2 Experimental set-up
2.1 Set-up and measurements
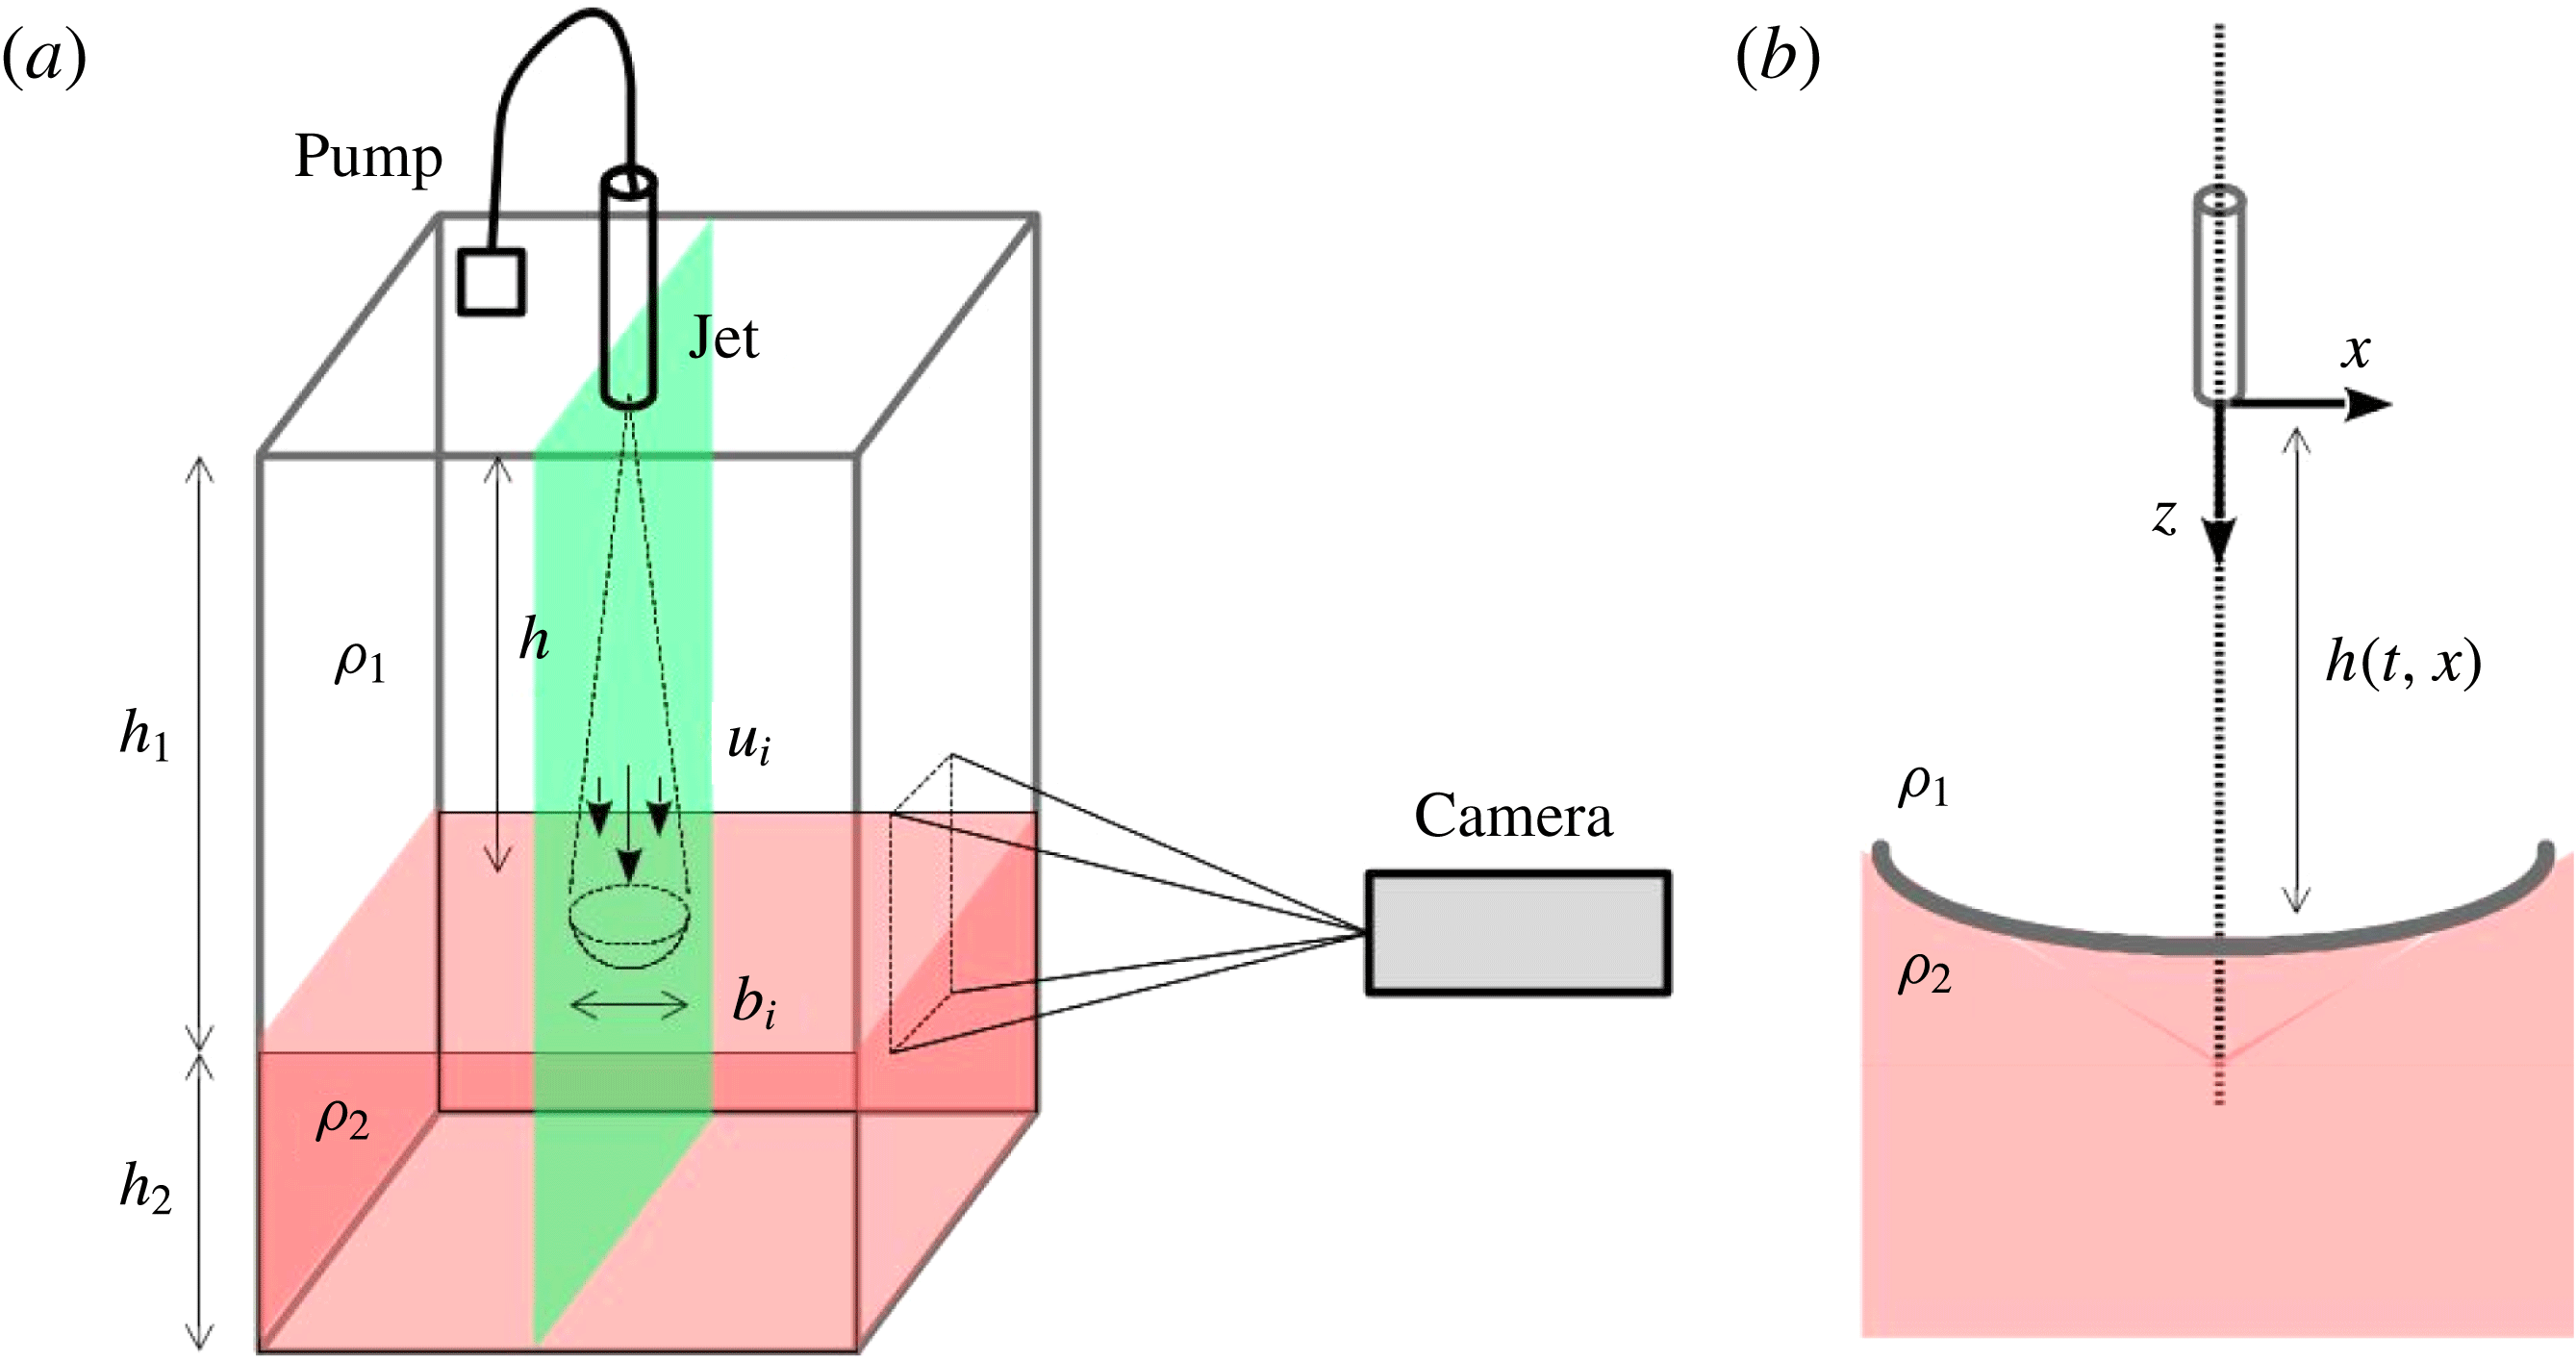
The set-up is sketched in figure 1(a). The tank is rectangular with a square section of width
 $L=30$
cm and height
 $H=50$
cm. The tank is filled with one layer of light fluid of density
 $\unicode[STIX]{x1D70C}_{1}$
and height
 $h_{1}=25$
cm, above a layer of denser fluid of density
 $\unicode[STIX]{x1D70C}_{2}$
and height
 $h_{2}=14$
cm (figure 1). The densities are controlled by a density meter DMA 35 from Anton Paar. The upper part of the tank is filled with water, plus some ethanol for the experiments indexed by M1, M2 and M3 in table 1. The lower part of the tank is filled with a saline solution of density
 $\unicode[STIX]{x1D70C}_{2}$
. The solution of ethanol in the light fluid enables optical index matching with the saline solution below. The viscosity of the mixture of water plus ethanol is a nonlinear function of the percentage of ethanol. The index matching is performed for a density jump
 $\unicode[STIX]{x0394}\unicode[STIX]{x1D70C}\simeq 0.03~\text{g}~\text{cm}^{-3}$
. The measurements are performed with an initial density
 $\unicode[STIX]{x1D70C}_{1}=0.987$
, which is associated with a kinematic viscosity of
 $\unicode[STIX]{x1D708}=1.2\times 10^{-6}~\text{m}^{2}~\text{s}^{-1}$
at 298 K (Khattab et al.
Reference Khattab, Bandarkar, Fakhree and Jouyban2012). The initial viscosity is 22 % larger than the viscosity of water, but the mixing will progressively decrease this difference during the run. All the fluids are freshly prepared for each run and filtered (
 $20~\unicode[STIX]{x03BC}\text{m}$
filter). The velocity of injection
 $U_{inj}$
at the round nozzle of radius
 $b_{0}=0.2$
cm is fixed for each experiment. The mean velocity of injection
 $U_{inj}$
can be increased up to
 $1.81~\text{m}~\text{s}^{-1}$
. The pump for the injection is located in one of the upper corners of the tank: the experiments are thus performed with a constant volume. Our measurements show that the pumping system does not significantly modify the symmetries and the properties of the mean velocity field.
(a) A schematic of the experimental set-up showing a rectangular tank filled with water (
 $h_{1}$
) and a saline solution (
 $h_{2}$
). The nozzle is located at a height
 $h$
from the interface. (b) We define the reference frame
 $(x,z)$
associated with the nozzle. The
 $z$
direction is descending.

Experimental parameters for the four experiments conducted.

Two different experimental investigations are performed: the first one for the description of the turbulent jet without density variation, and the second one for the investigation of the mixing mechanism. The runs are respectively indexed by ‘T’ and ‘M’ (table 1). The measurements start four minutes after the beginning of the erosion. We performed both velocity and density measurements using a digital camera (FASTCAM Mini, Photron) with a spatial resolution of
 $1024\times 1280$
pixels.
The velocity field is measured in the experiments T1, M1 and M3, using the particle image velocimetry (PIV) process (Meunier & Leweke Reference Meunier and Leweke2003). The flow is seeded with tracer particles (
 ${<}10~\unicode[STIX]{x03BC}\text{m}$
) and it is illuminated by a laser sheet crossing the vertical plane of the jet. The beam generated by a continuous-wave laser (
 $532$
nm) passes through a cylindrical Powell lens to create a laser sheet. The dimensions of the interrogation windows are
 $15~\text{cm}\times 20~\text{cm}$
; and
 $5000$
frames are acquired at a rate of 125 frames per second. The PIV algorithm is based on initial
 $64\times 64$
pixels and second
 $32\times 32$
pixels interrogation regions, and the resulting velocity field is a
 $64\times 72$
vector field. The convergence of the mean field is verified for an ensemble of frames larger than
 $4000$
snapshots. During the PIV measurements, the interface between the fluids is detected independently via a small amount of rhodamine in the dense fluid.
In the experiment M2, the density is measured by a planar laser-induced fluorescence technique (PLIF) with the same laser and camera set-up. The saline solution is mixed with rhodamine B. This rhodamine has an absorption spectrum between 460 and 590 nm and its emission spectrum is 550–680 nm, well separated from the laser light. A high-pass filter (TIFFEN, orange 21) is mounted on the camera with a cut-off frequency of 550 nm. The calibration has been performed with uniform density fields. The dye concentration has been adjusted to have a linear relation between dye concentration and intensity. From this calibration process, we have calculated the measured spatial intensity distribution, also called the flat field, which takes into account the bias of intensity due to the lighting inhomogeneity or to the camera response. The density of rhodamine is then calculated from the intensity field corrected by the flat field. Here, we are interested only in isodensity contours defining the interface. We define the interface height
 $h(x,t)$
as the curve of isodensity
 $\unicode[STIX]{x1D70C}=(\unicode[STIX]{x1D70C}_{1}+\unicode[STIX]{x1D70C}_{2})/2$
. The initial distance between the end of the nozzle and the interface is
 $h(x,t=0)=24$
cm (runs M, see table 1), i.e.
 $60$
times the diameter of the nozzle in order to obtain a developed turbulent jet (List Reference List1982). The net increase of the mean position of the interface
 $\unicode[STIX]{x0394}h$
, from the beginning to the end of the measurement, is reported in table 1. The distance between the nozzle and the interface can be considered as constant with
 $\unicode[STIX]{x0394}h/h<2\,\%$
.
To describe the flow, we use the frame in the plane of symmetry of the jet (figure 1
b) with Cartesian coordinate system
 $(x,z)$
. The
 $x$
-axis is aligned with the radial direction and the
 $z$
-axis corresponds to the axis of symmetry of the jet. The origin is located at the nozzle outlet. Owing to the local axisymmetry of the configuration (we neglect the boundary effects due to the rectangular tank), we assume that the average quantity of the azimuthal component of the velocity fields, here in the
 $y$
direction, and the derivative of the average quantities with respect to
 $y$
, are equal to zero. The measurements performed in the vicinity of the impinged region are expressed as a function of the radial distance
 $x$
and the distance from the interface
 $h_{0}-z$
, where
 $h_{0}=\langle h(x=0)\rangle$
is the average distance from the nozzle to the interface along the axis of the jet.
2.2 Interfacial dimensionless parameters
In table 1, we report the Reynolds numbers associated with the jet for each run:
 $Re=U_{inj}b_{0}/\unicode[STIX]{x1D708}$
. The Reynolds number is expected to be constant in the far field of the jet (List Reference List1982). The Reynolds numbers are between
 $2\times 10^{3}$
and
 $2.3\times 10^{3}$
, which implies that our experiments are below the mixing transition (Shy Reference Shy1995), where the mixing layer thickness is small. We investigate the properties of the solely turbulent jet configuration in the next section.
Dimensional analysis implies that our system is characterized by the injection Froude number
 $Fr_{inj}$
defined by
 $Fr_{inj}=U_{inj}/\sqrt{b_{0}g^{\prime }}$
. However, this definition does not seem to us to be relevant for the interfacial dynamics and mixing, since it is based on the parameters
 $U_{inj}$
and
 $b_{0}$
characterizing the outlet properties of the jet. We thus want to estimate the relevant Froude number at the interface
 $Fr_{i}$
. In order to interpolate the typical length
 $b_{i}$
and velocity
 $u_{i}$
at the interface, we use the laws of evolution of the width of the jet
 $b$
and of the axial velocity component
 $u_{m}$
at a distance
 $z$
from the nozzle (Fischer et al.
Reference Fischer, List, Koh, Imberger and Brooks1979), taken along the jet axis at
 $x=0$
:
 $$\begin{eqnarray}b(z)=\frac{\text{d}b}{\text{d}z}(z-h_{s})\quad \text{and}\quad u_{m}(z)=U_{inj}\unicode[STIX]{x1D6EC}\frac{2b_{0}}{(z-h_{s})},\end{eqnarray}$$
with
 $(\text{d}b/\text{d}z)$
the spreading rate,
 $\unicode[STIX]{x1D6EC}$
the velocity decay constant and
 $h_{s}$
the virtual origin of the jet. We use the top-hat definition for the typical length
 $b_{i}$
and velocity
 $u_{i}$
. The top-hat definition for a Gaussian profile enables us to define
 $u_{i}=u_{m}(h)/2$
and
 $b_{i}=b(h)$
, with
 $h$
the position of the interface. A recent numerical experiment (Ezhova, Cenedese & Brandt Reference Ezhova, Cenedese and Brandt2016) supports the use of (2.1b
) even in the presence of a density interface. It is shown that the axial velocity component
 $u_{m}$
is modified only in the near field of the interface, while it follows the classical scaling (2.1b
) in the bulk flow. The Froude number at the interface can then be written as a function of the position of the interface
 $h$
:
 $$\begin{eqnarray}Fr_{i}=\frac{u_{i}}{\sqrt{b_{i}g^{\prime }}}=\frac{U_{inj}}{\sqrt{b_{0}g^{\prime }}}\frac{\unicode[STIX]{x1D6EC}}{(\text{d}b/\text{d}z)^{1/2}}\left(\frac{b_{0}}{h-h_{s}}\right)^{3/2}.\end{eqnarray}$$
The initial values of this Froude number are reported in table 1. One can note that
 $Fr_{i}$
changes as a function of time during the course of an experiment: indeed,
 $Fr_{i}$
decreases like
 $Fr_{i}\sim h^{-3/2}$
, and, because of mixing,
 $g^{\prime }$
also decreases. However, our study is performed shortly after the onset: the relative increase of the interface position is less than
 $2\,\%$
(table 1), and it is reasonable to consider that
 $g^{\prime }$
has not varied significantly. We estimate the relative evolution of the Froude number to be less than
 $\unicode[STIX]{x0394}Fr_{i}/Fr_{i}<3\,\%$
.
3 Kinematics of the jet
3.1 Jet without stratification
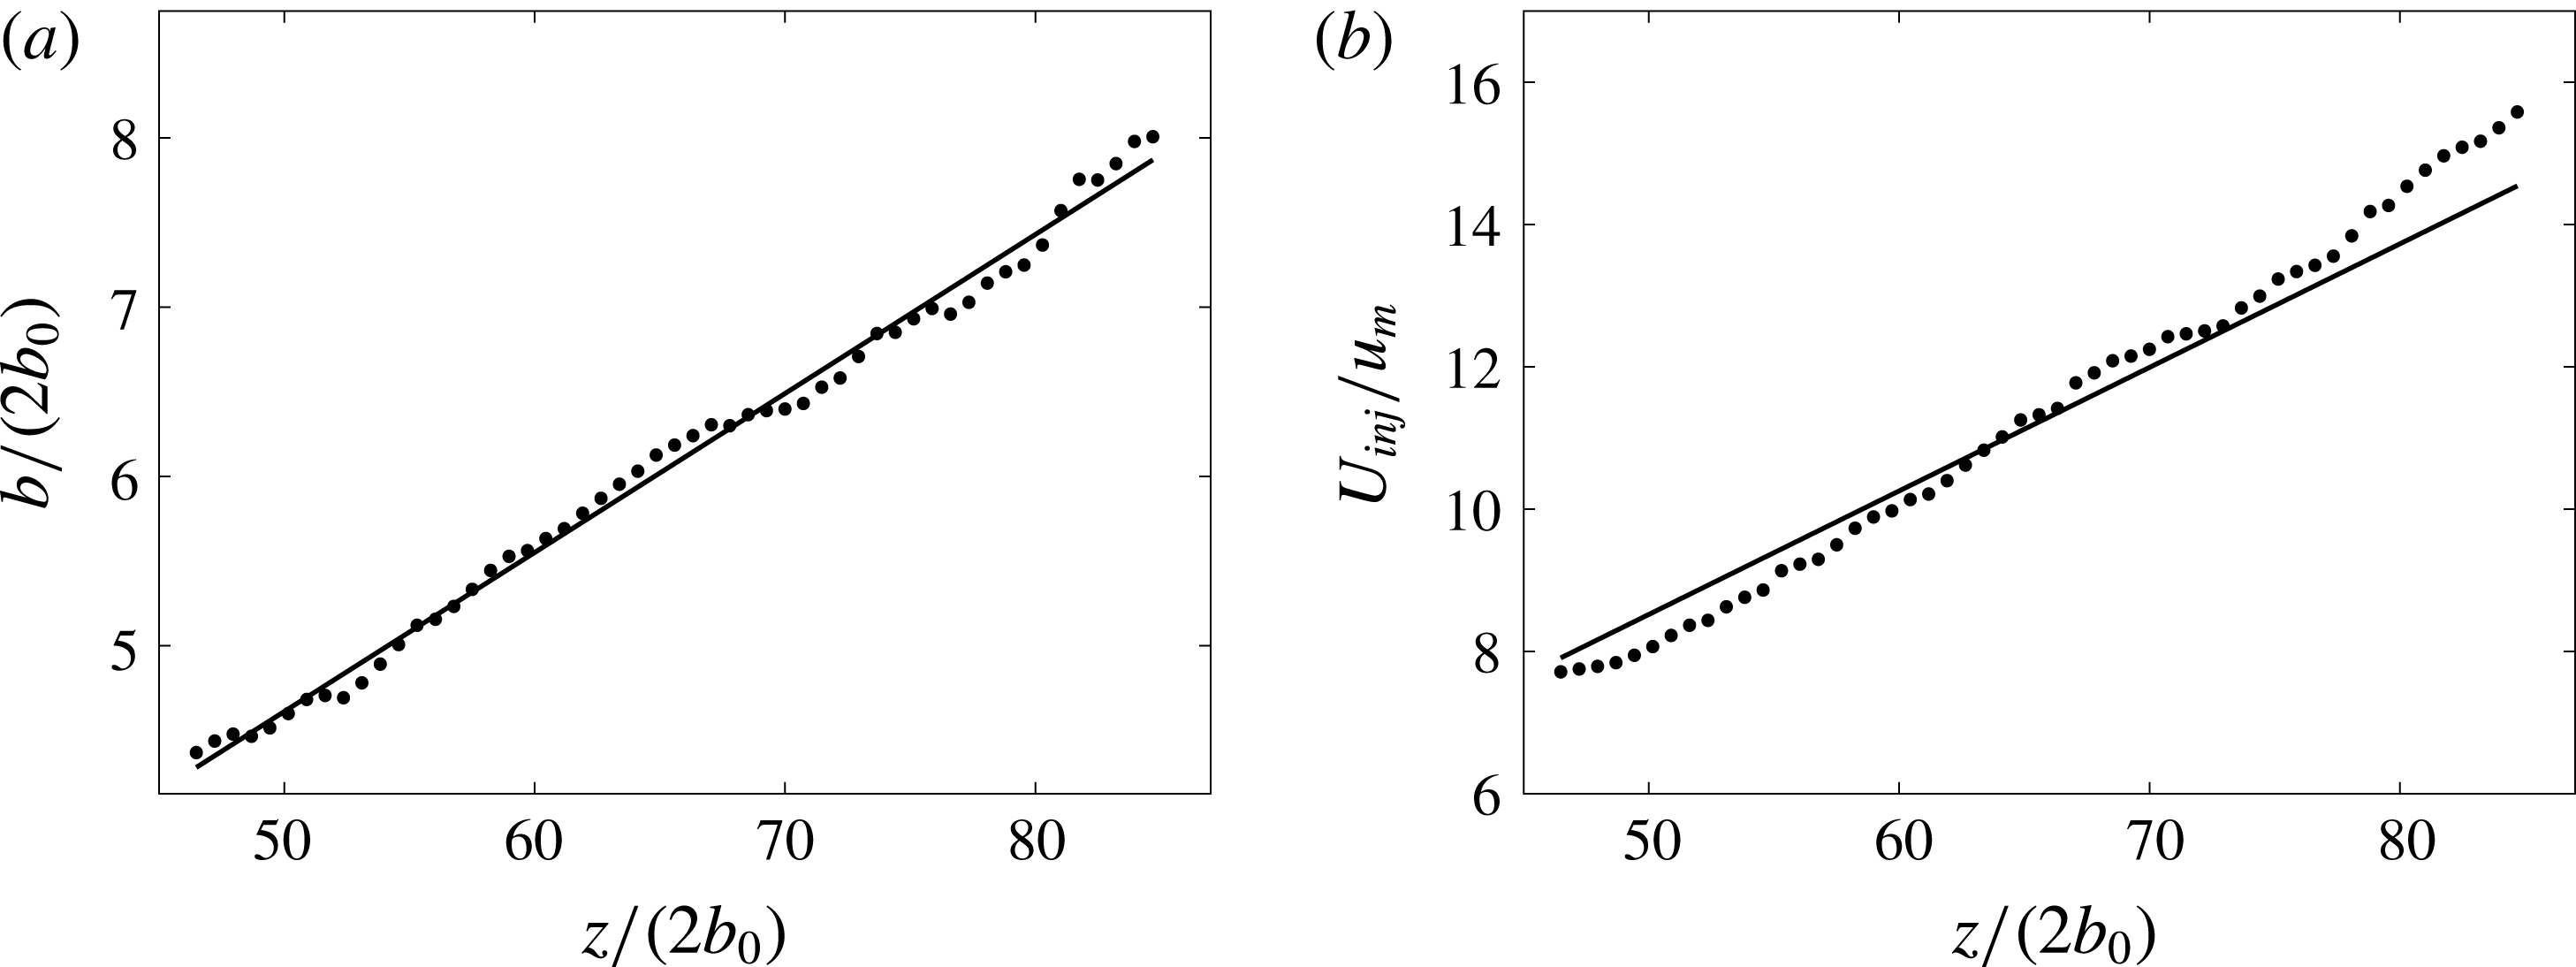
(a) Radius
 $b$
of the jet and (b) inverse of the axial velocity
 $u_{m}$
as a function of the distance from the nozzle
 $z$
. Lengths and velocities are rescaled by the diameter of the nozzle
 $2b_{0}$
and by the injection velocity
 $U_{inj}$
, respectively.

Table of parameters of the turbulent jet compared to the measurements of Hussein, Capp & George (Reference Hussein, Capp and George1994).

We first study the jet in the absence of stratification for a Reynolds number
 $Re=2.3\times 10^{3}$
(T1 in table 1) in order to validate the use of (2.1a,b
). The measurements are performed for
 $z$
between
 $80b_{0}$
and
 $170b_{0}$
. The local radius of the jet
 $b$
divided by the diameter
 $2b_{0}$
is reported as a function of
 $z/(2b_{0})$
in figure 2(a). The radius
 $b$
corresponds to the ordinate
 $x$
where the average vertical velocity corresponds to half of the axial velocity, i.e.
 $\langle u_{z}\rangle (x,z)=u_{m}(z)/2$
, for a given
 $z$
. The radius increases linearly and the fitted parameters
 $(\text{d}b/\text{d}z,h_{s})$
(equation (2.1a,b
)) are reported in table 2. The ratio
 $U_{inj}/u_{m}(z)$
(figure 2
b) increases also linearly and the corresponding parameter
 $\unicode[STIX]{x1D6EC}$
is reported in table 2. The coefficient
 $\unicode[STIX]{x1D6EC}$
is fitted by taking
 $u_{m}(z)$
as a function of
 $z-h_{s}$
, with
 $h_{s}$
obtained from the data of figure 2(a). The measured coefficients
 $(h_{s},\text{d}b/\text{d}z,\unicode[STIX]{x1D6EC})$
are compared to the results of Hussein et al. (Reference Hussein, Capp and George1994) for
 $Re=47.7\times 10^{3}$
, based on the radius of the nozzle. Our measurements are in good agreement, regarding
 $\text{d}b/\text{d}z$
and
 $\unicode[STIX]{x1D6EC}$
, which are related to the physics of the mixing by the turbulent jet: this validates the use of the Taylor entrainment constant. The virtual origin is different, but this parameter may be affected by the confinement effect or the turbulence intensity in the nozzle.
3.2 Jet with stratification
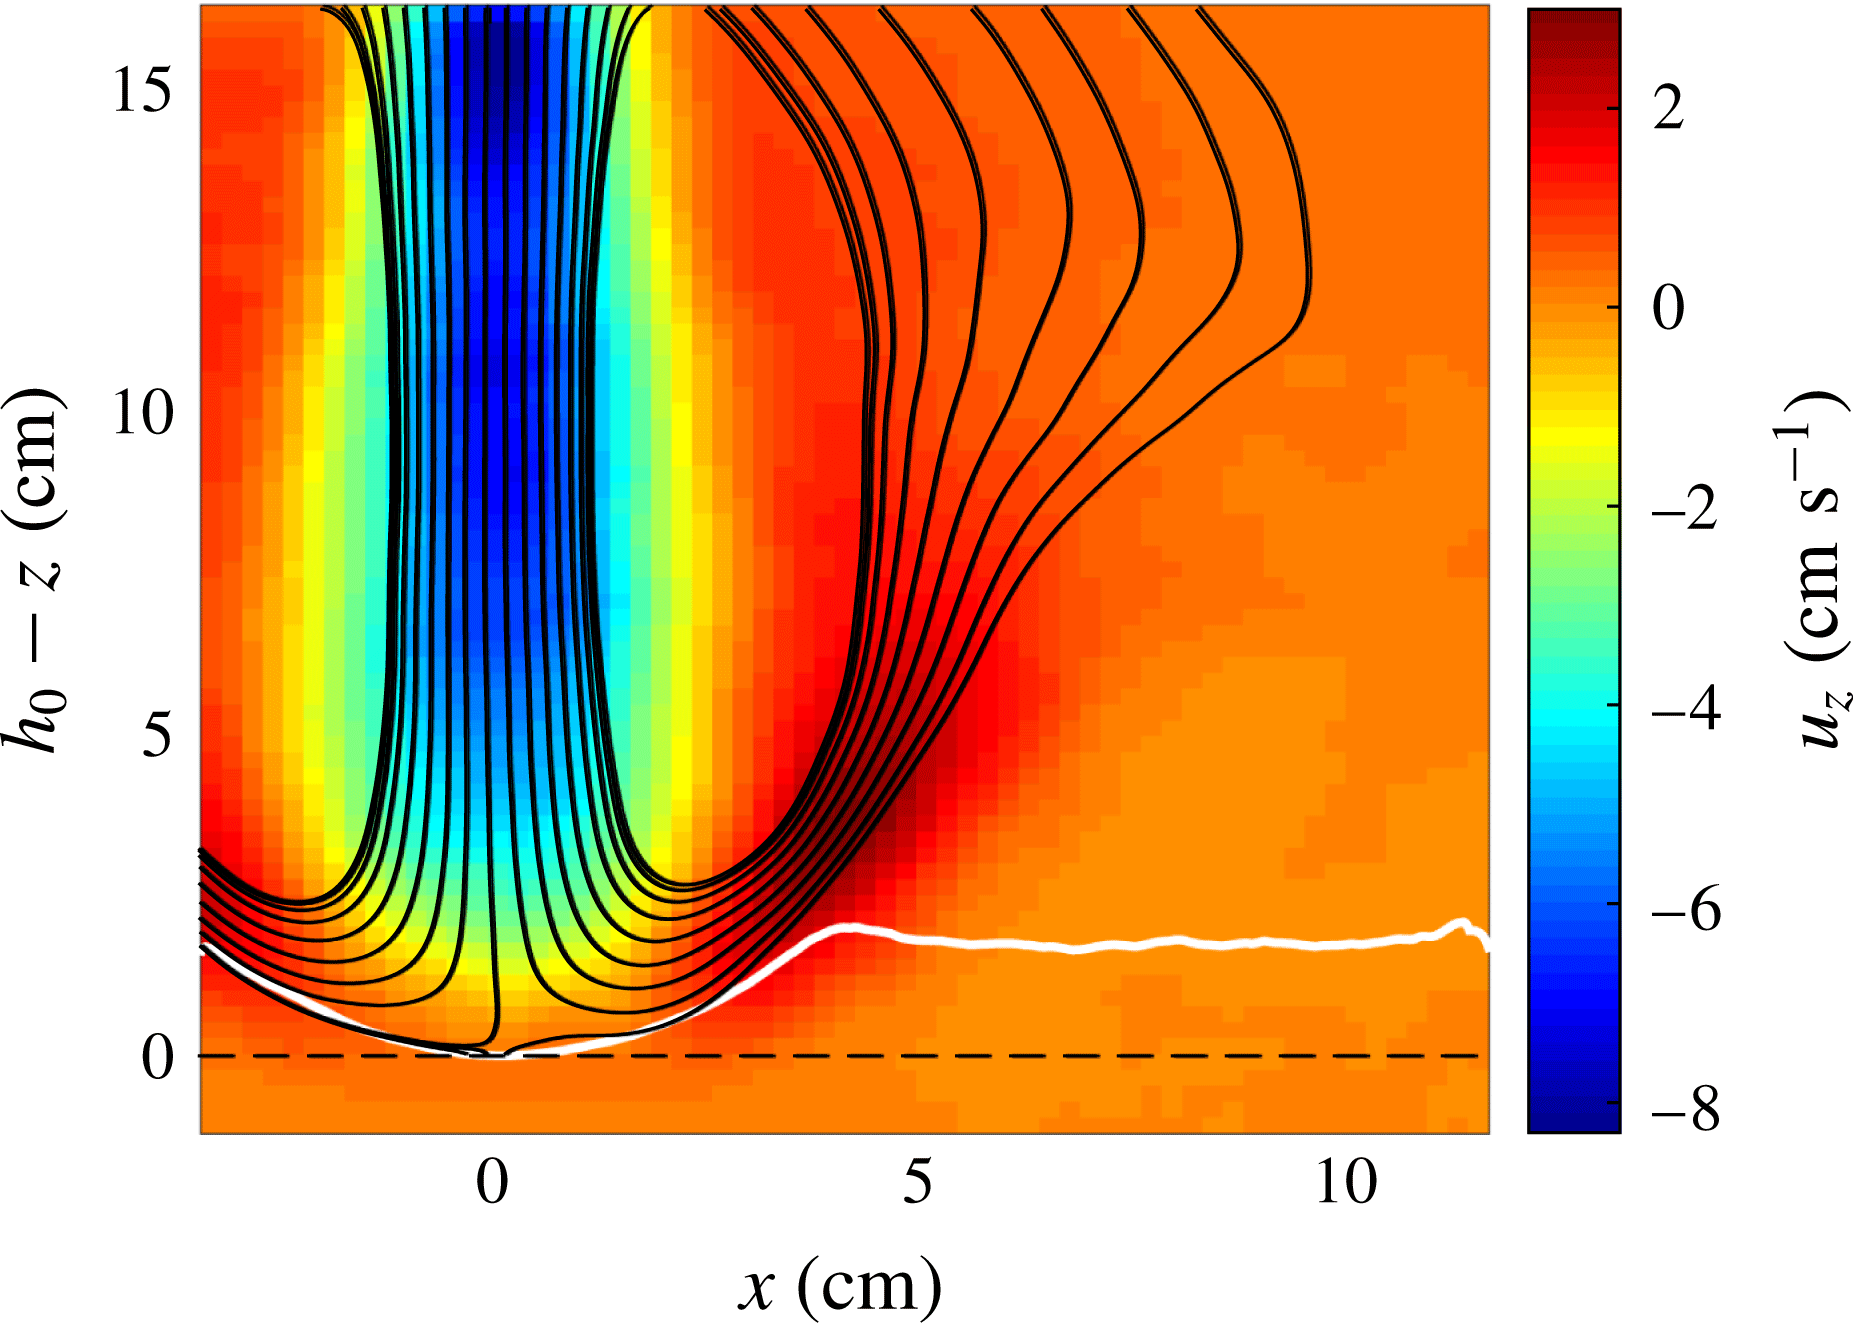
We now focus on the velocity field of a jet impinging onto a sharp density interface. The results presented here correspond to the run M1 (table 1). The vertical component
 $\langle u_{z}\rangle$
of the time-averaged velocity field and its streamlines are reported in figure 3. The operator
 $\langle \cdot \rangle$
corresponds to the time-averaged quantities calculated over a duration
 $T_{e}=40$
s corresponding approximately to
 $100$
advection time scales
 $b_{i}/u_{i}$
. The white curve represents the time-averaged location of the interface determined by the presence of fluorescent rhodamine. The vertical axis at
 $x=0$
corresponds to the jet axis and the height
 $h_{0}-z=0$
is associated with the bottom of the time-averaged interface (black dashed line). We recall that
 $h_{0}$
is the average distance between the nozzle and the interface at
 $x=0$
.
We have reported in table 1 the depth
 $\unicode[STIX]{x1D709}$
and the radius
 $b_{d}$
of the time-averaged dome generated by the impact of the jet onto the stratified interface for M1, M2 and M3. The radius
 $b_{d}$
is the radial distance between the centre of the dome (almost parabolic) and the end of the dome, where the interface becomes flat. The depth
 $\unicode[STIX]{x1D709}$
corresponds to the difference of altitude between these two extremities. For M1, the dome is characterized by a radius
 $b_{d}=4$
cm and a depth
 $\unicode[STIX]{x1D709}=2$
cm. The abscissa
 $x$
and the height
 $z$
will be rescaled respectively by
 $b_{d}$
and
 $\unicode[STIX]{x1D709}$
in the rest of the paper. The radius of the jet at the interface
 $b_{i}$
, equal to
 $2.2$
cm, corresponds approximately to the width of the jet entering in the dome and it is approximately two times smaller than the radius of the dome.
Streamlines (black curves) of the mean flow, superimposed on the vertical component of the mean velocity field
 $\langle u_{z}\rangle$
(
 $\text{cm}~\text{s}^{-1}$
) (colour bar). The white curve corresponds to the time-averaged location of the interface separating the two fluids. The black dotted line corresponds to the ordinate
 $h_{0}-z=0$
.

A remarkable property of the flow inside the dome is the convergence of the streamlines when they leave the dome close to the interface. This contraction corresponds to a local acceleration of the flow. To study the flow field inside the dome, we introduce the velocity component
 $U_{t}$
, which is tangential to the mean interface given by the function
 $\langle h\rangle (x)$
. For each abscissa
 $x$
, we calculate the angle of inclination of the interface given by
 $\unicode[STIX]{x1D703}(x)=\arctan (\text{d}\langle h\rangle /\text{d}x)$
and we define the velocity by
 $U_{t}(x,z)=\sin (\unicode[STIX]{x1D703})\langle u_{z}\rangle +\cos (\unicode[STIX]{x1D703})\langle u_{x}\rangle$
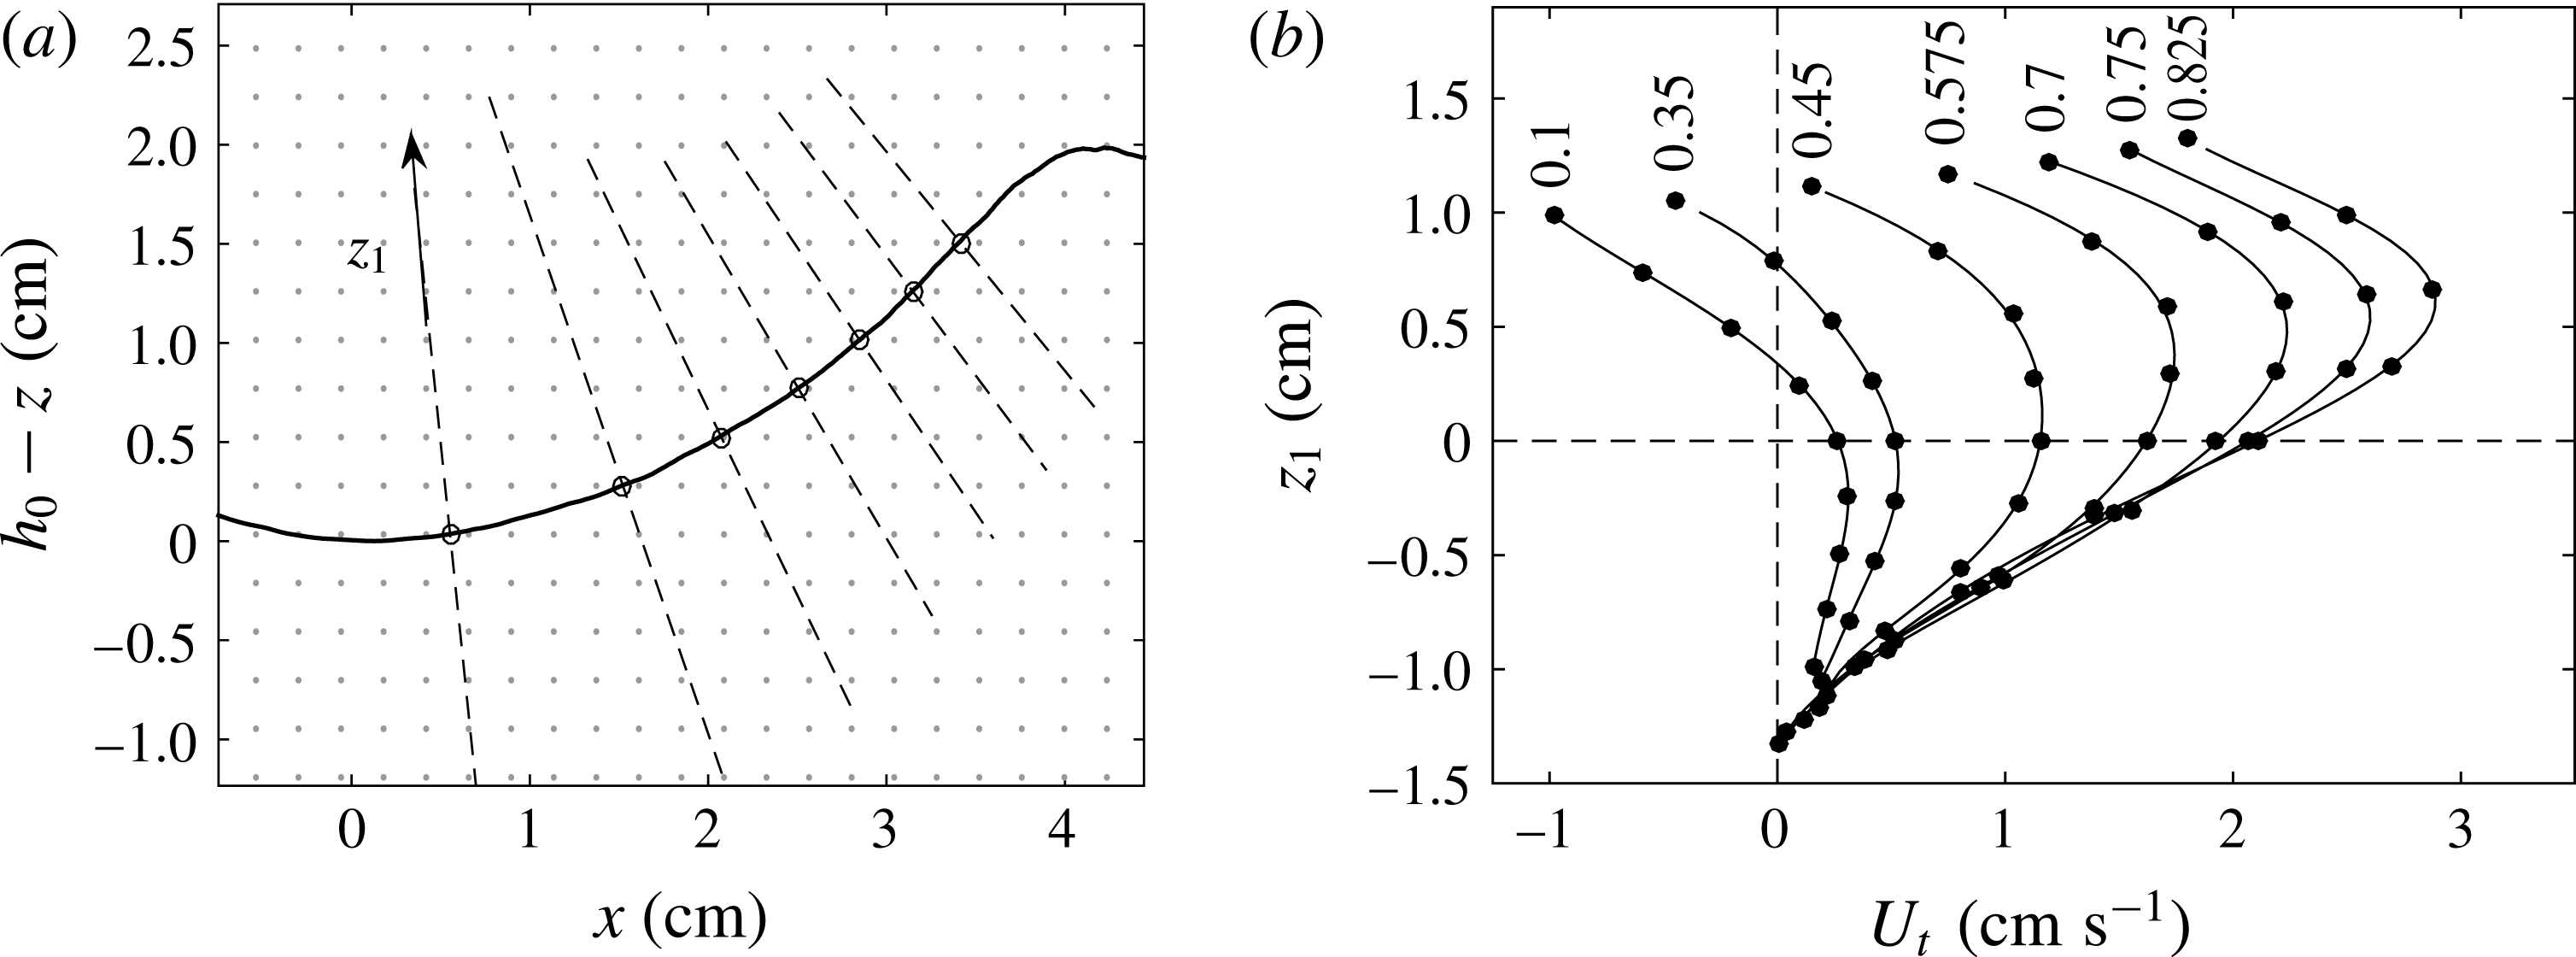
. The profiles of
 $U_{t}$
are reported in figure 4(b) for different abscissae shown in figure 4(a) (from left to right) starting at
 $x=0.4$
cm (
 $0.1b_{d}$
) and finishing at 3.3 cm (
 $0.825b_{d}$
). They are plotted as a function of the ordinate
 $z_{1}$
following the normal to the interface (dashed lines in figure 4
a) with the interface at
 $z_{1}=0$
. The curves correspond to the polynomial interpolation of the profiles. The profiles confirm that the flow accelerates along the interface.
(a) Location of the points (circles) on the interface with the normal lines (dashed lines) showing where the tangential velocity
 $U_{t}$
is calculated. (b) The profiles of
 $U_{t}$
are calculated at the abscissa
 $x=0.1,0.35,0.475,0.575,0.7,0.775,0.825$
times the radius of the dome
 $b_{d}$
, as shown on (a). The variable
 $z_{1}$
is the distance from the interface following the dashed lines in (a).

A balance between potential energy and kinetic energy explains the acceleration characterized by
 $\unicode[STIX]{x2202}_{x}U_{t}>0$
. When the jet impacts the interface, the kinetic energy is converted partially into potential energy and when the flow leaves the dome, a part of the potential energy is reconverted into kinetic energy. Outside the dome, the streamlines are directed upwards and reconnect the jet flow, drawing a large recirculation cell. This recirculation is the combination of the ballistic reflection of the jet and the lateral entrainment of the jet.
4 Investigation of the mechanism of erosion
4.1 General description
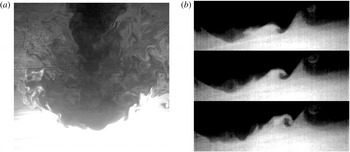
We first draw a global picture of the mechanism of erosion before demonstrating each element in the following paragraphs. When the jet impinges onto the dense fluid, the interface is convoluted by the turbulent fluctuations of the jet. These perturbations are generated by the eddies coming from the jet. These vortices excite interfacial gravity waves, which propagate outwards from the impinged region. These waves are identifiable in figure 5(a,b). During the propagation, the height of the waves increases until they break down close to the border of the dome. This process is illustrated on the three successive pictures of the interface of figure 5(b), with waves propagating from left to right. The amplification of the waves is caused by an energy transfer from the mean flow via a mechanism that could be similar to the one described by Miles (Reference Miles1960) in shear flows. The breaking of the waves induces a strong mixing due to the wrapping of filaments. The heavy fluid is then transported in the bulk flow where the turbulence of the jet mixes both fluids (figure 5 a). We claim that the transport and the mixing of the dense fluid by these waves is the main source of erosion at moderate Froude and Reynolds numbers.
Mixing process in the vicinity (a) of the interface (
 $15~\text{cm}\times 20~\text{cm}$
) and (b) of the dome head (
 $15~\text{cm}\times 8~\text{cm}$
). The dense fluid has been dyed by rhodamine and corresponds to the bright region. See online supplementary material (movie 1 available at https://doi.org/10.1017/jfm.2017.891) for the movie corresponding to the panel (a).

The following sections detail successively the former points. The physical properties of the waves (§ 4.2) and the features of the breaking (§ 4.5) are determined from the measurements of the density field, the run indexed by M2. The excitation (§ 4.3) and the amplification (§ 4.4) of the waves are mostly characterized by the velocity measurements indexed by M1 and M3. The three runs display the same features, like the signature of the period of the wave in the measurements of density (M2, figure 8) and of velocity (figure 11 a).
4.2 Wave properties
In this section, we characterize the properties of the perturbations near the interface. We observe that the interface remains sharp in the impinged region, as expected for
 $Re<10^{4}$
(Shy Reference Shy1995) with a small diffusion layer
 $\unicode[STIX]{x1D6FF}_{H}$
. The height of
 $\unicode[STIX]{x1D6FF}_{H}$
corresponds to a few per cent of the dome depth, i.e. a few millimetres. The stratification in this layer could support internal gravity waves with typical frequency
 $N=\sqrt{g^{\prime }/\unicode[STIX]{x1D6FF}_{H}}$
, with
 $\unicode[STIX]{x0394}\unicode[STIX]{x1D70C}/\unicode[STIX]{x1D6FF}_{H}$
the associated density gradient. The frequency of internal gravity waves would be
 $N\simeq 8$
Hz for
 $\unicode[STIX]{x1D6FF}_{H}\simeq 4$
mm. As we will see further, the typical frequency of the waves propagating inside the dome varies in the range
 $0.3{-}0.4$
Hz, a frequency range corresponding to interfacial gravity waves. Hence, the dynamics of the perturbation inside the dome is controlled by interfacial gravity waves rather than internal gravity waves.
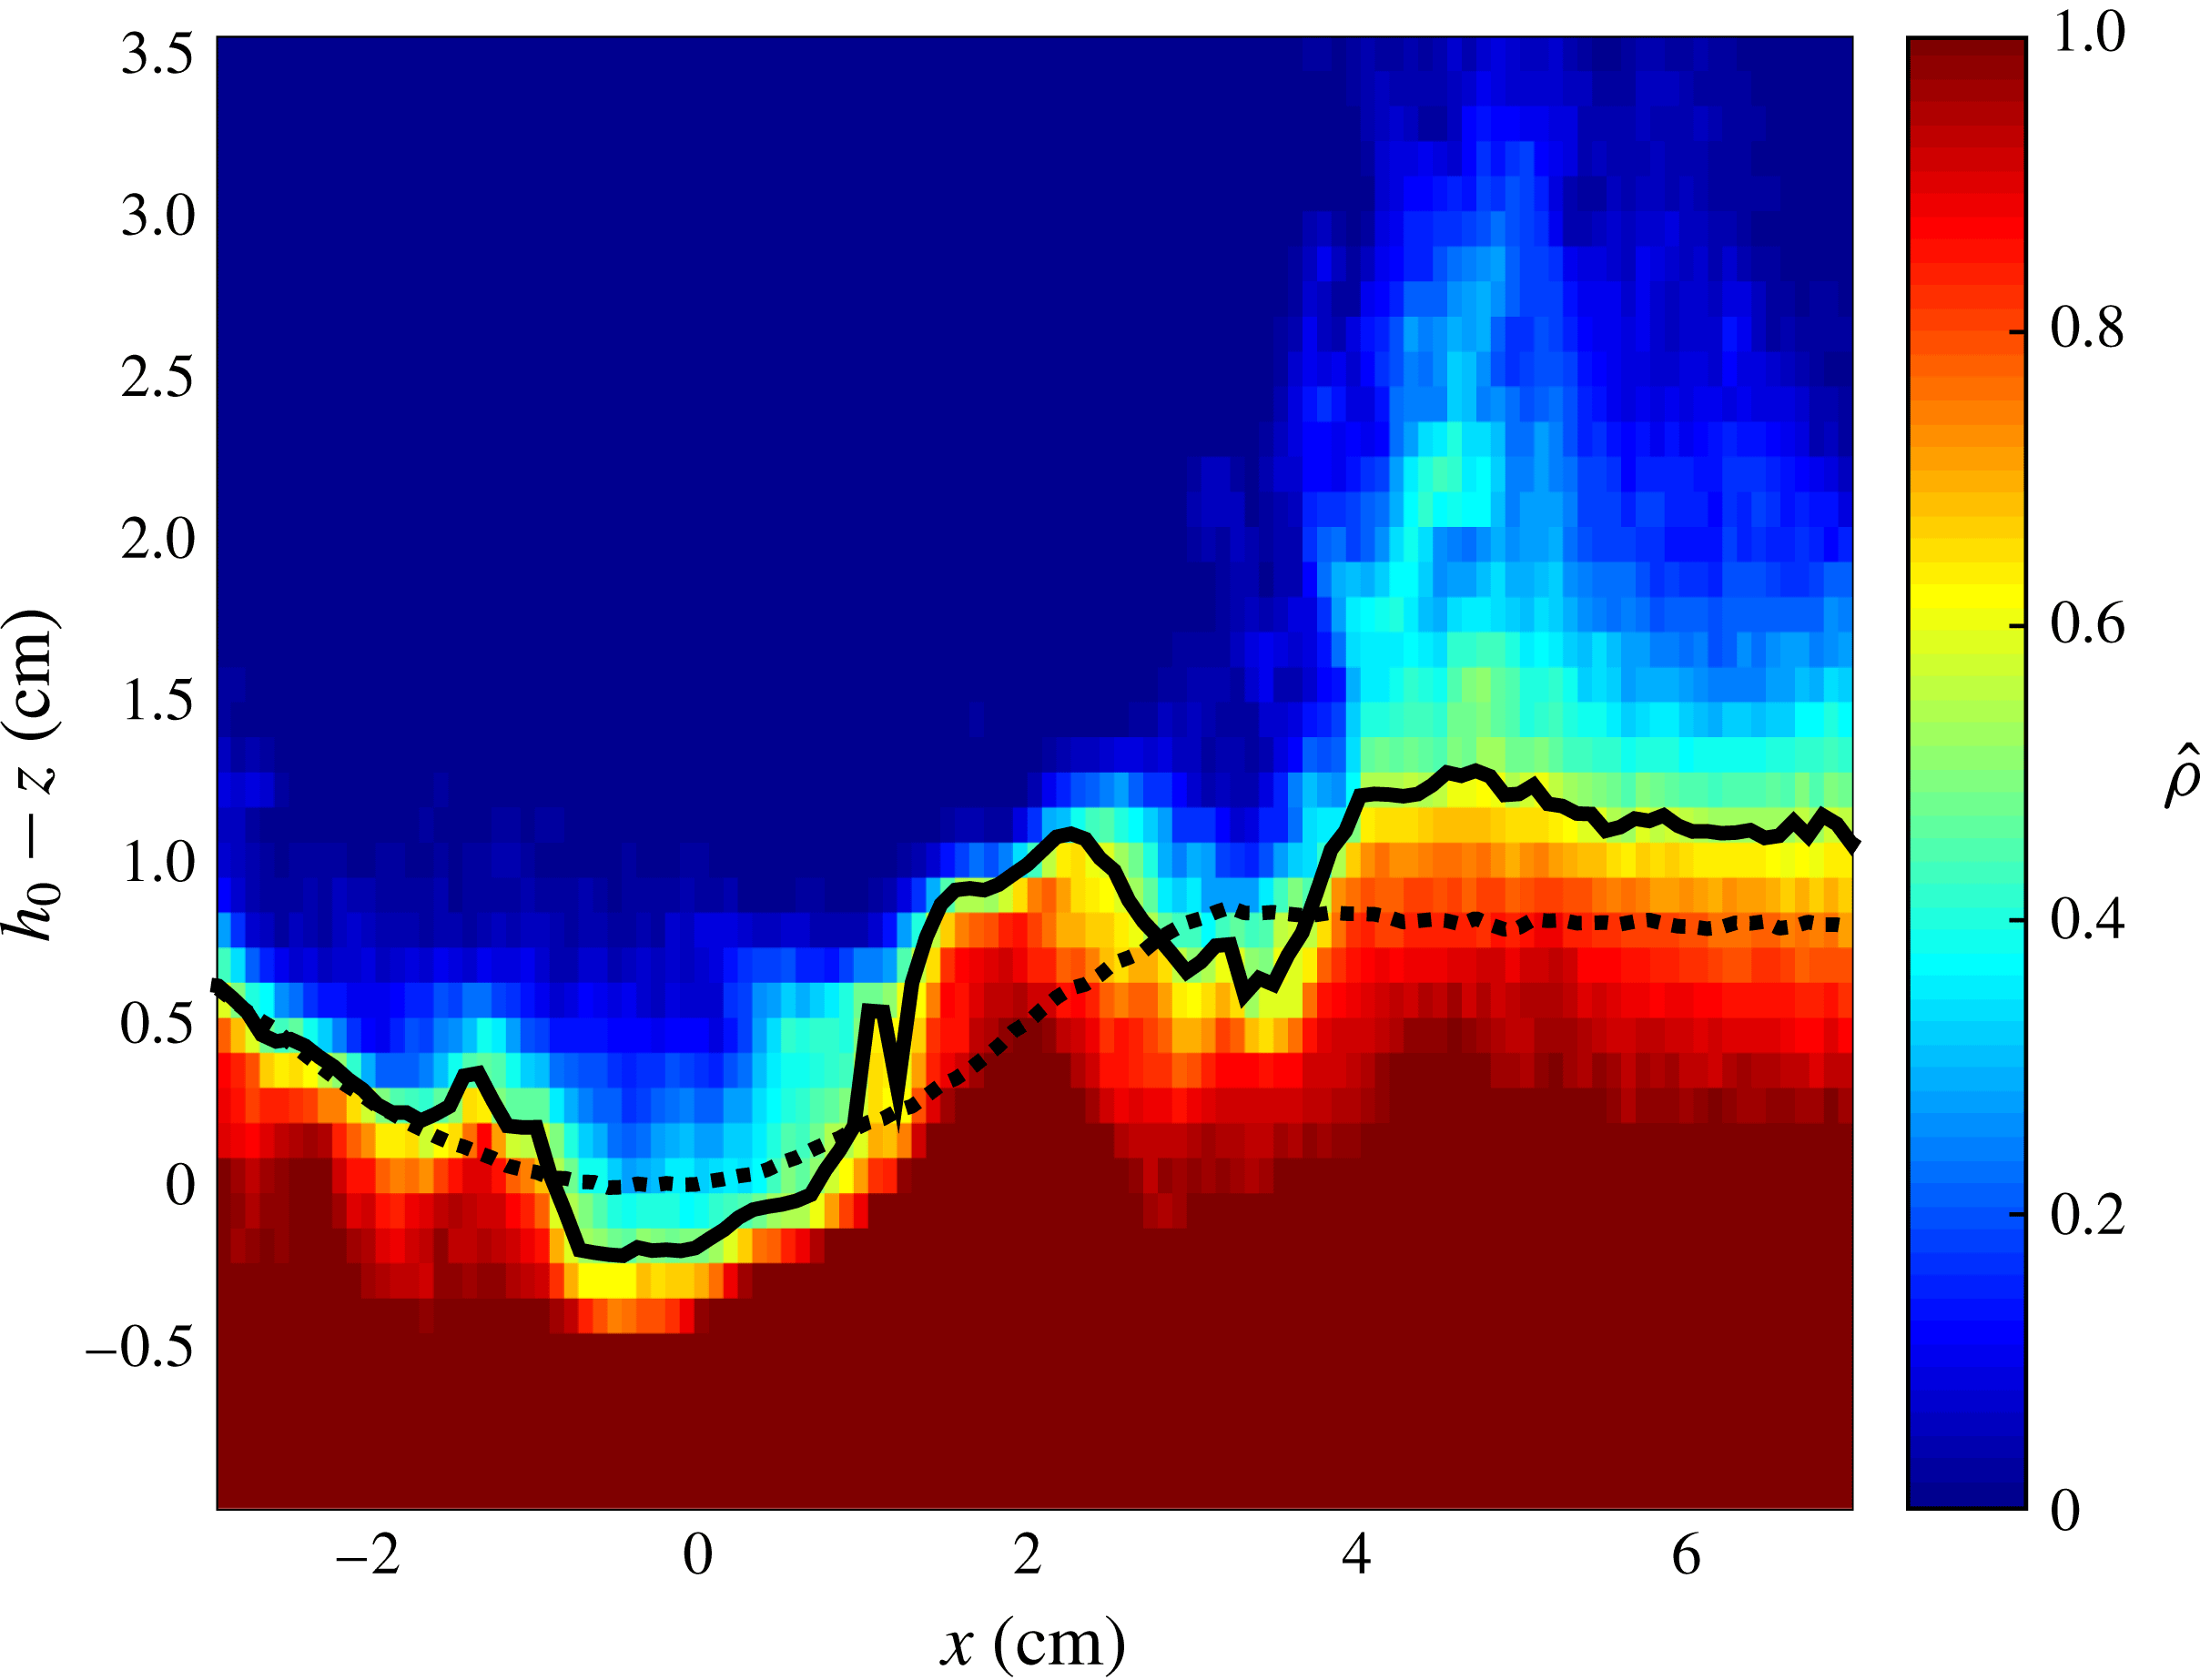
The spatio-temporal properties of the waves are studied by using the information contained in the dynamics of the interface. The perturbation of the interface is illustrated by an instantaneous relative density field from the measurement M2 (figure 6). The relative density is defined by
 $\hat{\unicode[STIX]{x1D70C}}=(\unicode[STIX]{x1D70C}-\unicode[STIX]{x1D70C}_{1})/(\unicode[STIX]{x1D70C}_{2}-\unicode[STIX]{x1D70C}_{1})$
varying between
 $0$
and
 $1$
, with
 $\unicode[STIX]{x1D70C}$
the effective density given by the PLIF measurements. The interface position defined by
 $h(x,t)$
(black curve) corresponds to the isodensity line
 $\hat{\unicode[STIX]{x1D70C}}=0.5$
. The time-averaged height
 $\langle h\rangle (x)$
is represented by the black dotted curve following a quadratic law
 $\langle h\rangle \sim x^{2}$
.
Rescaled density field
 $\hat{\unicode[STIX]{x1D70C}}$
(colour level) from
 $\hat{\unicode[STIX]{x1D70C}}=0$
for
 $\unicode[STIX]{x1D70C}=\unicode[STIX]{x1D70C}_{1}$
(fresh water) to
 $\hat{\unicode[STIX]{x1D70C}}=1$
for
 $\unicode[STIX]{x1D70C}=\unicode[STIX]{x1D70C}_{2}$
(initial salt water). The full black curve corresponds to the height
 $h(x,t)$
where
 $\hat{\unicode[STIX]{x1D70C}}=0.5$
. The dashed curve represents the time-averaged height
 $\langle h\rangle$
.

From the height
 $h(x,t)$
, we introduce the height perturbation
 $\unicode[STIX]{x1D702}(x,t)=h(x,t)-\langle h\rangle$
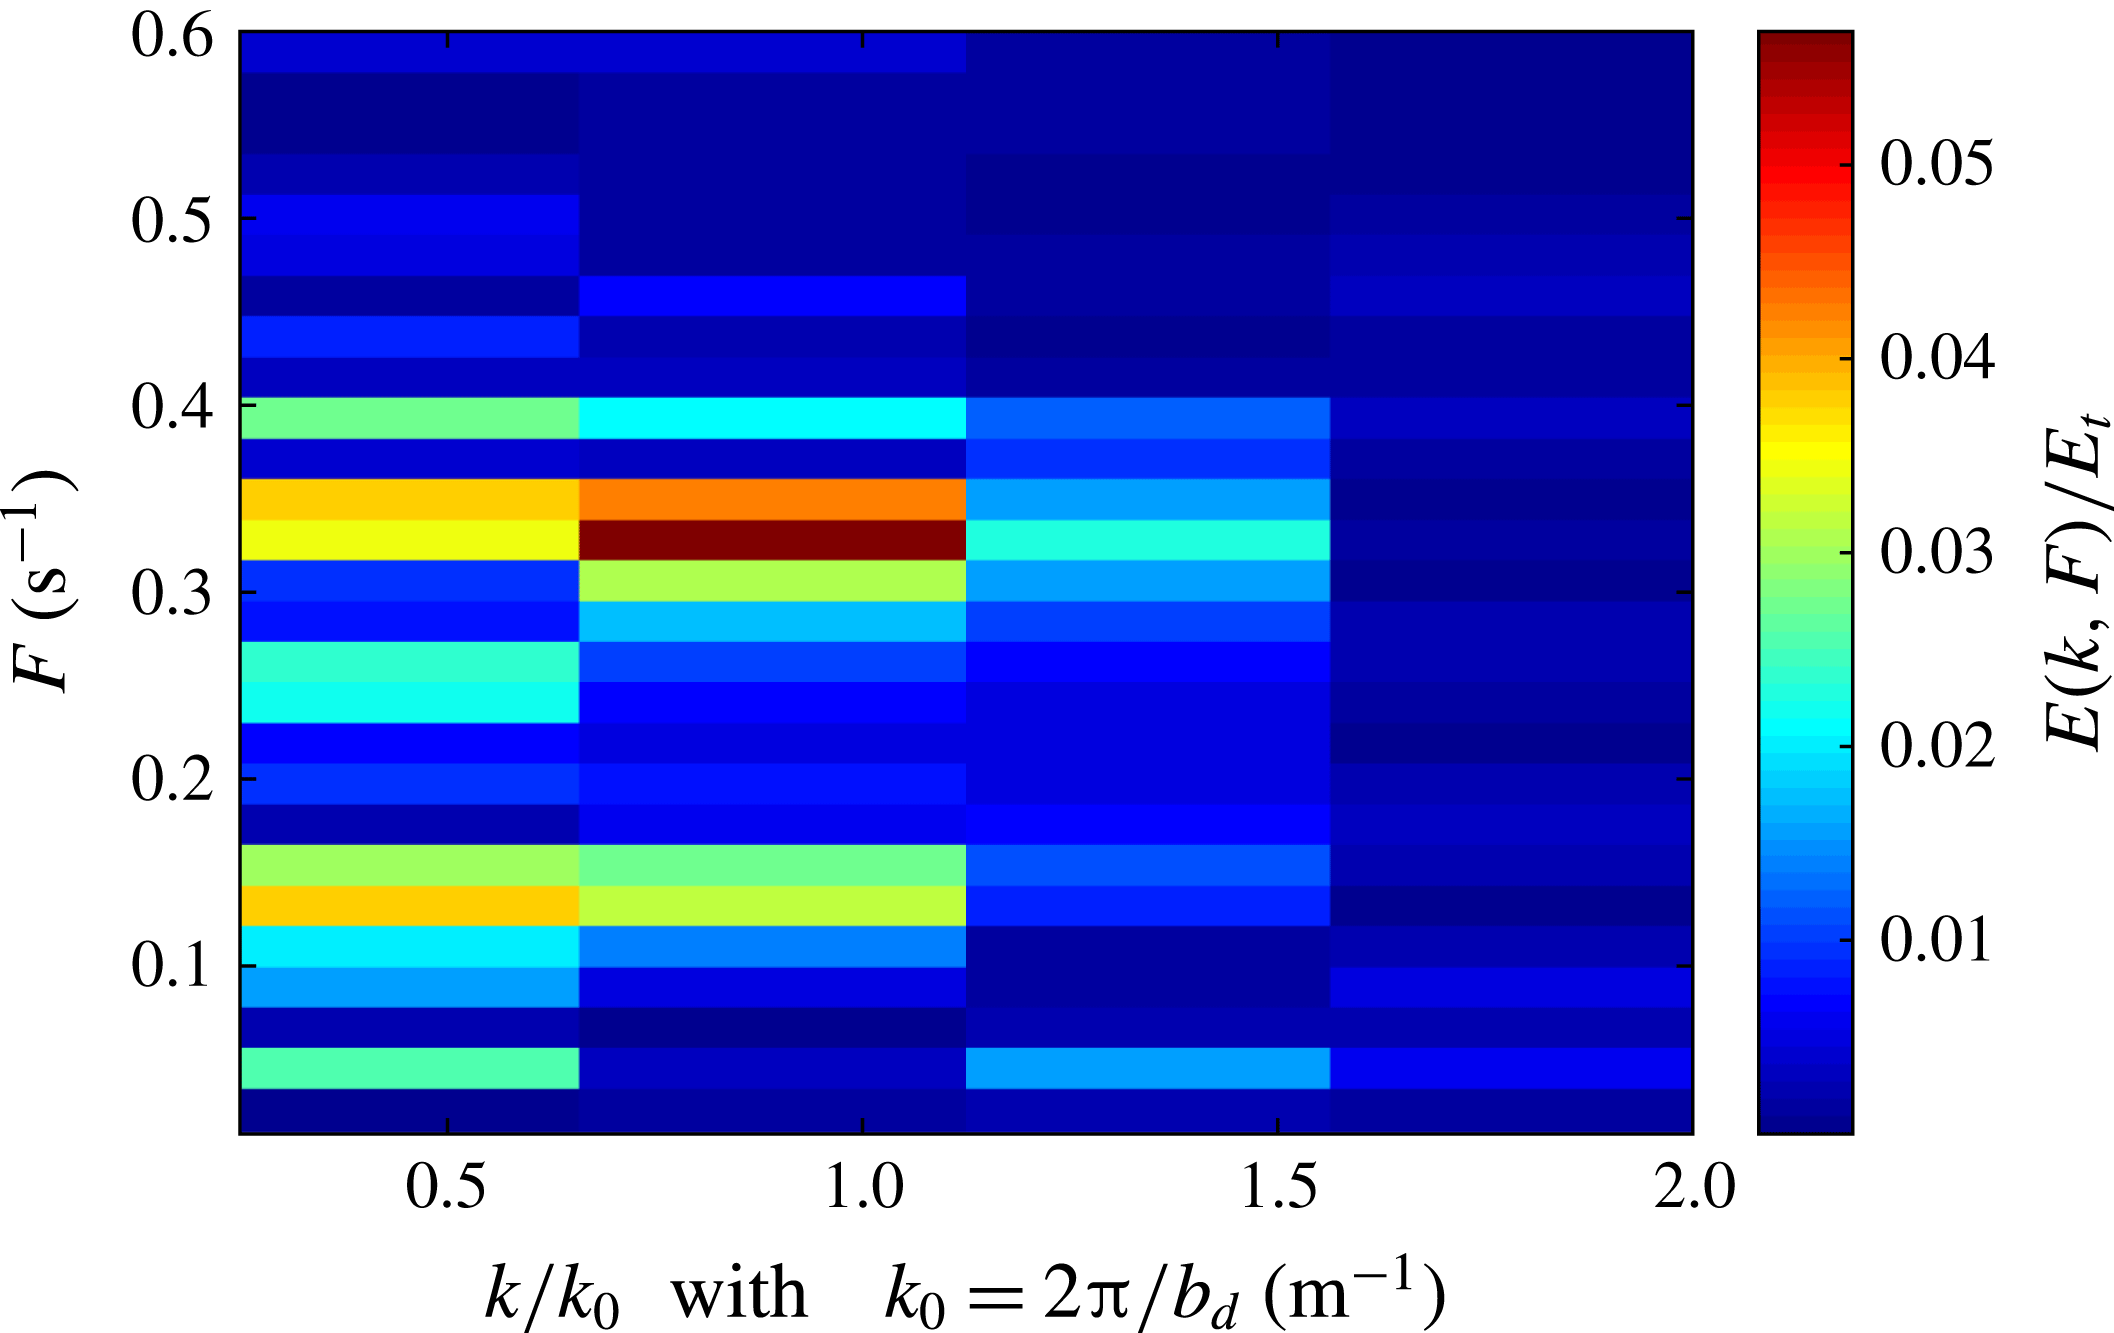
and we perform a two-dimensional spectrum of the spatio-temporal evolution of
 $\unicode[STIX]{x1D702}(x,t)$
. It consists in projecting the spatio-temporal field
 $\unicode[STIX]{x1D702}(x,t)$
inside the dome, i.e. for
 $|x|<b_{d}$
, onto the two-dimensional Fourier space
 $(k,F)$
. We restrict the spatial domain to the dome region, where the waves are generated and amplified. The result is reported in figure 7, where only frequencies below
 $0.6$
Hz and wavenumbers smaller than or equal to
 $2k_{0}$
, with
 $k_{0}=2\unicode[STIX]{x03C0}/b_{d}$
(run M2, table 1), are reported, a bandwidth containing
 $89\,\%$
of the total energy. The wavenumber
 $k$
is rescaled by
 $k_{0}=2\unicode[STIX]{x03C0}/b_{d}$
, with
 $b_{d}$
the dome radius, and the energy density is rescaled by the total energy: the colour map corresponds to the percentage of energy in the modes. The temporal dynamic of the height
 $\unicode[STIX]{x1D702}$
is mostly modulated by two time-spectral components: slow standing modes and interfacial gravity waves. The slow mode is characterized by frequencies in the range
 $F\in [0.05{-}0.15]$
Hz with a peak in the mode with wavelength
 $k=0.5k_{0}$
. The waves are characterized by wavenumbers between
 $0.5k_{0}$
and
 $k_{0}$
, i.e. wavelengths between
 $b_{d}$
and
 $2b_{d}$
, and frequencies in the range
 $F\in [0.3{-}0.4]$
Hz, i.e. a typical period with
 $T=2.9\pm 0.4$
s. The precise characterization of the wavelength is difficult because it is comparable with the length of propagation. The dispersion relation of interfacial waves for irrotational flow gives a period of
 $2\unicode[STIX]{x03C0}(k_{0}gAt)^{-0.5}\simeq 1.85$
s, with
 $At=(\unicode[STIX]{x1D70C}_{2}-\unicode[STIX]{x1D70C}_{1})/(\unicode[STIX]{x1D70C}_{2}+\unicode[STIX]{x1D70C}_{1})$
the Atwood number, a value comparable to the measured one. The difference may be explained by the presence of an inclined interface of propagation, by the Doppler shift associated with a mean non-uniform flow, and/or because the waves are not irrotational. It is worth noting that the energy in the waves is approximately two times larger than the energy in the slow modes.
Two-dimensional power spectrum
 $E(k,F)$
of the elevation
 $\unicode[STIX]{x1D702}(x,t)$
. The wavenumber
 $k$
is rescaled by
 $k_{0}=2\unicode[STIX]{x03C0}/b_{d}$
and the energy density is rescaled by the total energy
 $E_{t}$
.

By using a bandpass filter containing the frequency range
 $[0.3{-}0.4]$
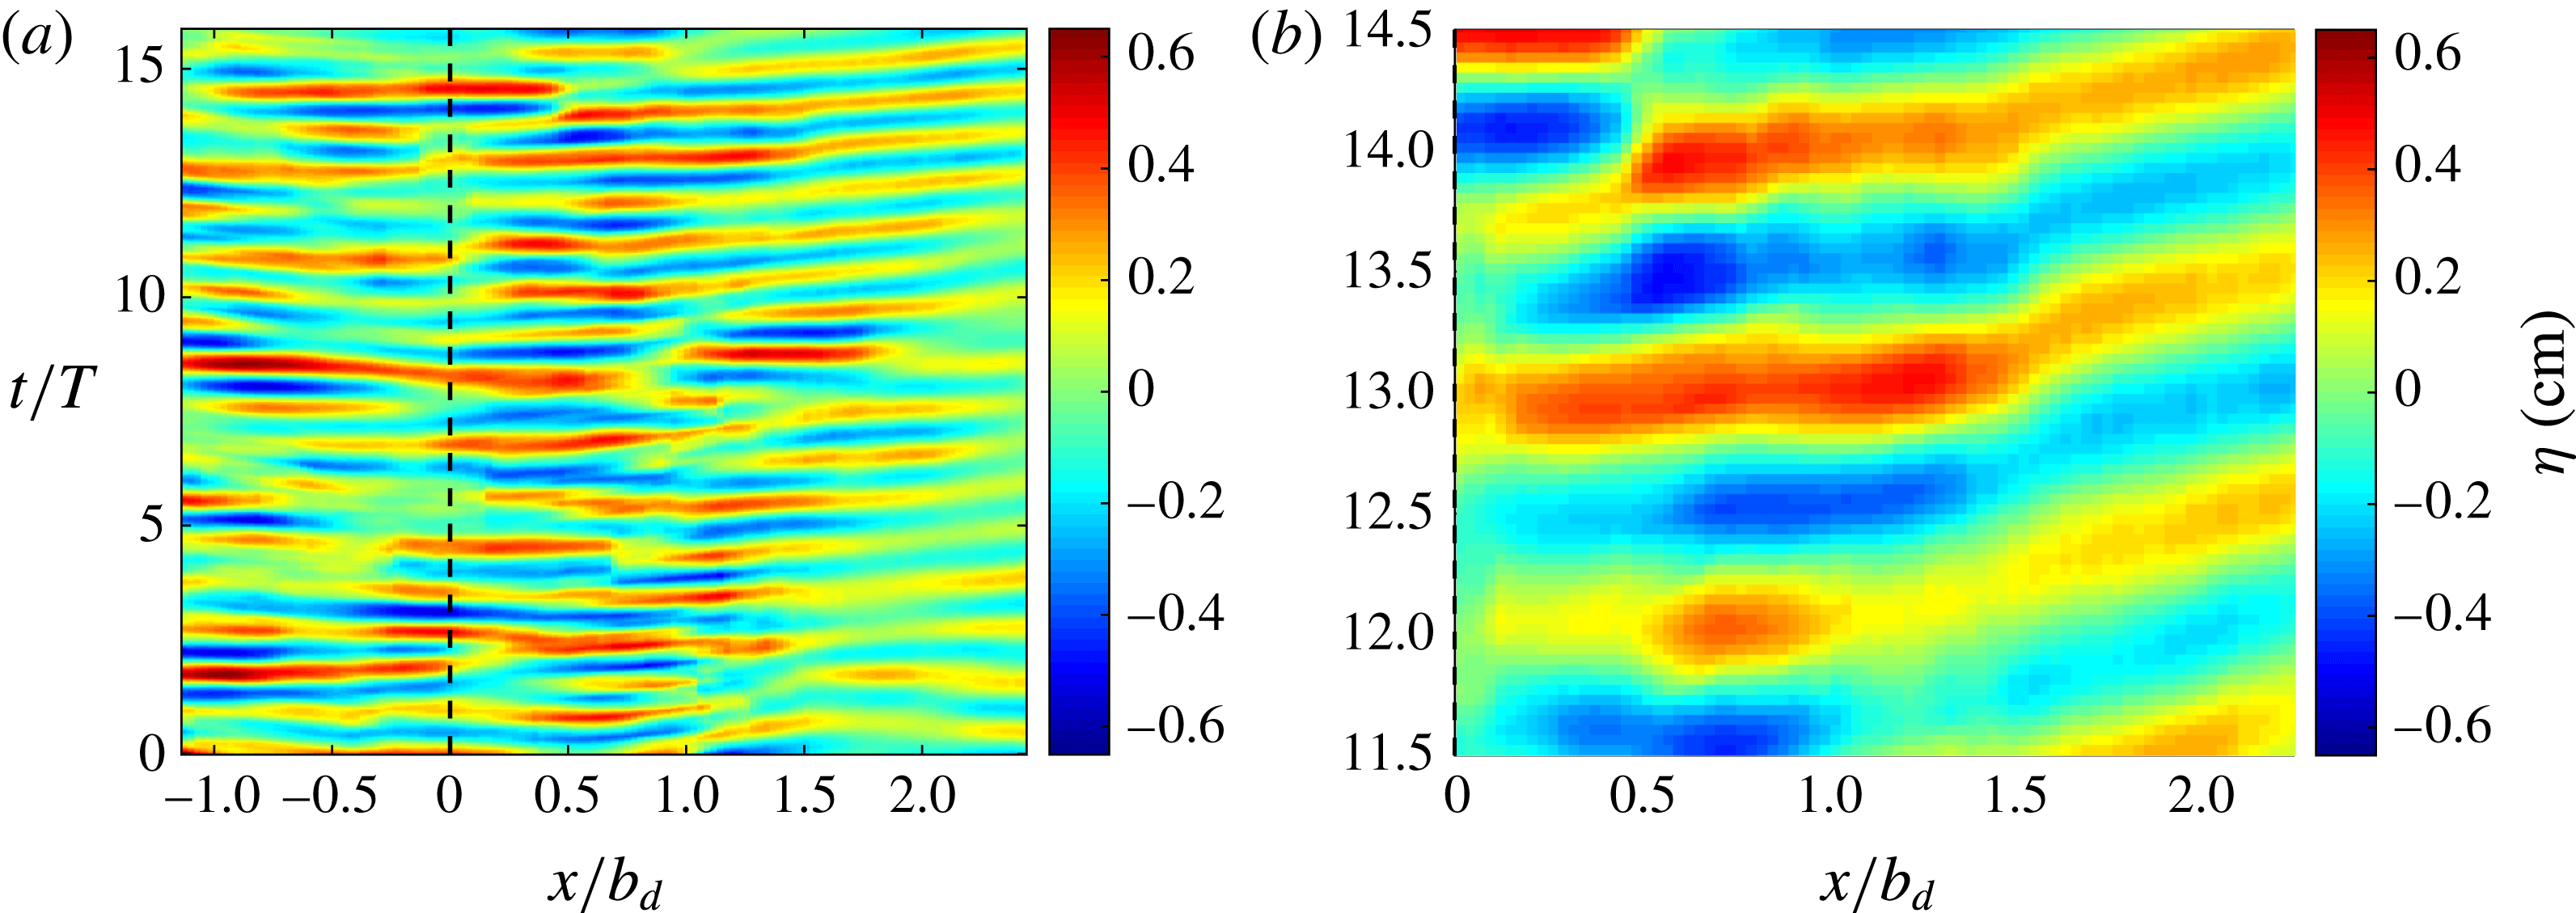
Hz, we are able to extract the propagation of the interfacial waves. The spatio-temporal diagram of the bandpass-filtered
 $\unicode[STIX]{x1D702}$
is reported in figure 8(a), with the abscissae rescaled by
 $b_{d}$
and the time
 $t$
by the period of the waves
 $T=2.9$
s. The amplitude
 $\unicode[STIX]{x1D702}$
of the waves is divided by the depth of the dome
 $\unicode[STIX]{x1D709}$
. It confirms that the half-wavelength of the waves is of the order of the dome radius. The dynamics of the wave is complex but we observe that most of the waves propagate outwards from the dome, as illustrated by figure 8(b). The plateau observed in the vicinity of
 $x\simeq b_{d}$
corresponds to the breaking of the wave envelope during the wave breaking.
(a) Spatiotemporal diagram of the height perturbation
 $\unicode[STIX]{x1D702}(x,t)=h(x,t)-\langle h\rangle$
, filtered in the frequency range
 $f\in [0.3{-}0.4]$
Hz. The abscissae are rescaled by the radius of the dome
 $b_{d}$
, the time by the mean wave period
 $T=2.9$
s, and the amplitude of the height by the depth of the dome
 $\unicode[STIX]{x1D709}$
. (b) Zoom of the region
 $x\in [0{-}2.25]b_{d}$
and
 $t\in [11.5{-}14.5]T$
.

A clear demonstration of the wave propagation is given by the trajectory of the wave envelope from the bandpass-filtered elevation
 $\unicode[STIX]{x1D702}(x,t)$
in the region
 $x\in [0,b_{d}]$
. We perform a Lagrangian tracking of the waves, which consists in following this wave envelope. We report some trajectories
 $x(t)$
in figure 9(a). From the trajectories, we calculate the phase velocity
 $c={\dot{x}}(t)$
. The velocities being not constant, we calculate the probability density function
 $p(c)$
of
 $c$
for all the trajectories (inset of figure 9
a). Most of the phase velocities are positive for
 $x\in [0,b_{d}]$
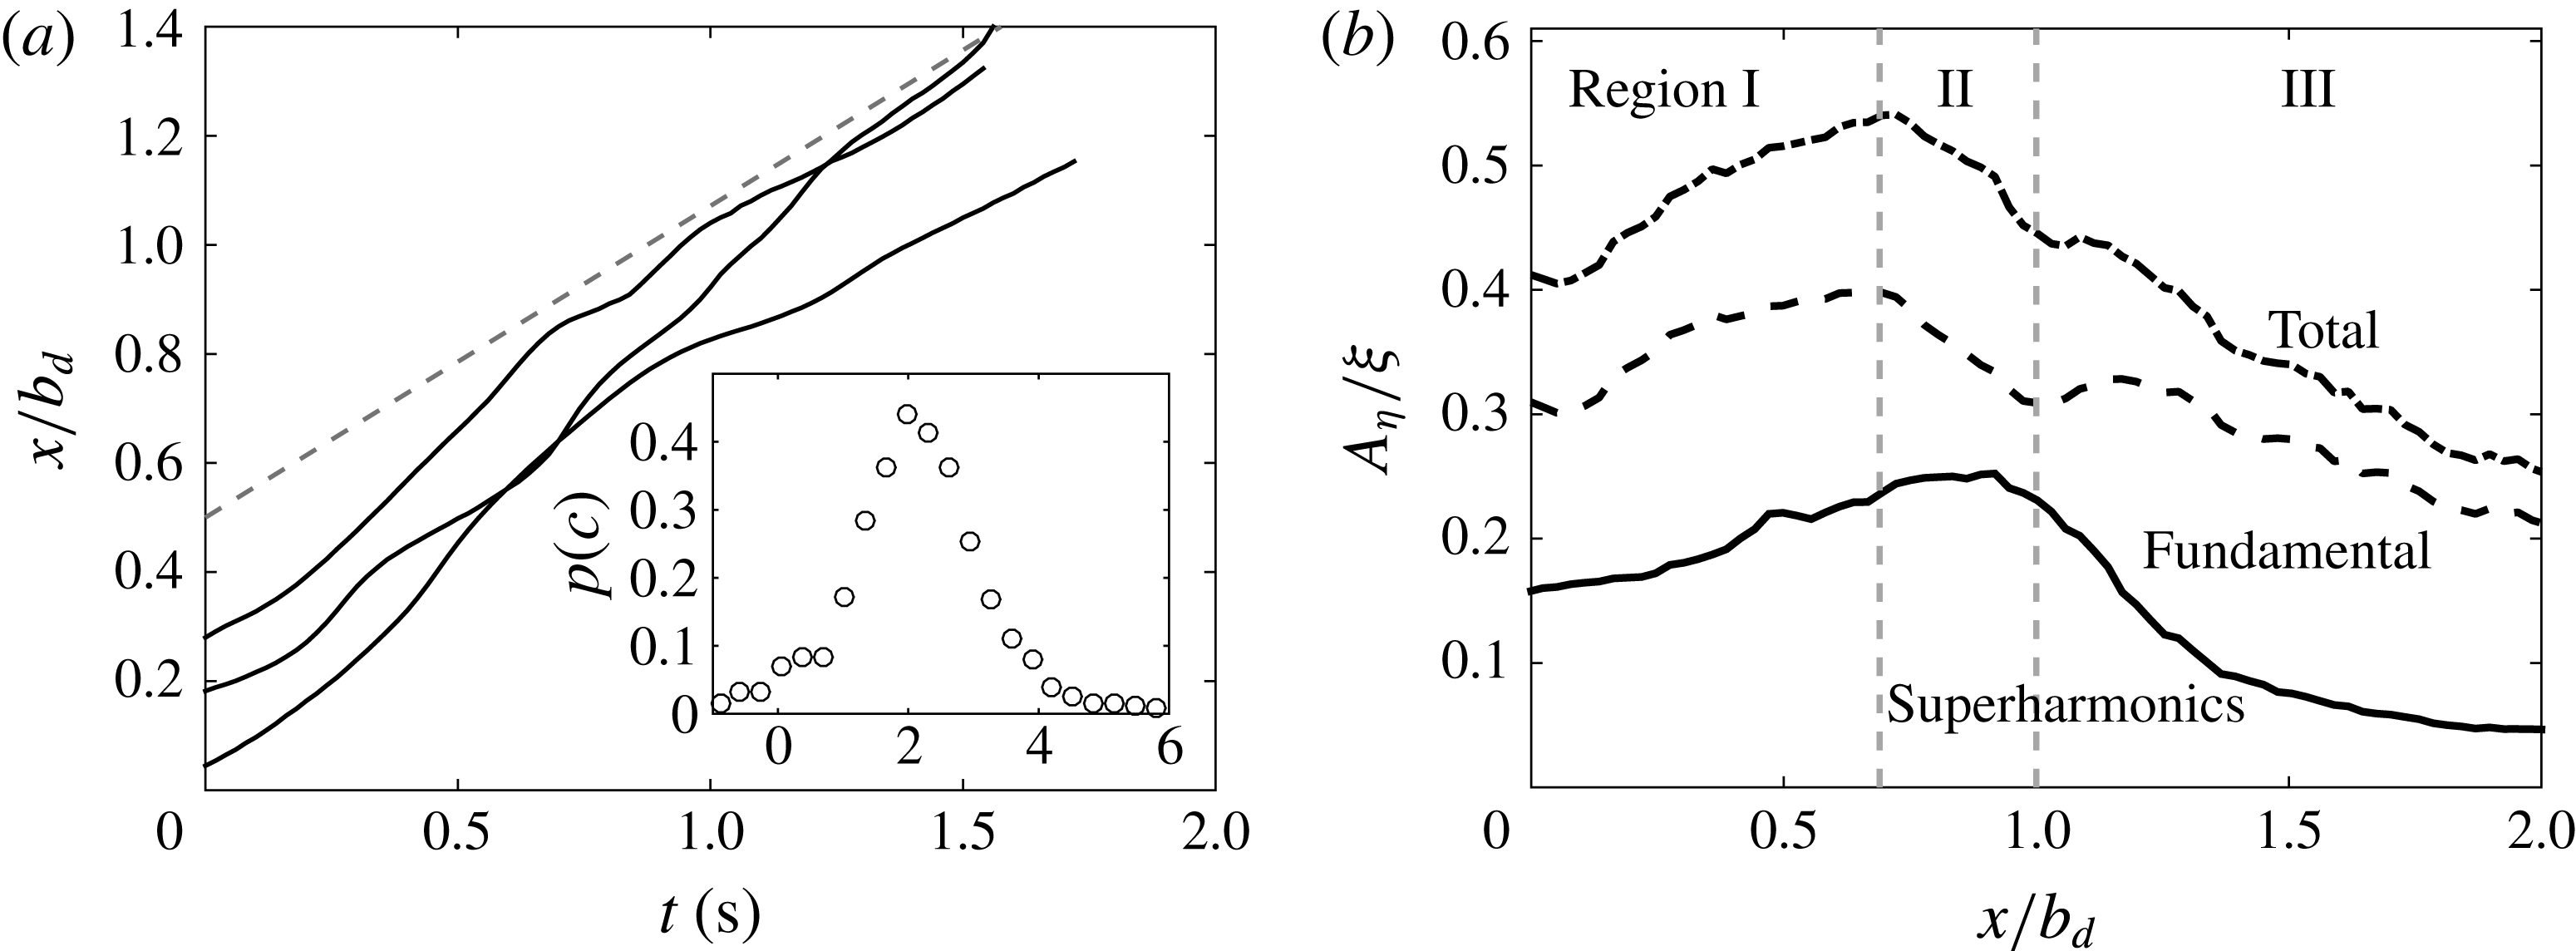
, which confirms that the waves propagate outwards, from the impinged region to the dome border. The distribution exhibits an important dispersion around its maximum due to the turbulent perturbations. The most probable phase velocity corresponding to
 $c_{p}=2~\text{cm}~\text{s}^{-1}$
will be taken as the reference phase velocity. We will consider
 $c_{p}$
to be the most representative velocity during the wave propagation, although the phase velocity
 $c$
may fluctuate. The grey dashed curve in figure 9(a) corresponds to the trajectory with
 $x=c_{p}t+x_{0}$
. We then calculate the wave amplitude
 $$\begin{eqnarray}A_{\unicode[STIX]{x1D702}}(x)=\sqrt{2}\left[\frac{1}{T_{e}}{\int _{0}}^{T_{e}}\unicode[STIX]{x1D702}^{2}(x,t)t\right]^{1/2},\end{eqnarray}$$
with
 $\unicode[STIX]{x1D702}$
the height perturbation without the slow mode component suppressed by a high-pass filter, and with
 $T_{e}$
the duration of the measurement. We report
 $A_{\unicode[STIX]{x1D702}}$
(upper dotted curve, called total) as a function of
 $x/b_{d}$
in figure 9(b). The dashed curve (called fundamental) corresponds to the amplitude of the waves in the frequency range
 $[0.3{-}0.4]$
Hz (by using a bandpass filter), and the black curve corresponds to the amplitude with higher frequencies. Despite the fact that the typical length scale of the waves is comparable with the distance of propagation, we distinguish different behaviours of the amplitude of the wave during its propagation. We have reported the three regions of interest: region I, where the waves are generated and amplified; region II, where the waves break; and region III, outside of the dome. The amplitude of the fundamental frequency increases in region I (
 $|x|<0.565b_{d}$
), suddenly drops in region II, and then decreases monotonically outside of the dome
 $|x|>b_{d}$
. In the breaking region, the amplitude of the modes with large frequencies decreases just after those of the fundamentals. This is a consequence of the breaking of the wave, where the density patches are wrapped and thinned (figure 5
b).
(a) Three trajectories of the wave envelope (full lines), compared to a virtual trajectory (dashed line) with constant phase velocity
 $c_{p}=2~\text{cm}~\text{s}^{-1}$
. Inset: distribution of the phase velocity
 $c$
. (b) Amplitude of the height
 $A_{\unicode[STIX]{x1D702}}$
given by (4.1). From top to bottom, the three curves show the total amplitude of the waves, the fundamental component and the higher harmonics.

4.3 Wave generation
We now focus on the wave excitation mechanism, with two possible candidates: instability of the interface, and interface excitation by turbulent fluctuations. First, we investigate the stability of the interface and we demonstrate that the shear at the interface is not strong enough to trigger Kelvin–Helmholtz or Holmboe instabilities.
The stability of the interface is related to the local Richardson number given by
 $Ri=N^{2}/s_{0}^{2}$
, with
 $s_{0}$
the shear defined by
 $s_{0}=(\unicode[STIX]{x2202}_{z_{1}}U_{t})$
at
 $z_{1}=0$
and
 $N$
the frequency of interfacial gravity waves. It compares the destabilizing effect of the shear to the stabilizing buoyant effects. The perturbations being interfacial gravity waves, the Richardson number is defined by
 $Ri=(g^{\prime }/b_{d})/s_{0}^{2}$
.
The shear
 $s_{0}$
is calculated from the mean velocity field and it corresponds to the tangential velocity gradient at the interface
 $\langle h\rangle$
(figure 4
b). Figure 3 shows that the interface merges with a streamline of the average flow passing close to the stagnation point. The mean velocity field along the interface satisfies the relation
 $\langle u_{x}\rangle \unicode[STIX]{x2202}_{x}\langle h\rangle \simeq \langle u_{z}\rangle$
for
 $|x|<0.6b_{d}$
. Hence, the stationary mean interface position
 $\langle h\rangle (x)$
verifies the continuity of the mean material line,
 $\unicode[STIX]{x2202}_{t}\langle h\rangle +\langle u_{x}\rangle \unicode[STIX]{x2202}_{x}\langle h\rangle =\langle u_{z}\rangle$
, since
 $\unicode[STIX]{x2202}_{t}\langle h\rangle =0$
. We conclude that the average velocity field and the mean position of the interface may be considered in quasi-equilibrium, supporting the stability analysis of the interface from the mean fields.
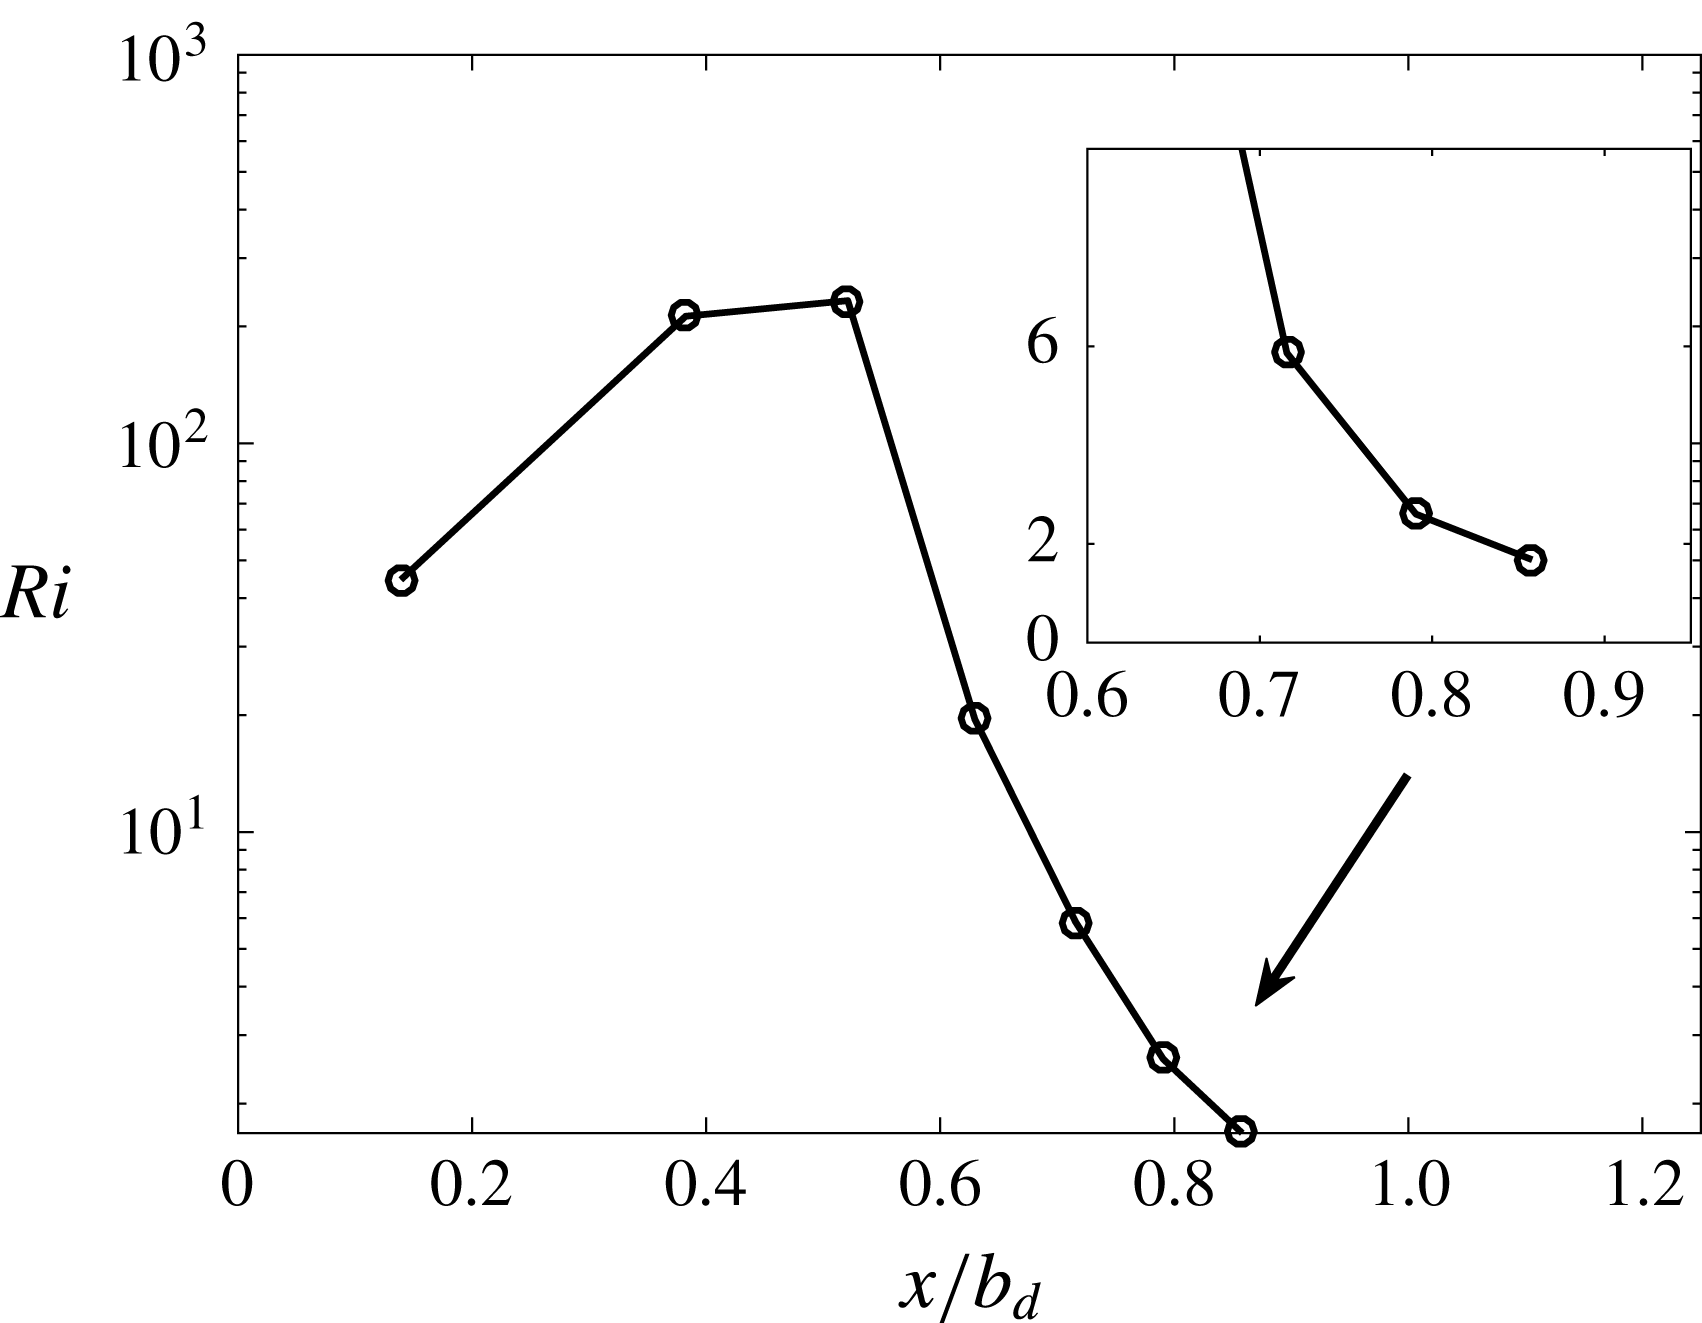
Richardson number as a function of
 $x/b_{d}$
with
 $Ri=(g^{\prime }/b_{d})/s_{0}^{2}$
and
 $s_{0}=(\unicode[STIX]{x2202}_{z_{1}}U_{t})_{z_{1}=0}$
.

The local Richardson number is reported in figure 10. It varies between
 $40$
and
 $230$
in the vicinity of the head of the dome, i.e.
 $|x|<2.5$
cm or
 $0.61b_{d}$
. It turns out that the interface should not be destabilized in this region by a classical Kelvin–Helmholtz instability, which should operate for
 $Ri<1/4$
(Chandrasekhar Reference Chandrasekhar1961; Miles Reference Miles1961) (see also the numerical simulations by Woodward, Herwig & Lin (Reference Woodward, Herwig and Lin2014) on a closely related problem). It is worth noting that by using the frequency of internal gravity waves instead of that of interfacial waves for the definition of the Richardson number, the dimensionless number becomes one order of magnitude larger than that defined here. We point out that the presence of a curved interface and an accelerating flow, i.e.
 $\unicode[STIX]{x2202}_{x}U_{t}>0$
, may change the stability criteria. Nonetheless these effects are only significant on the sides of the dome, where the waves are already excited and amplified.
Moreover, the length scale of the instability is not compatible with that of the Kelvin–Helmholtz instability. For a sharp velocity jump, the smallest unstable wavenumber is given by (Chandrasekhar Reference Chandrasekhar1961)
 $$\begin{eqnarray}k_{min}\simeq \frac{2gAt}{\unicode[STIX]{x0394}U^{2}},\end{eqnarray}$$
with
 $\unicode[STIX]{x0394}U$
the velocity jump at the interface. From figure 4(b), the largest velocity jump is typically
 $\unicode[STIX]{x0394}U_{max}=1~\text{cm}~\text{s}^{-1}$
inside the dome. The numerical application gives
 $k_{min}=5.8\times 10^{3}~\text{m}^{-1}$
, corresponding to a wavelength of less than
 $0.1$
cm. The Kelvin–Helmholtz instability could only trigger perturbations at scales 20–40 times smaller than the one observed. Reciprocally, the velocity jump should be at least six times larger to account for the observed wavelength. Besides, Kumagai (Reference Kumagai1984) showed that the interfacial Froude number is expected to decrease during the erosion process, suggesting that
 $Ri$
should increase (
 $Ri\propto Fr_{i}^{-2}$
). From this analysis, we conclude that, if the interface is initially stable for the Kelvin–Helmholtz instabilities, it remains so during the whole erosion process.
Another alternative to the Kelvin–Helmholtz instability is the Holmboe instability (Holmboe Reference Holmboe1962). This instability can operate for large Richardson numbers, and Alexakis (Reference Alexakis2009) showed that it may appear for
 $Ri=30$
(far from the
 $1/4$
of the Kelvin–Helmholtz instability). However, the Richardson number is larger than
 $40$
for
 $|x/b_{d}|<0.6$
in the dome. The mode associated with the Holmboe instability is also characterized by symmetric cusps at large Richardson number (Strang & Fernando Reference Strang and Fernando2001). This pattern has not been observed in our experiment. We conclude that neither the Kelvin–Helmholtz instability nor the Holmboe instability generate perturbations on the interface.
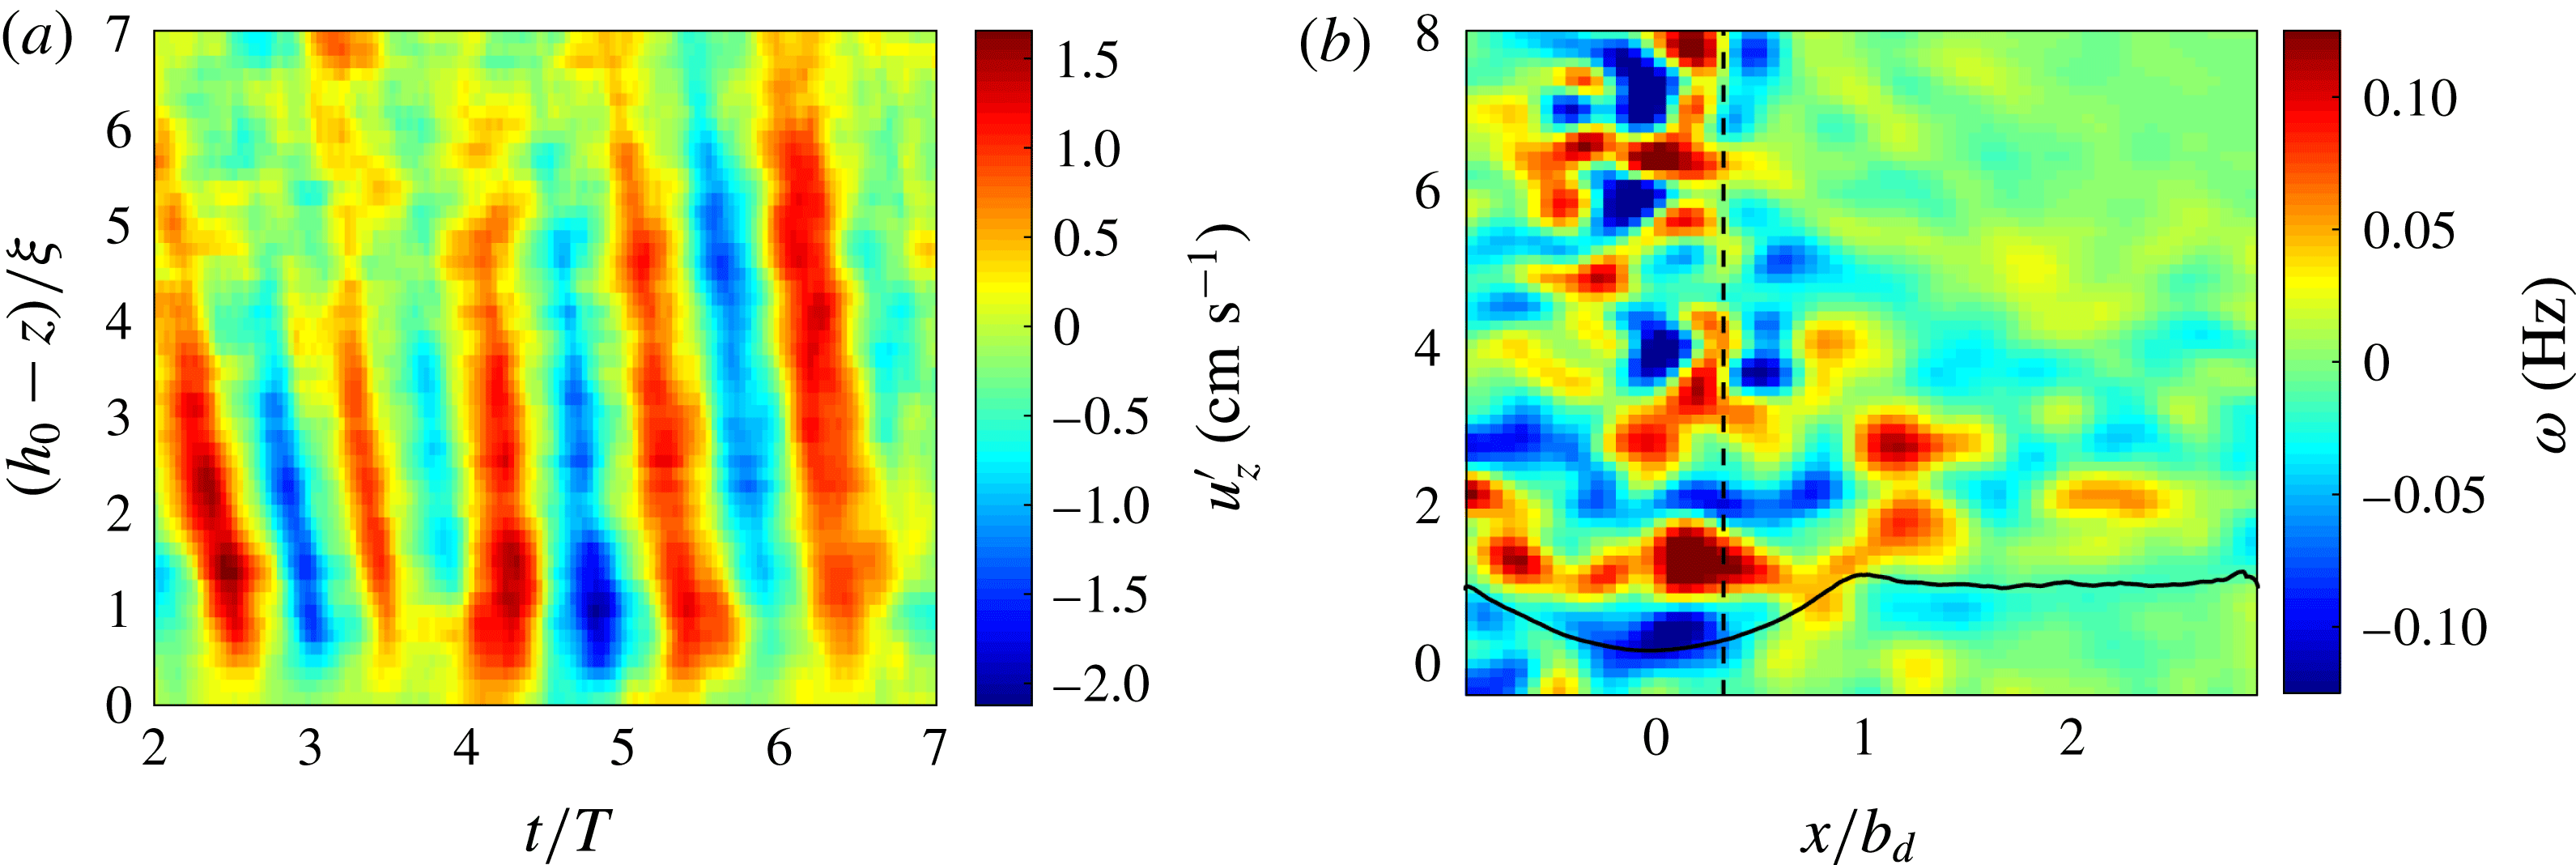
(a) Spatiotemporal diagram of the fluctuations
 $u_{z}^{\prime }$
in the range of frequencies
 $[0.3,0.4]$
Hz along the vertical axis
 $x=0.37b_{d}$
. (b) Bandpass-filtered fluctuations of the vorticity field, calculated from a coarse-grained velocity field with width of
 $0.75$
cm (Gaussian filter). The dashed curve represents the vertical axis at
 $x=0.37b_{d}$
.

The source of waves is rather provided by the turbulent fluctuations of the jet. Having identified the region and the frequency range of the waves in § 4.2, we look for their signature in the turbulent jet. In order to demonstrate that the perturbations come from the jet, we focus on the fluctuations of the vertical velocity component
 $u_{z}^{\prime }=u_{z}-\langle u_{z}\rangle$
along the axis
 $x=0.37b_{d}$
, represented by the dashed curve in figure 11(b). We calculate the bandpass-filtered component of
 $u_{z}^{\prime }$
in the frequency range
 $[0.3{-}0.4]$
Hz. The associated spatio-temporal diagram is reported in figure 11(a) with
 $t$
and
 $z$
rescaled by the period of the wave
 $T$
and the depth of the dome
 $\unicode[STIX]{x1D709}$
. We clearly identify perturbations propagating from the jet to the dome. It is worth noting that these fluctuations appear far from the dome at
 $|h_{0}-z|\simeq (5\pm 1)\unicode[STIX]{x1D709}$
and they seem to be incoherent before. This region is far from the transitional distance close to the nozzle of the jet (
 $z<50b_{0}$
), where coherent structures may be generated in the early development of the jet (Yule Reference Yule1978). Thus, it is possible that a coherent process, based on the interplay between the jet and the interface, may filter or select the perturbations far from the interface. The bandpass-filtered fluctuation of the vorticity field, calculated from a coarse-grained velocity field, is reported in figure 11(b) for a given time
 $t$
. It shows that the fluctuations
 $u_{z}^{\prime }$
are associated with large-scale vortices, which propagate towards the interface. The diameter of the vortices close to the dome is
 $\unicode[STIX]{x1D706}=3\pm 1$
cm. At the entrance of the dome, the typical vertical velocity is
 $\langle u_{z}\rangle \simeq 2\pm 1~\text{cm}~\text{s}^{-1}$
(figure 3). So a typical period of excitation corresponds to the advection of two vortices of opposite vorticity and the associated time scale of forcing is
 $2\unicode[STIX]{x1D706}/\langle u_{z}\rangle \simeq 3$
s, a value very close to the wave period
 $T$
.
From the fluctuation
 $u_{z}^{\prime }$
, we can estimate a Richardson number for the observed eddies. The maximum amplitude of
 $u_{z}^{\prime }$
reaches a typical value given by
 $u_{max}=2~\text{cm}~\text{s}^{-1}$
. The Richardson number of these eddies is defined by
 $Ri_{\unicode[STIX]{x1D706}}=g^{\prime }\unicode[STIX]{x1D706}/(u_{max}^{2})$
(Cotel & Breidenthal Reference Cotel and Breidenthal1996) and corresponds to
 $Ri_{\unicode[STIX]{x1D706}}\simeq 22$
. An energy balance between the kinetic energy of the vortex and the potential energy associated with the penetration depth
 $\unicode[STIX]{x1D6FF}$
gives
 $\unicode[STIX]{x1D6FF}/\unicode[STIX]{x1D706}\sim Ri_{\unicode[STIX]{x1D706}}^{-1}$
(Linden Reference Linden1973). From the measured Richardson number, the penetration depth is of order
 $\unicode[STIX]{x1D6FF}/\unicode[STIX]{x1D706}\simeq 5\times 10^{-2}$
. Thus the convolution of the interface is expected to be too small if we consider only the classical model of the vortex impact, and another mechanism should operate to account for the observed deformation of the interface. It has been recently demonstrated in the context of internal gravity waves excited by a turbulent plume that the waves can be forced by the bulk pressure field of the turbulence (Lecoanet et al.
Reference Lecoanet, Le Bars, Burns, Vasil, Brown, Quataert and Oishi2015). This approach could be fruitful to explain the wave excitation for eddies with large Richardson numbers.
4.4 Wave amplification
The amplification of excited waves is needed to explain the observed growth of the perturbation along the interface (figure 9
b). Furthermore, the axisymmetry of the configuration leads a priori to a decrease of the energy of the perturbation, due to the radial spreading of the energy. Thus, the amplification must at least counterbalance the energy spreading due to the axisymmetry. As shown in the previous section, it must be provided by a mechanism different from the Kelvin–Helmholtz and Holmboe instabilities. It is interesting to note that our configuration shows some similarities with the problem of the generation of ocean waves by turbulent wind (Janssen Reference Janssen2004). Ocean waves are generated by turbulent pressure fluctuations with a sheared mean flow. As in our configuration, the Kelvin–Helmholtz instability is not the best candidate to explain the generation of ocean waves (Janssen Reference Janssen2004). Focusing initially on an ideal configuration (Miles Reference Miles1957), Miles (Reference Miles1960) showed that the presence of a shear flow across a density jump may lead to an enhancement of the energy transfer to the interfacial waves. This scenario is based on the presence of a critical layer (Miles Reference Miles1957) at height
 $z_{c}$
where the phase velocity of the wave matches the mean flow velocity
 $U_{t}(z_{c})$
. It is usually called the Miles instability. This instability enables the transfer of energy from the mean flow to the wave if, at the critical height
 $z_{c}$
, the second derivative of
 $U_{t}$
is negative. This instability is characterized by wave-induced stress, so that the Reynolds stresses
 $\unicode[STIX]{x1D70F}=-\langle u_{x}^{\prime }u_{x}^{\prime }\rangle$
are non-zero. A physical interpretation of the instability is given by Lighthill (Reference Lighthill1962). This mechanism is similar to the critical layer encountered in shear flow with no inflection point (Drazin & Reid Reference Drazin and Reid2004), but it differs from the critical layer found in stratified flows, where the wave gives its energy to the mean flow, even if the amplitude of the wave may increase due to the wave-action conservation (Sutherland Reference Sutherland2010). Our measurements show that the mechanism of amplification operating in the dome shares similarities with the Miles instability. Despite the difference in geometry between the framework of the Miles instability and our configuration, we use the theoretical results of the Miles instability, in the absence of theoretical prediction adapted to our case.
A resonance between the waves and the mean flow can operate if the typical phase velocity
 $c_{p}$
and the tangential velocity
 $U_{t}$
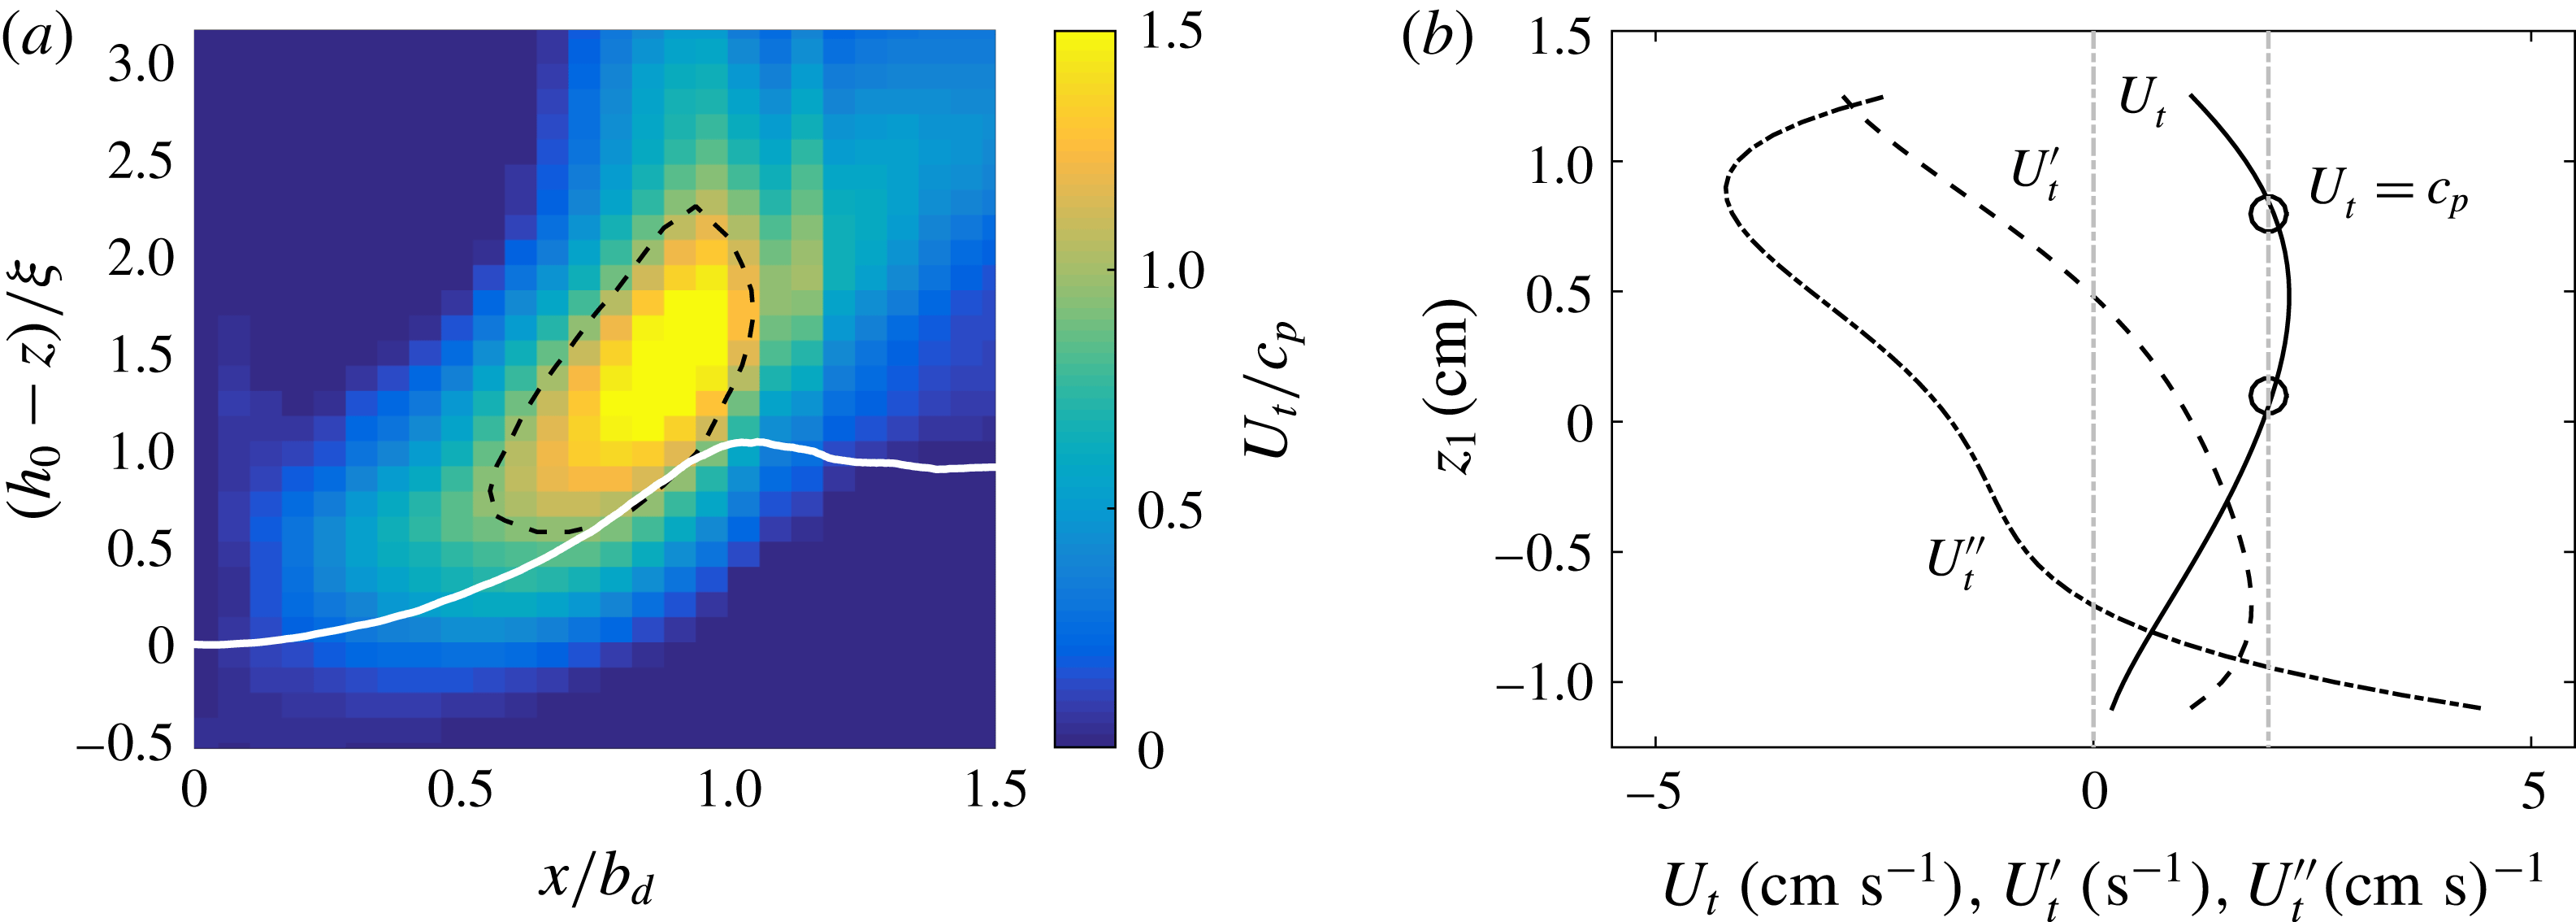
are equal in the vicinity of the impinged region. In figure 12(a), the velocity
 $U_{t}$
is divided by the phase velocity
 $c_{p}=2~\text{cm}~\text{s}^{-1}$
for the half-plane of symmetry of the jet given by
 $x>0$
. The white curve is the mean interface
 $\langle h\rangle$
. The closed dashed curve represents the contour where
 $U_{t}=c_{p}$
: inside this region, the waves propagate on average more slowly than the mean flow. The enclosed region appears for
 $|x|>0.58b_{d}$
and ceases for
 $x\simeq b_{d}$
. It is worth noting that this area is strongly correlated to the breaking region.
(a) Tangential velocity
 $U_{t}$
divided by the phase velocity
 $c_{p}=2~\text{cm}~\text{s}^{-1}$
. The black dashed curve represents the contour where
 $U_{t}=2~\text{cm}~\text{s}^{-1}$
. The white curve corresponds to the interface. (b) Profile of the tangential velocity
 $U_{t}$
corresponding to the abscissa
 $x=0.7b_{d}$
extracted from figure 4(b). Its first
 $U_{t}^{\prime }$
and second
 $U_{t}^{\prime \prime }$
depth derivatives are represented, respectively, by dashed and dashed-dotted lines. The circles correspond to the points where the velocity is equal to
 $c_{p}$
.

This matching between the mean flow velocity and the phase velocity may lead to amplification of the wave, similar to the Miles instability, if the growth rate is positive. As we consider wave amplification here, the growth rate may be interpreted as a mean energy transfer rate from the mean flow to the waves (Miles Reference Miles1960). The calculation of the growth rate of this instability is complex and an explicit formula exists only for idealized configurations (Miles Reference Miles1957; Morland & Saffman Reference Morland and Saffman1993; Drazin & Reid Reference Drazin and Reid2004). It depends on properties of the mean flow at the critical layer and it requires knowledge of the amplitude of the initial neutral perturbation. This is out of reach of the present study and we will focus only on the sign of the growth rate in order to confirm the presence of the instability. The grow rate of the instability is given at leading order in
 $\unicode[STIX]{x1D70C}_{1}/\unicode[STIX]{x1D70C}_{2}$
by (Miles Reference Miles1957; Drazin & Reid Reference Drazin and Reid2004; Young & Wolfe Reference Young and Wolfe2014)
 $$\begin{eqnarray}\unicode[STIX]{x1D70E}=-\frac{\unicode[STIX]{x03C0}}{2}\frac{\unicode[STIX]{x1D70C}_{1}}{\unicode[STIX]{x1D70C}_{2}}c_{p}\left(\frac{\text{d}^{2}U_{t}}{\text{d}{z_{1}}^{2}}\right)\left|\frac{\text{d}U_{t}}{\text{d}z_{1}}\right|^{-1}\left|\frac{\unicode[STIX]{x1D719}_{c}}{\unicode[STIX]{x1D719}_{s}}\right|^{2},\end{eqnarray}$$
with
 $|\unicode[STIX]{x1D719}_{c}/\unicode[STIX]{x1D719}_{s}|$
the ratio of the streamfunction at the critical layer
 $\unicode[STIX]{x1D719}_{c}$
and at the interface
 $\unicode[STIX]{x1D719}_{s}$
. The criteria of instability requires that the second derivative of
 $U_{t}$
must be negative. In figure 4(b), the profiles of
 $U_{t}$
are concave, which suggests that
 $U_{t}^{\prime \prime }=\text{d}^{2}U_{t}/\text{d}{z_{1}}^{2}$
is negative. We verify these properties for the profile at
 $x=0.7b_{d}$
(fifth profile starting from figure 4
a), where
 $U_{t}=c_{p}$
for
 $z_{1}=0.1$
and
 $0.85$
cm. The first derivative
 $U_{t}^{\prime }$
and the second derivative
 $U_{t}^{\prime \prime }$
are reported in figure 12(b). The vertical grey dashed axis corresponds to the abscissa
 $0$
. The derivative
 $U_{t}^{\prime \prime }$
remains negative in the region where the wave can be in resonance with the mean flow: the wave can be amplified by the mean flow.
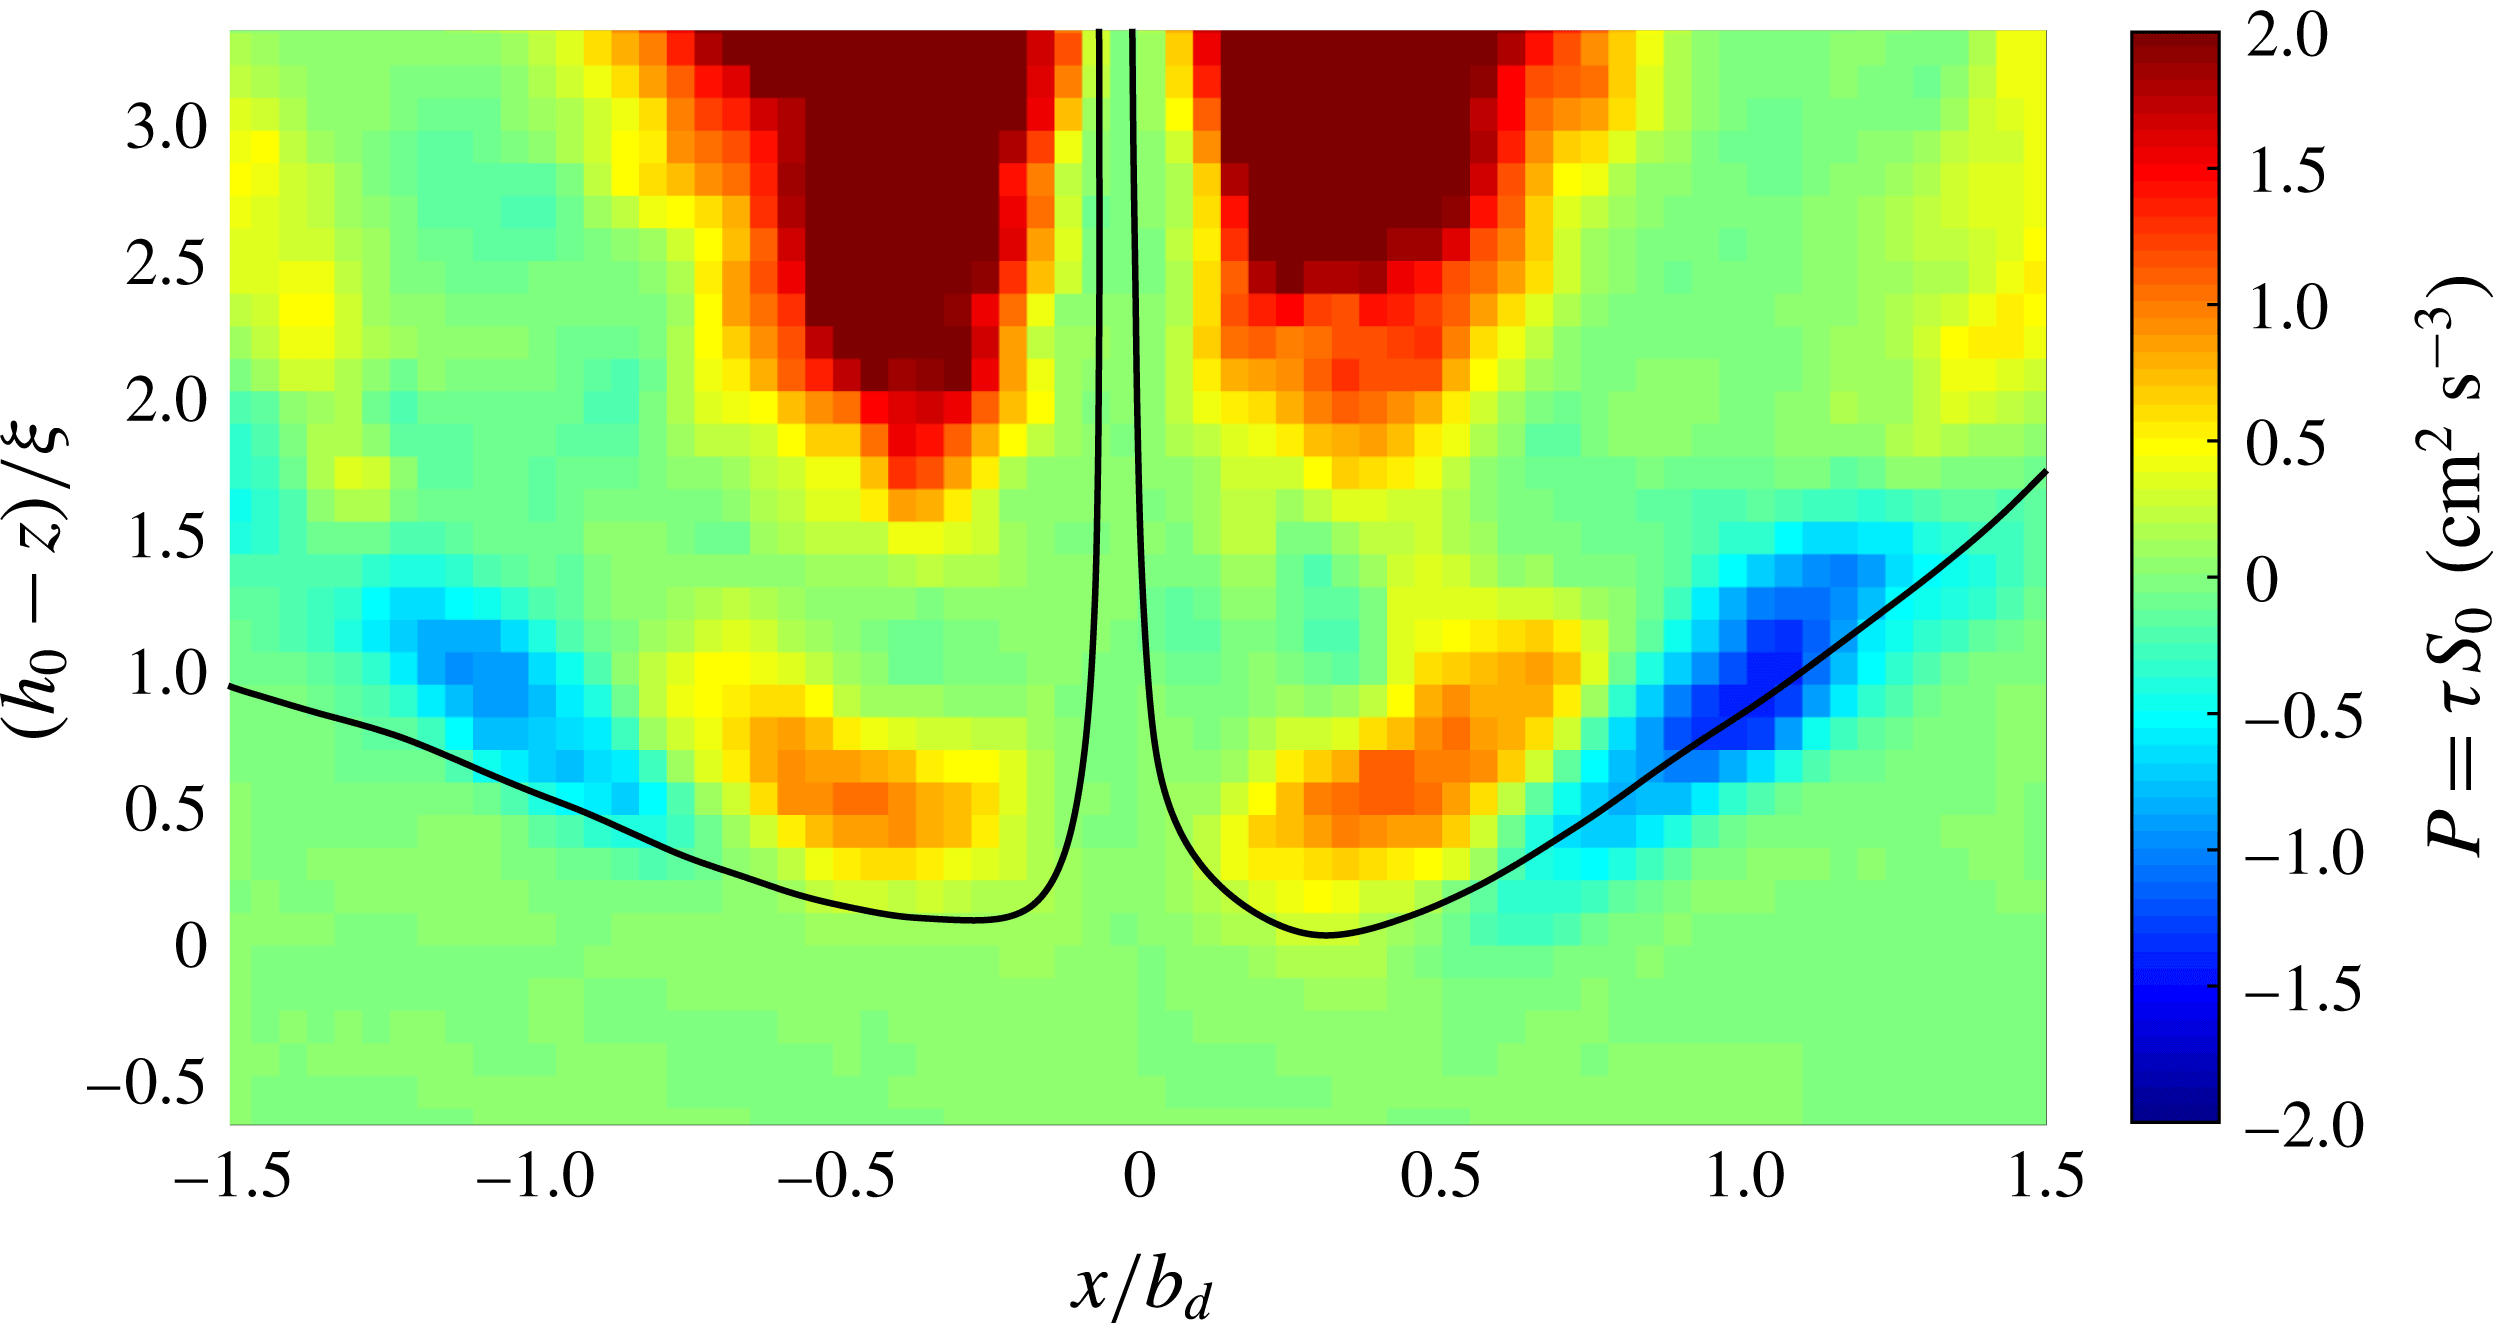
Production term
 $P(x,z)=\unicode[STIX]{x1D70F}S_{0}$
with
 $\unicode[STIX]{x1D70F}=-\langle u_{x}^{\prime }u_{z}^{\prime }\rangle$
the Reynolds stress and
 $S_{0}$
the large-scale shear. The black curve corresponds to the streamline passing close to the stagnation point.

We have shown that the condition of resonance
 $U_{t}(z_{c})=c_{p}$
and the derivatives of
 $U_{t}$
satisfy the condition of growth. If this instability is present, an increase of the disturbance energy must be seen through the action of the Reynolds stress (Lin Reference Lin1954; Drazin & Reid Reference Drazin and Reid2004). The energy transfer from the mean flow to the waves is given by the production term
 $P(x,z)=\unicode[STIX]{x1D70F}S_{0}$
, with the large-scale shear
 $S_{0}=\unicode[STIX]{x2202}_{x}\langle u_{z}\rangle +\unicode[STIX]{x2202}_{z}\langle u_{x}\rangle$
and the Reynolds stress
 $\unicode[STIX]{x1D70F}=-\langle u_{x}^{\prime }u_{z}^{\prime }\rangle$
. Thus, a positive production term corresponds to an amplification of the wave energy. The term
 $P$
is calculated for the run M
 $3$
(see table 1) and it is reported in figure 13. A sign change occurs in the region where
 $U_{t}\simeq c_{p}$
for
 $|x|=0.58b_{d}$
(dashed curve in figure 12
a). The production term is positive in the central region of the dome where
 $c_{p}>U_{t}$
, and it becomes negative when
 $|x|>(0.65\pm 0.1)b_{d}$
, where
 $c_{p}<U_{t}$
. This feature suggests the presence of a critical layer. As the sign of the shear
 $S_{0}$
remains constant on each side of the dome (
 $S_{0}<0$
for
 $x<0$
, and
 $S_{0}>0$
for
 $x>0$
), the variation of
 $P$
is associated with a change of sign of the Reynolds stress
 $\unicode[STIX]{x1D70F}$
. This is a fundamental property of the critical layer (Miles Reference Miles1957; Drazin & Reid Reference Drazin and Reid2004). The relative phase between
 $u_{x}^{\prime }$
and
 $u_{z}^{\prime }$
varies abruptly across the critical layer where
 $U_{t}=c_{p}$
, leading to a sharp transition of the production term (Lin Reference Lin1954). The production term is non-zero above the interface, as expected from the Miles instability. A Kelvin–Helmholtz instability should be associated with a positive production term on both sides of the interface, unlike a critical layer instability. The sign of
 $P$
is also well correlated to the variation of the height
 $A_{\unicode[STIX]{x1D702}}$
of the waves (figure 9
a): the height of the wave increases when
 $P$
is positive and, reciprocally, it decreases when
 $P$
becomes negative. Thus, the height variation of the interface disturbance is consistent with the local energy transfers.
From the production term
 $P$
and the kinetic energy of the wave
 $e=\langle u_{x}^{\prime 2}+u_{z}^{\prime 2}\rangle /2$
, an estimation of the energy transfer rate
 $\unicode[STIX]{x1D70E}$
of the wave is possible with
 $\unicode[STIX]{x1D70E}=P/(2e)$
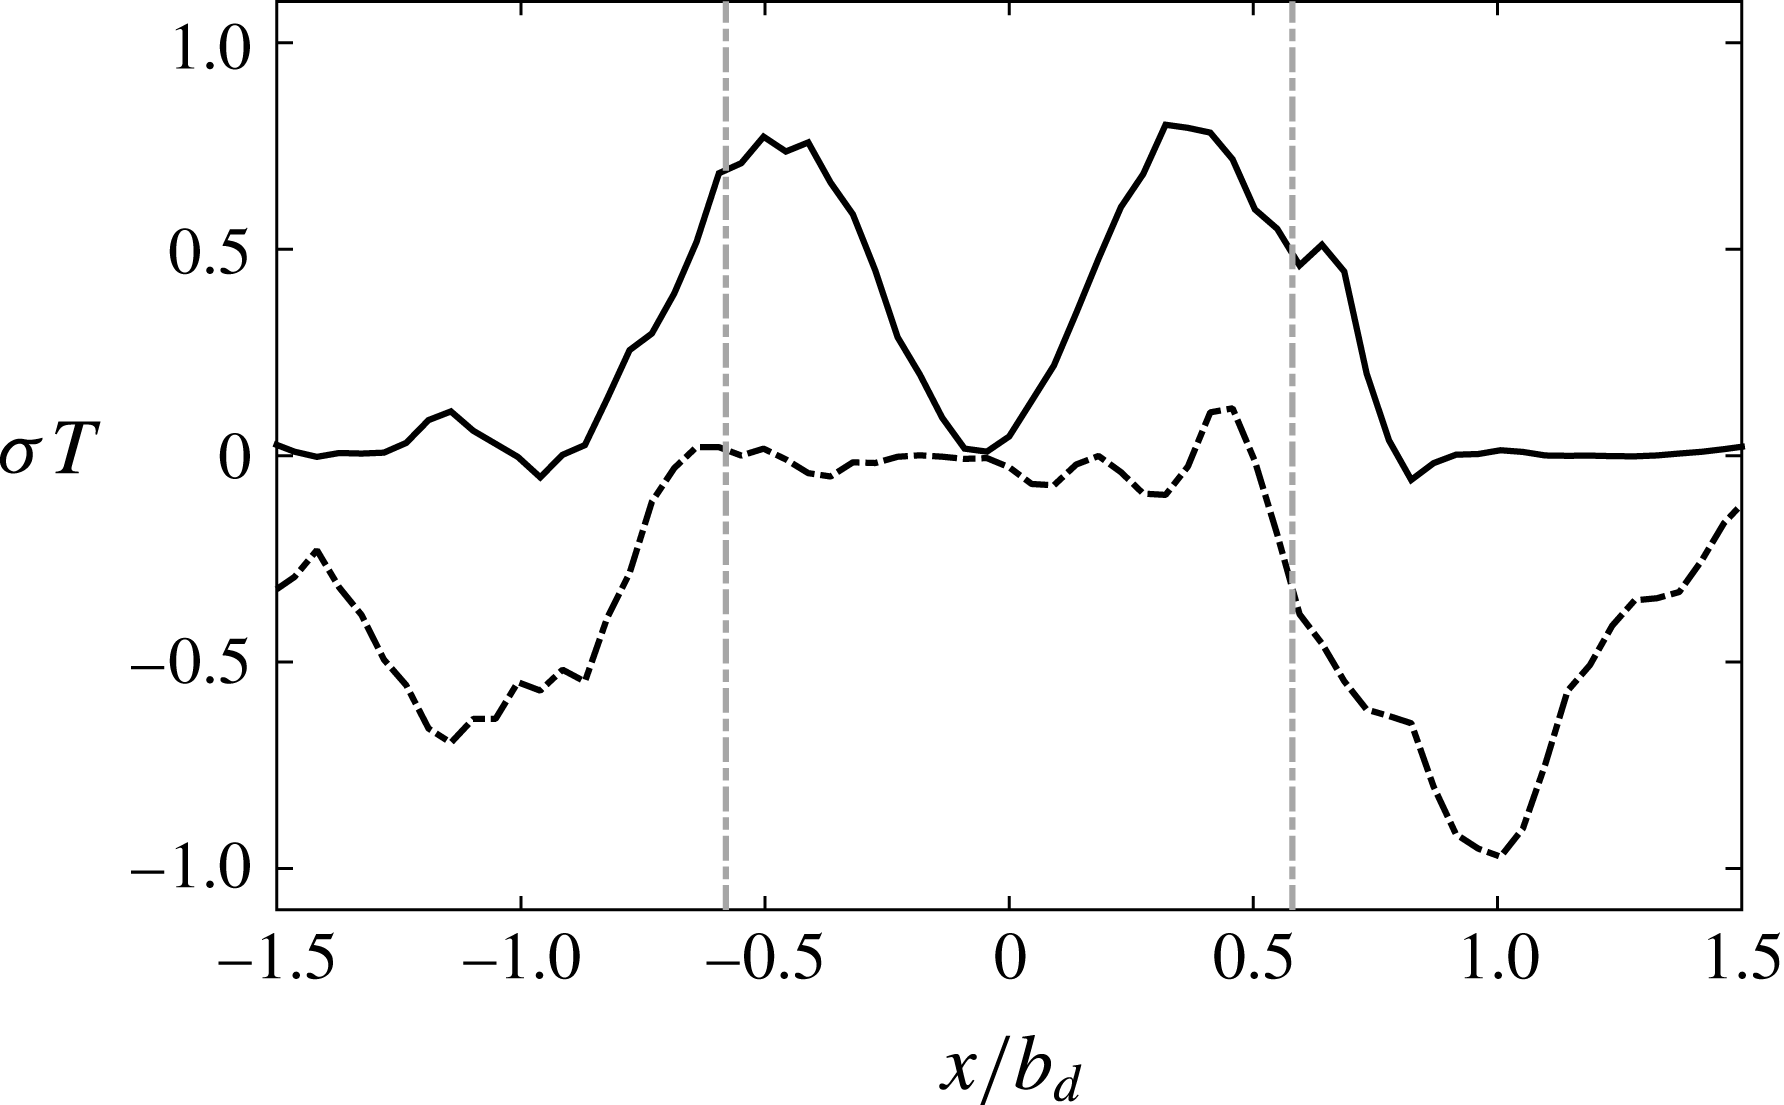
. We report the maxima (full black line) and the minima (dashed black line) of the dimensionless energy transfer rate
 $\unicode[STIX]{x1D70E}T$
for all heights
 $z$
in the dome as a function of
 $x/b_{d}$
in figure 14. We clearly observe that the waves are amplified, with
 $\unicode[STIX]{x1D70E}>0$
, in the region
 $|x|<0.6b_{d}$
, and they are significantly damped, with
 $\unicode[STIX]{x1D70E}<0$
, for
 $|x|>0.6b_{d}$
. The grey lines correspond to the abscissa
 $x=\pm 0.58b_{d}$
where the waves may propagate more slowly than the mean flow. Once again, the transition between amplification process and damping process occurs in the region where the waves cross the critical layer. The positive energy transfer rate reaches the value
 $0.8T^{-1}$
at
 $x=0.34b_{d}$
and the damping rate reaches the value
 $-0.95T^{-1}$
for
 $x=b_{d}$
. Our results show that the amplification mechanism shares features with the Miles instability. It strongly suggests the presence of a critical layer that amplifies the waves generated by the eddies from the jet.
We have shown in the previous section that the waves are generated by the eddies of the jet and not by an instability. This could seem contradictory to the present section, which aims to demonstrate the presence of an instability. However, the two mechanisms are complementary: the turbulence excites the waves and the instability amplifies them. It is a scenario similar to the ocean wave generation mechanism. The opposite scheme may be addressed, i.e. the waves are triggered by the instability and amplified by the turbulence. However, it is not very likely that the Miles instability may trigger a wave on a distance comparable to the half-wavelength. For the last point, Phillips (Reference Phillips1957) has considered the wave amplification by a resonance between the turbulent pressure field and the waves. Miles (Reference Miles1960) has shown that this process is strongly enhanced by the Miles instability. Thus, once the wave is triggered, the energy transfer from the mean flow should be significantly larger than the energy coming from the turbulent fluctuations.
Maxima (full line) and minima (dashed line) of the dimensionless energy transfer rate
 $\unicode[STIX]{x1D70E}=P/(2E)$
rescaled by the wave period
 $T$
, where
 $P$
is the production term and
 $E$
the kinetic energy, for all heights
 $z$
in the dome as a function of
 $x/b_{d}$
. The grey lines correspond to the abscissa
 $x=\pm 0.58b_{d}$
where the waves may propagate more slowly than the mean flow.

4.5 Wave breaking
We now focus on the wave breaking occurring in the region
 $0.6<|x/b_{d}|<1$
. In this area, different elements may explain the wave breaking. The breaking is generally triggered when the wave height crosses a critical amplitude. This is quantified by the wave steepness, which is defined by the product of the wavenumber
 $k_{0}$
and the height
 $A_{\unicode[STIX]{x1D702}}$
. In the breaking region, we observe that the steepness becomes close to the critical steepness of the wave. To calculate the steepness, we consider the maximum height of the wave (dotted curve indexed by total in figure 9
a), which reaches the value
 $A_{\unicode[STIX]{x1D702}}^{max}\simeq 0.56\unicode[STIX]{x1D709}$
with
 $\unicode[STIX]{x1D709}\simeq 0.8$
cm, i.e.
 $A_{\unicode[STIX]{x1D702}}^{max}=0.45$
cm, for the run M2 (table 1). The maximum steepness based on the smallest wavenumber
 $k=0.5k_{0}$
, where
 $k_{0}=2\unicode[STIX]{x03C0}/b_{d}$
(run M2, see table 1), is
 $kA_{\unicode[STIX]{x1D702}}^{max}\simeq 0.35$
, a value in the range of wave breaking criteria
 $kA_{\unicode[STIX]{x1D702}}^{max}\in [0.3{-}0.4]$
for ocean waves (Babanin Reference Babanin2011). Moreover, the profile of
 $U_{t}$
becomes much steeper for
 $|x|>0.6b_{d}$
(figure 4
b). The associated local Richardson numbers (inset in figure 10) are of order unity in this region, which may lead to a destabilization of the wave by a shear instability. It is difficult to disentangle the different effects, which can of course interact with one another (Banner & Song Reference Banner and Song2002).
After the breaking region just above the interface (figure 6
a for
 $x\in [4,6]$
cm and
 $h_{0}-z\in [1,3]$
cm), we observe an area of mixed fluid with a relative density
 $\hat{\unicode[STIX]{x1D70C}}$
varying between
 $0.4$
and
 $0.2$
. It shows that the breaking has already induced mixing. Indeed, wave breaking is believed to be the main mechanism of mixing at low Froude number (Fernando Reference Fernando1991; Fernando & Hunt Reference Fernando and Hunt1996). The mixed fluid is then transported upstream, following the streamlines (figure 3). Figure 5(a) shows that the mixing continues at the frontier of the jet, where the turbulent intensity is expected to be important (List Reference List1982). Owing to the lateral entrainment of the jet (§ 3.2), part of the mixed fluid is directly injected inside the turbulent jet.
4.6 Remarks on the length and time scales
We have studied the different properties of the generation, amplification and breaking of waves in the previous sections. These different mechanisms take place on a distance, i.e. the width of the dome, comparable to the wavelength of the wave. In the framework of the Miles instability, the long-wavelength perturbations are the most unstable (Miles Reference Miles1957; Morland & Saffman Reference Morland and Saffman1993; Drazin & Reid Reference Drazin and Reid2004). This mechanism could explain the observed large wavelengths in our confined geometry. From the Lagrangian point of view, the waves are generated and destroyed on time scales comparable to their period of oscillation. Figure 14 confirms that the evaluated energy transfer rate between the waves and the mean flow is close to the frequency of the wave. Unlike classical studies of wave propagation, the times and length scales are not well decoupled, which is a limitation of the local study of the stability of the interface.
Our study shows that the wavelength, frequency and growth rate of the waves are determined by the forcing and the amplification mechanisms. In § 4.4, we have shown that the two mechanisms are not independent: the perturbations propagating towards the dome oscillate at the wave frequency. A possible explanation is the existence of a global mode, coupling the dynamics of the interface and the flow outside the dome. The limitation of our local study may be due to the interpretation of a global mode in terms of local perturbations. More work is needed for the theoretical analysis of the observed results, but we think the basic physical processes are correctly described here.
5 A scaling law for the entrainment rate
5.1 The scaling law
In the previous sections, we have demonstrated that the erosion of the dense bottom layer is related to the dynamics of gravity interfacial waves. We want to address in this section the scaling law for the erosion rate as a function of the Froude number, given by (1.1), based on our observations. Linden (Reference Linden1973), Cotel & Breidenthal (Reference Cotel and Breidenthal1996) and Shrinivas & Hunt (Reference Shrinivas and Hunt2014) have suggested different physical arguments for this scaling law, leading to
 $E_{i}\sim Fr_{i}^{3}$
for the first two and
 $E_{i}\sim Fr_{i}^{2}$
for the last. These models have not considered mechanisms involving waves for the erosion process. It is worth noting that, as mentioned in Linden (Reference Linden1973, footnote on p. 476), Dr E. J. Hinch has suggested a mechanism involving interfacial gravity waves. Based on the data of Baines (Reference Baines1975) and Baines et al. (Reference Baines, Corriveau and Reedman1993), the entrainment rate should follow a
 $Fr_{i}^{3}$
scaling law at low Froude number and a linear scaling law at large Froude number.
The dimensionless entrainment rate, defined in (1.1), varies with the ratio of the interface erosion velocity
 $u_{e}$
to the jet impinging velocity
 $u_{i}$
(Cotel & Breidenthal Reference Cotel and Breidenthal1996),
 $$\begin{eqnarray}\frac{u_{e}}{u_{i}}\sim \frac{l_{e}\,f_{e}}{u_{i}},\end{eqnarray}$$
where
 $l_{e}$
and
 $f_{e}$
are the typical length and frequency associated with the erosion process. As we consider waves amplified by an instability mechanism,
 $l_{e}$
is related to the relative length over which the amplification takes place, and
 $f_{e}$
to the frequency of the wave perturbation. We have shown that the waves are triggered by the eddies in the jet with a time scale comparable to the buoyancy frequency, i.e.
 $f_{e}=\sqrt{g^{\prime }/b_{i}}$
. We choose the length
 $l_{e}$
as the distance
 $l$
travelled by the wave inside the dome minus the dome radius, i.e.
 $l_{e}=l-b_{d}$
. The waves exchange energy with the mean flow during the propagation along the distance
 $l$
(§ 4.4). Hence, all the steps leading to the breaking of the waves take place on this distance.
The rescaled length
 $(l-b_{d})/b_{d}$
corresponds to the distance travelled by a disturbance in excess of one wavelength, where the wavelength is assumed to be almost equal to the dome radius
 $b_{d}$
(see § 4.2). Length
 $l_{e}$
is also a ‘useful’ length in the sense that it is the region where amplification occurs. For
 $Fr_{i}\rightarrow 0$
, no interface distortion, no mean acceleration hence no wave amplification, then no breaking and no erosion are expected in our model based on interfacial gravity waves. This mathematical regularization, preventing the divergence of
 $E_{i}$
for small Froude numbers, is supported by the observation of Cotel et al. (Reference Cotel, Gjestvang, Ramkhelawan and Breidenthal1997). They reported a constant erosion rate
 $E_{i}$
for
 $Fr_{i}<0.14$
when the interface is almost flat. Thus, we construct the length
 $l_{e}$
so that
 $E_{i}$
goes towards zero when the interface becomes flat, a regime not considered here. Hence, our model quantifies the departure from the flat interface, as we will see further.
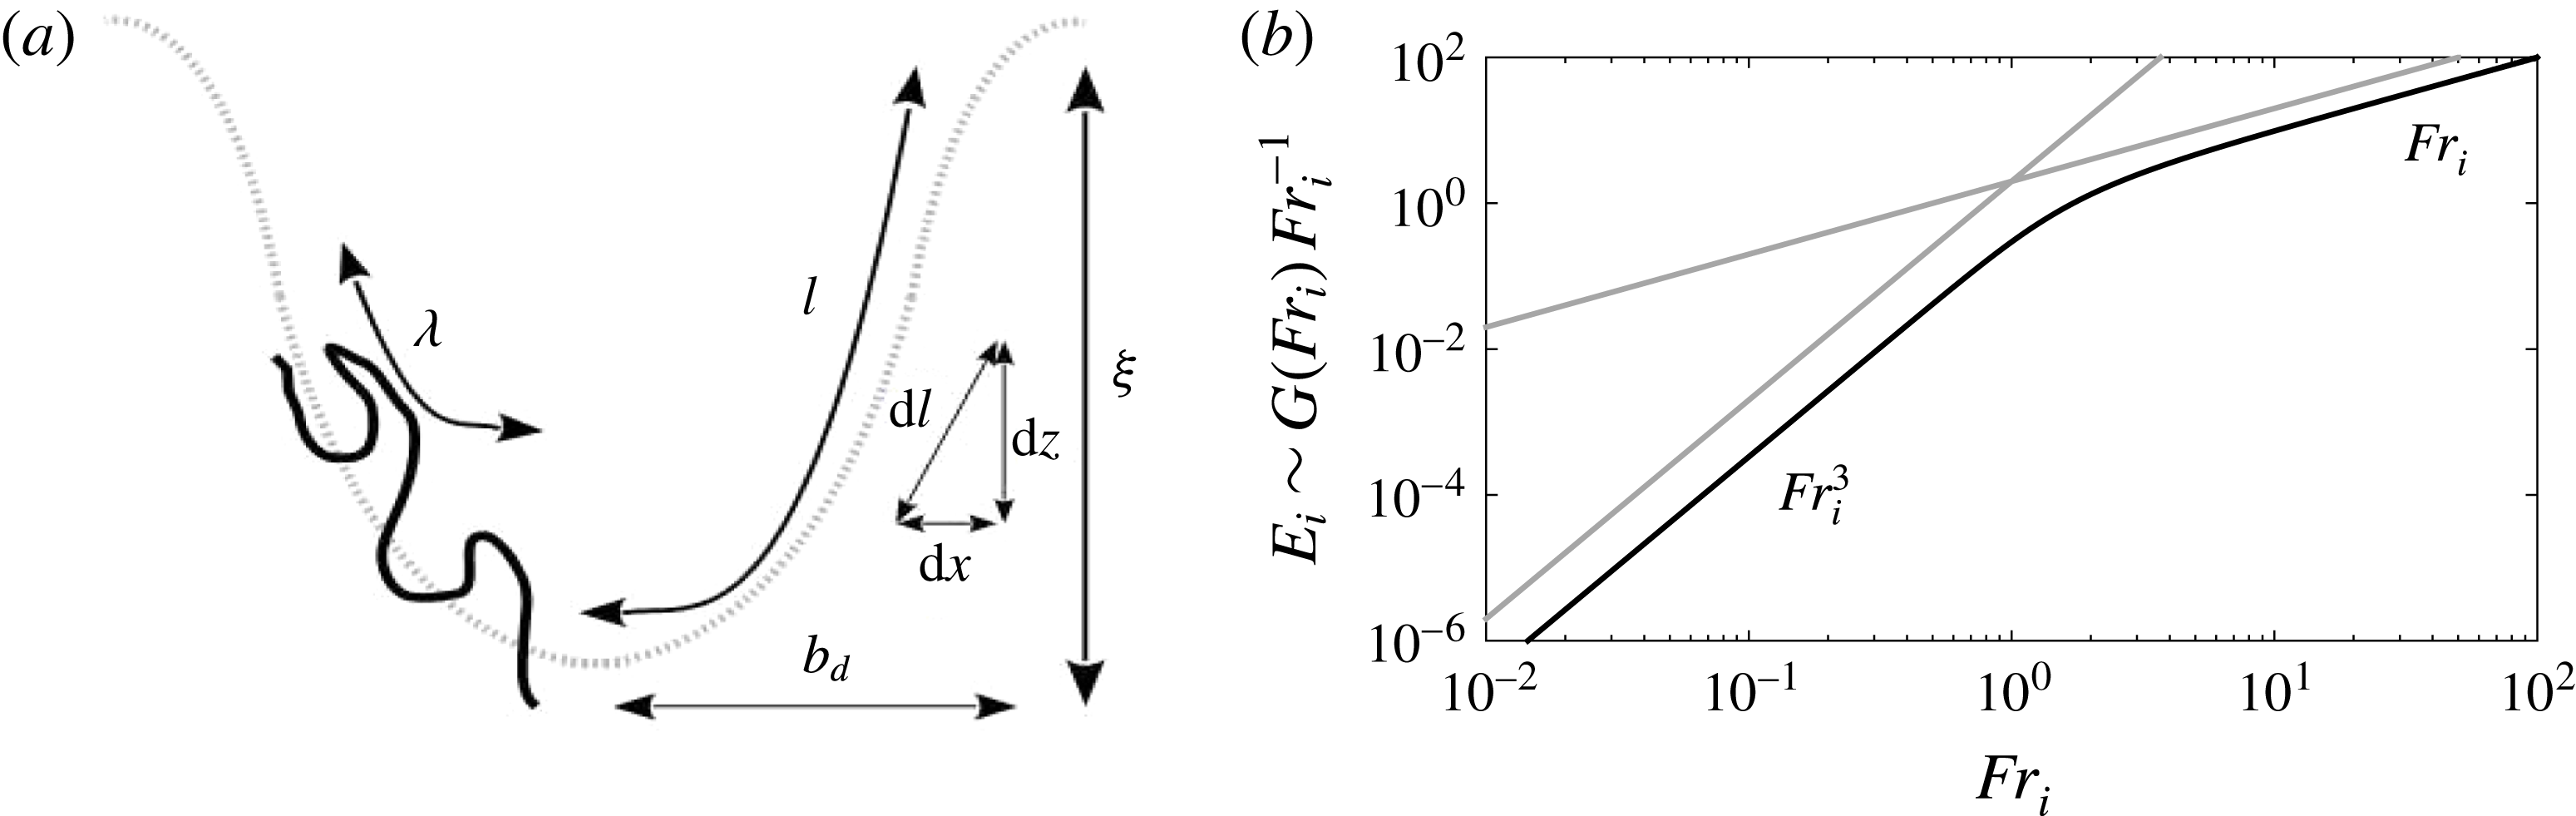
The infinitesimal length
 $\text{d}l$
travelled by the wave in an interval
 $\text{d}x$
is
 $\text{d}l=\sqrt{\text{d}z(x)^{2}+\text{d}x^{2}}$
(figure 15
a), and the total length
 $l$
is
 $$\begin{eqnarray}l=\int _{x=0}^{b_{d}}\left[\sqrt{\left(\frac{\text{d}\langle h\rangle }{\text{d}x}\right)^{2}+1}\,\right]\,\text{d}x,\end{eqnarray}$$
with
 $\langle h\rangle (x)$
the depth of the dome as a function of
 $x$
. Our measurements show that
 $\langle h\rangle (x)=\unicode[STIX]{x1D709}(x/b_{d})^{2}$
, with
 $\unicode[STIX]{x1D709}$
the depth of the dome. By using the change of variable
 $x=ub_{d}$
, the integral becomes
 $$\begin{eqnarray}l=b_{d}\int _{0}^{u=1}\left[\sqrt{(\unicode[STIX]{x1D716}u)^{2}+1}\right]\text{d}u,\end{eqnarray}$$
with
 $\unicode[STIX]{x1D716}=2\unicode[STIX]{x1D709}/b_{d}$
. Integration gives
 $$\begin{eqnarray}l=\frac{b_{d}}{2}\left[\sqrt{\unicode[STIX]{x1D716}^{2}+1}+\frac{\sinh ^{-1}\unicode[STIX]{x1D716}}{\unicode[STIX]{x1D716}}\right],\end{eqnarray}$$
with
 $\sinh ^{-1}$
the inverse of the hyperbolic sine. We assume that the dome radius
 $b_{d}$
varies linearly with the radius of the jet
 $b_{i}$
. An energy balance between the mean flow of the jet and the potential energy stored in the dome shows that
 $\unicode[STIX]{x1D716}=2\unicode[STIX]{x1D709}/b_{d}\sim Fr_{i}^{2}$
, confirmed by the measurements of Shy (Reference Shy1995). It follows that for low Froude number
 $Fr_{i}\ll 1$
,
 $\unicode[STIX]{x1D716}$
goes towards zero and the length
 $l_{e}$
follows the asymptote
 $$\begin{eqnarray}\frac{l_{e}}{b_{i}}\sim \frac{l-b_{d}}{b_{d}}\sim \unicode[STIX]{x1D716}^{2}\sim Fr_{i}^{4}.\end{eqnarray}$$
At large Froude number with
 $\unicode[STIX]{x1D716}\gg 1$
, the length varies like
 $$\begin{eqnarray}\frac{l_{e}}{b_{i}}\sim \unicode[STIX]{x1D716}\sim Fr_{i}^{2}.\end{eqnarray}$$
Finally, the entrainment rate is given by
 $$\begin{eqnarray}E_{i}\sim \frac{l_{e}}{b_{i}}\frac{\sqrt{g^{\prime }b_{i}}}{u_{i}}\sim \frac{l_{e}}{b_{i}}Fr_{i}^{-1},\end{eqnarray}$$
and our model recovers both asymptotic behaviours as a function of the Froude number (figure 15 b):
 $$\begin{eqnarray}E_{i}\sim \left\{\begin{array}{@{}ll@{}}Fr_{i}^{3} & \text{for }Fr_{i}\ll 1,\\ Fr_{i} & \text{for }Fr_{i}\gg 1.\end{array}\right.\end{eqnarray}$$
(a) Schematic and notation for the model of entrainment. (b) Entrainment rate as a function of the Froude number given by (5.7). The grey curves show the
 $Fr_{i}^{3}$
power law valid at low Froude number and the linear scaling
 $Fr_{i}$
valid at large Froude numbers.

More generally, using (5.4), we define the parametrization of the entrainment rate,
 $$\begin{eqnarray}E_{i}=\unicode[STIX]{x1D6FC}Fr_{i}^{-1}G(\unicode[STIX]{x1D6FD}Fr_{i}^{2}),\end{eqnarray}$$
with
 $G$
the function
 $$\begin{eqnarray}G(\unicode[STIX]{x1D716})=\frac{1}{2}\left[\sqrt{\unicode[STIX]{x1D716}^{2}+1}+\frac{\sinh ^{-1}\unicode[STIX]{x1D716}}{\unicode[STIX]{x1D716}}\right]-1.\end{eqnarray}$$
This parametrization is fully defined by the two real constants
 $(\unicode[STIX]{x1D6FC},\unicode[STIX]{x1D6FD})$
. In particular, the coefficient
 $\unicode[STIX]{x1D6FD}$
characterizes the cross-over point
 $Fr_{t}=\unicode[STIX]{x1D6FD}^{-1/2}$
, where the scaling law varies from its two asymptotes
 $Fr_{i}^{3}$
and
 $Fr_{i}$
.
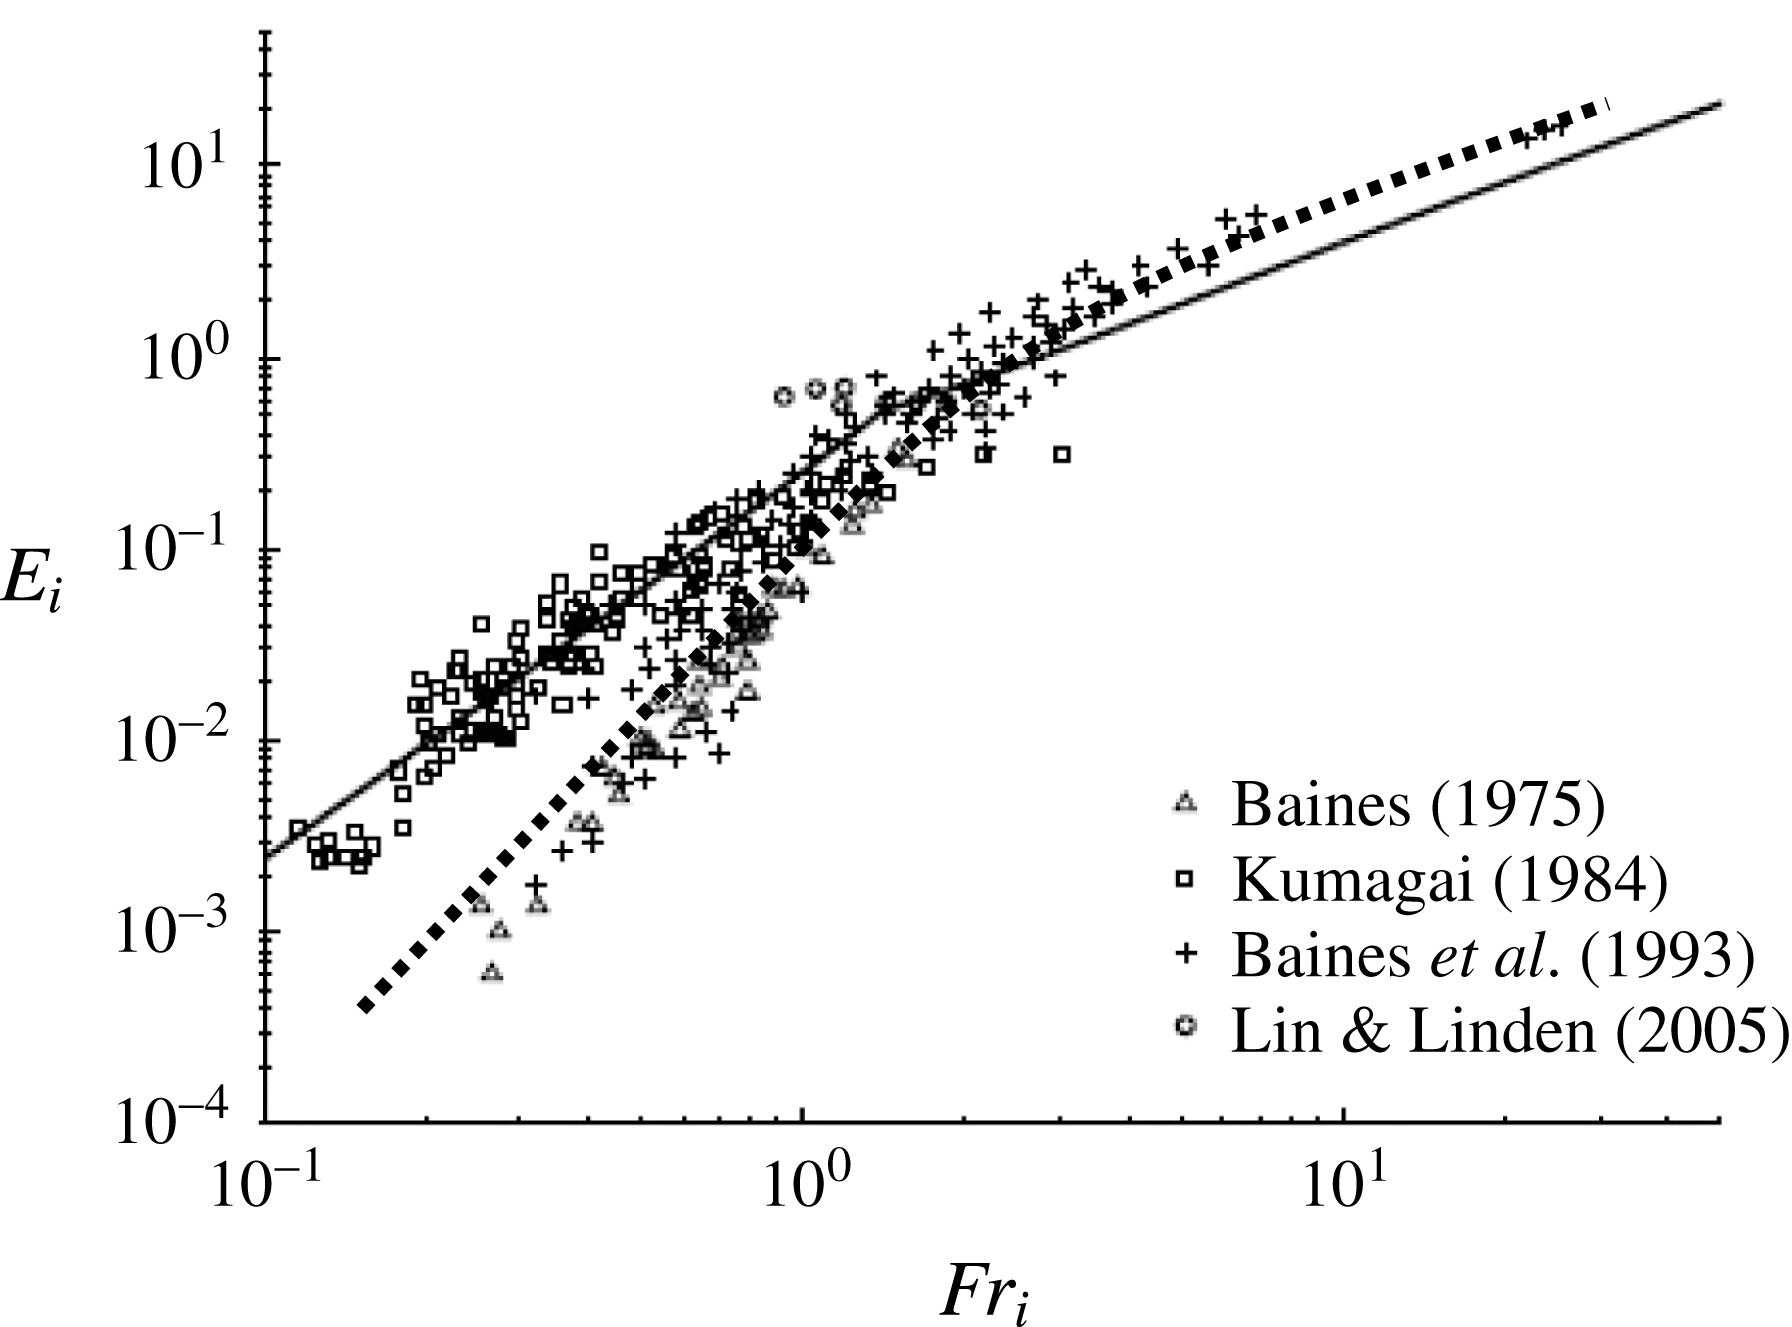
We now compare our model to the entrainment rate measured in different processes of erosion (buoyant jets and plumes). We use figure 12(a) from Shrinivas & Hunt (Reference Shrinivas and Hunt2014), which contains the measurements of Baines (Reference Baines1975, triangles), Kumagai (Reference Kumagai1984, squares), Baines et al. (Reference Baines, Corriveau and Reedman1993, crosses) and Lin & Linden (Reference Lin and Linden2005, circles). We have reported the curve defined by (5.9) with
 $(\unicode[STIX]{x1D6FC},\unicode[STIX]{x1D6FD})=(1.5,0.45)$
in figure 16 (dotted curve). These parameters are chosen so that the curve passes close to the experimental points of Baines (Reference Baines1975, triangles), Baines et al. (Reference Baines, Corriveau and Reedman1993, crosses) and Lin & Linden (Reference Lin and Linden2005, circles). The value of the coefficient
 $\unicode[STIX]{x1D6FD}$
defines the cross-over point occurring at
 $Fr_{t}=1.49$
. The agreement is good between the theory and the experimental data.
Modified figure from Shrinivas & Hunt (Reference Shrinivas and Hunt2014, their figure 12a). The dotted line corresponds to the scaling law defined by (5.9). The black lines correspond to the scaling law
 $E_{i}=0.24Fr_{i}^{2}$
for small Froude numbers and
 $E_{i}=0.42Fr_{i}$
for large Froude number, as suggested by Shrinivas & Hunt (Reference Shrinivas and Hunt2014).

5.2 Data of Kumagai
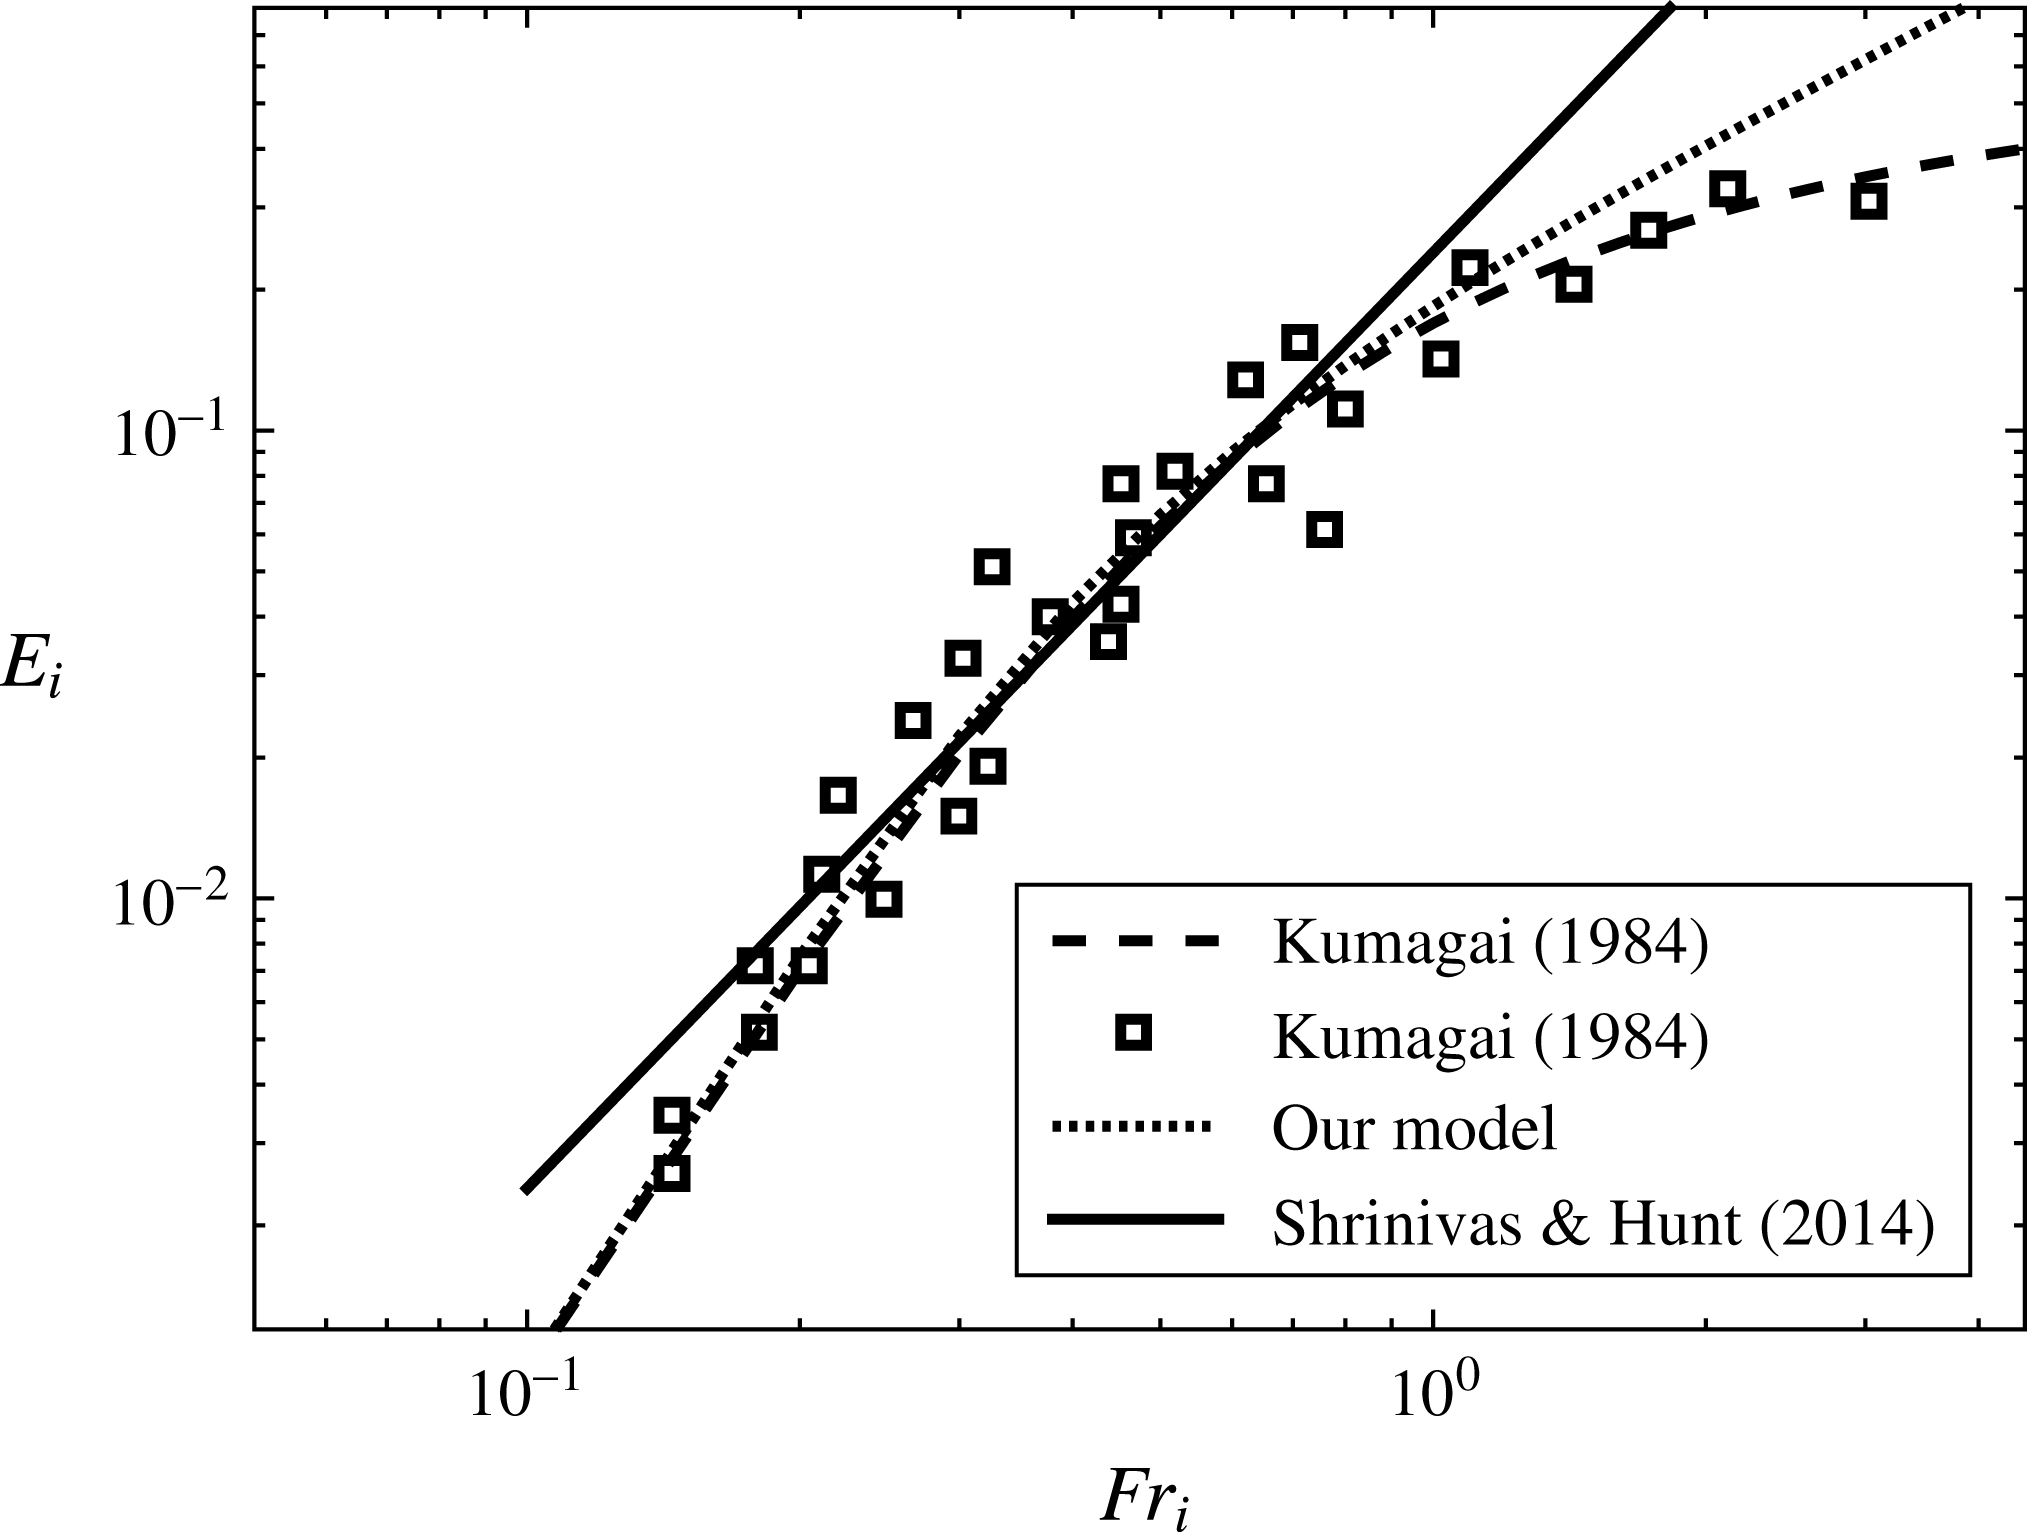
In figure 16, the data of Kumagai (Reference Kumagai1984) (upper branch) display a different trend relative to the measurements of Baines (Reference Baines1975), Baines et al. (Reference Baines, Corriveau and Reedman1993) and Lin & Linden (Reference Lin and Linden2005) (lower branch). The entrainment rate is approximately one order of magnitude larger than the other measurements. The exponent
 $n$
of the erosion scaling law on this branch has been debated. Kumagai (Reference Kumagai1984) initially proposed
 $n=3$
(small-Froude-number asymptote of the dashed curve, figure 17), compatible with our parametrization described above. But Cardoso & Woods (Reference Cardoso and Woods1993) and Shrinivas & Hunt (Reference Shrinivas and Hunt2014) suggested
 $n=2$
(full line, figure 17), based on a baroclinic-type instability. Owing to the scattering of the data, it is difficult to decide between the two models.
As a matter of fact, the existence of this upper branch may be interpreted in two different ways. Either
 $n=2$
, meaning that two different physical mechanisms operate between the lower and upper branches, as suggested in Shrinivas & Hunt (Reference Shrinivas and Hunt2015). Or
 $n=3$
, meaning that the same physical mechanism operates on the two branches. In the context of our model, this would simply mean that the upper branch is distinct because the coefficients in (5.9),
 $\unicode[STIX]{x1D6FC}$
and
 $\unicode[STIX]{x1D6FD}$
, vary with the conditions of the experiments (confinement, buoyancy, …). Indeed, our model is based on the deformation of the interface, and, when it is weakly deformed, the entrainment rate follows a scaling law
 $Fr_{i}^{3}$
for
 $Fr_{i}<Fr_{t}$
. The coefficient
 $\unicode[STIX]{x1D6FD}$
determines the transition between a weakly deformed interface, when the width of the dome is larger than its depth, and a strongly deformed interface, when the width is significantly smaller than the depth. This transition should depend not only on the confinement, but also on the nature of the jet (buoyant or not). Hence, the scatter of the measurements may be explained by a modification of the prefactors
 $(\unicode[STIX]{x1D6FC},\unicode[STIX]{x1D6FD})$
, where
 $\unicode[STIX]{x1D6FD}$
characterizes the efficiency of the turbulent flow in deforming the interface. But, again, the physics of the erosion, dominated by breaking interfacial waves excited by the turbulent fluctuations and amplified by the mean flow may remain the same.
The black squares are 30 values from Kumagai (Reference Kumagai1984, figure 12). The dashed curve corresponds to the empirical model of Kumagai (Reference Kumagai1984). The full line is the scaling law established by Shrinivas & Hunt (Reference Shrinivas and Hunt2014) with
 $E_{i}=0.24Fr_{i}^{2}$
. The dotted curve corresponds to (5.9) with
 $(\unicode[STIX]{x1D6FC},\unicode[STIX]{x1D6FD})=(0.015,14)$
, associated with a cross-over point at
 $Fr_{t}=0.27$
.

The curve corresponding to the data of Kumagai (Reference Kumagai1984) suggests that the transition between the behaviour at small and large Froude numbers occurs earlier compared to the lower branch. We have reported some values of the entrainment rate as a function of the Froude number (black squares) from Kumagai (Reference Kumagai1984, figure 12) in figure 17. We observe a transition around
 $Fr_{t}\in [0.25{-}0.35]$
in the upper branch (figure 17) whereas the lower branch is characterized by
 $Fr_{t}=1.49$
(figure 16). Three models are reported in figure 17: the dashed curve corresponds to the empirical model of Kumagai (Reference Kumagai1984), the full line is the scaling law
 $E_{i}=0.24Fr_{i}^{2}$
from Shrinivas & Hunt (Reference Shrinivas and Hunt2014) and the dotted line is given by (5.9) with
 $(\unicode[STIX]{x1D6FC},\unicode[STIX]{x1D6FD})=(0.015,14)$
, with a cross-over point at
 $Fr_{t}=0.27$
. Our model follows the model of Kumagai (Reference Kumagai1984) up to
 $Fr_{i}\simeq 1$
. Once again, the set of data is not sufficient to determine which model is the best, even if we recover the empirical model of Kumagai (Reference Kumagai1984). However, it shows that one possible origin of the upper branch is a modification of the prefactors between the experiments.
6 Conclusion
In the present paper, we have investigated the mechanism of entrainment by a turbulent jet impinging onto a density interface with moderate Reynolds and Froude numbers. In this regime, the vortices coming from the jet are not able to deform significantly the interface via ballistic impacts, as commonly expected by previous models involving baroclinic turbulence inside the dome. Their role is reduced to trigger interfacial gravity waves. The main source of energy comes from the mean flow, which amplifies the perturbation of the interface by a mechanism of wave-induced stress. The sign of the Reynolds stress changes abruptly inside the dome, where the phase velocity of the wave and the mean velocity field are equal. It suggests the presence of a resonance between the wave and the mean flow. Wave amplification leads to wave breaking in the vicinity of the border of the impinged region. The induced mixing is responsible for the irreversible erosion of the interface.
Our measurements bring new insights into the respective contributions of the baroclinic and barotropic mechanisms for mixing. In previous experiments (Shy Reference Shy1995; Cotel et al.
Reference Cotel, Gjestvang, Ramkhelawan and Breidenthal1997), the persistence of vortical structures observed around the interface has been attributed to a localized baroclinic torque. However, we show here that the coherence could be explained without invoking baroclinic mechanisms. The interaction between eddies coming from the jet and interfacial gravity waves leads to a well-identified signature of the wave in the upstream jet. The coherence relies on a global mechanism, which selects the wave pattern in the impinged region. This observation supports the model of Linden (Reference Linden1973), who suggested that the interaction between barotropic vortices and the interface plays a central role in the entrainment process. Before the wave destabilization, the amplification of the interface disturbances by wave-induced stress is correlated to the intensification of barotropic vortices, as long as the interface remains sharp. Thus, interface gravity waves are initially weakly affected by baroclinic mechanisms and behave like surface gravity waves (dispersion relation, amplification mechanism). Then, the large wave steepness leads to wave folding, and the baroclinic mechanisms are then triggered by wave rolling. This scenario differs noticeably from the previous models, where the baroclinic generation of vorticity is produced in a thin layer, all along the interface, by a steady baroclinic torque proportional to
 $(\unicode[STIX]{x1D735}\bar{p}\times \unicode[STIX]{x1D735}\bar{\unicode[STIX]{x1D70C}})/\bar{\unicode[STIX]{x1D70C}}$
(Shy Reference Shy1995; Shrinivas & Hunt Reference Shrinivas and Hunt2014). The two approaches could be equivalent since our model focuses on a succession of single waves amplified by barotropic mechanisms and the scenario reported in Shrinivas & Hunt (Reference Shrinivas and Hunt2014) relies on a mean-field model describing a quasi-steady process. This apparent paradox could be solved by investigating carefully the energy transfers between the mean field and the disturbances. Numerical simulations should be more suited to measuring the pressure fields and studying these energy transfers.
Based on these physical observations, we have introduced a scaling law that varies continuously from
 $Fr_{i}^{3}$
to
 $Fr_{i}$
power laws from small to large Froude numbers, in agreement with some of the previous experimental measurements. Our model offers an alternative to Shrinivas & Hunt (Reference Shrinivas and Hunt2015): we suggest that the scatter of the measurements of the entrainment rate is due to a difference between the prefactors of the scaling law rather than a modification of the exponents.
Our measurements are performed for Reynolds numbers below the mixing transition, i.e.
 $Re<10^{4}$
. It will be interesting to investigate the mechanism of erosion at moderate Froude number and larger Reynolds numbers (
 $Re>10^{4}$
), in order to verify if the present mechanism still operates or if other processes occur. For larger Reynolds numbers, the vortices impinging the stratification may be able to generate baroclinic vortices and turbulence at the interface, as suggested by Shy (Reference Shy1995). The presence of turbulence may also affect the coherence of the interfacial gravity waves, leading to the suppression of wave-induced stress. The erosion of the stratification might then be well described by the model based on stationary baroclinic vorticity, presented in Shrinivas & Hunt (Reference Shrinivas and Hunt2014).
Acknowledgements
The authors wish to thank the three anonymous referees for their comments and F. Duval (LIE, IRSN) and J. M. Ricaud (LIE, IRSN) for stimulating discussions. They acknowledge the support from the Institut de Radioprotection et de Sûreté Nucléaire and from the region PACA (France) under the APEX programme 2015 (Project S2URF). G.F. acknowledges the support of the A*MIDEX grant (ANR-11-IDEX-0001-02) funded by the French Government ‘Investissements d’Avenir’ programme.
Supplementary movie
A supplementary movie is available at https://doi.org/10.1017/jfm.2017.891.