Research on second language (L2) fluency has begun to investigate the relationship between first language (L1) and L2 fluency behavior in an effort to understand whether fluency is an underlying trait of a speaker or a language specific state (De Jong, Groenhout, Schoonen, & Hulstijn, Reference De Jong, Groenhout, Schoonen and Hulstijn2015; Derwing, Munro, Thomson, & Rossiter, Reference Derwing, Munro, Thomson and Rossiter2009; Riazantseva, Reference Riazentseva2001; Towell & Dewaele, Reference Towell, Dewaele and Dewaele2005; Towell, Hawkins, & Bazergui, Reference Towell, Hawkins and Bazergui1996). Exploring this relationship is important because it not only provides evidence for the development of speech production models by helping to determine answers to questions such as how much of L2 fluency behavior can be attributed to L1 fluency behavior (Segalowitz, Reference Segalowitz2010) but also has practical applications for language assessment in that knowing whether L1 and L2 fluency behavior are related may provide the necessary justification for correcting L2 fluency measures for L1 speaking style (De Jong et al., Reference De Jong, Groenhout, Schoonen and Hulstijn2015; Ginther, Dimova, & Yang, Reference Ginther, Dimova and Yang2010).
Thus far, the limited research from this line of inquiry has produced complicated results. Overall, however, the findings appear to suggest that the relationship between L1 and L2 fluency behavior may be mitigated by at least three main factors: (a) cross-linguistic similarities and differences between the languages under investigation (e.g., measurements of speed fluency can be confounded with phonotactics/morphology; different languages may evidence different pausing behavior patterns; De Jong et al., Reference De Jong, Groenhout, Schoonen and Hulstijn2015; Derwing et al., Reference Derwing, Munro, Thomson and Rossiter2009; Riazantseva, Reference Riazentseva2001); (b) changes in L2 proficiency (e.g., the relationship between L1 and L2 fluency behavior may change as learners’ proficiency increases; Derwing et al., Reference Derwing, Munro, Thomson and Rossiter2009; Riazantseva, Reference Riazentseva2001; Towell & Dewaele, Reference Towell, Dewaele and Dewaele2005); and (c) a combination of the above (e.g., lower proficiency learners may benefit more from cross-linguistic similarities than if the L1 and the L2 are more different; Derwing et al., Reference Derwing, Munro, Thomson and Rossiter2009). If cross-linguistic differences, proficiency, and L1 fluency behavior together contribute to L2 fluency behavior, then it is likely the case that different populations studied will result in different findings if these factors are not considered in conjunction.
The current study contributes to our understanding of L2 fluency behavior by investigating the extent to which L1 fluency behavior, cross-linguistic differences, and proficiency predict L2 fluency behavior over time. Oral data were collected from two groups of temporary sojourners (English L1) who were residing abroad either in a French (n = 25) or a Spanish-speaking (n = 24) country as part of a university exchange program (i.e., a form of study abroad). Data were collected twice in the L2 and once in the L1. Two additional L1 groups (French and Spanish) completed the tasks in their native language to allow for cross-linguistic comparisons of utterance fluency measures across the three languages. The relationship between the participants’ L1 and L2 fluency behavior is compared both before and after 5 months’ residence abroad, a period in which it is demonstrated that they also significantly improve in their L2 proficiency and L2 fluency. Finally, all of these variables are analyzed together to examine to what extent the predictive power of each variable changes over time.
DEFINING FLUENCY
Fluency as a term can have both a broad and a narrow definition (Lennon, Reference Lennon1990). Whereas a broad definition of fluency can be equated to general proficiency, a narrow definition is concerned with the “temporal aspects of oral production that influence the degree of fluidity in speech (e.g., pauses, hesitation phenomena, speech rate)” (Derwing et al., Reference Derwing, Munro, Thomson and Rossiter2009, p. 534). It is this narrow definition that we adopt in the current study. Segalowitz (Reference Segalowitz2010) further differentiates between three types of fluency: (a) cognitive fluency, or the efficacy of one's underlying processing abilities; (b) utterance fluency, or temporal measures of one's oral productions; and (c) perceived fluency, or how listeners judge one's oral productions with regard to fluency. Much of the work in the area of L2 fluency to date has explored aspects of utterance fluency while connecting these temporal measures to (a) perceived fluency and/or L2 proficiency (Baker-Smemoe, Dewey, Bown, & Martinsen, Reference Baker-Smemoe, Dewey, Bown and Martinsen2014; Bosker, Pinget, Quené, Sanders, & De Jong, Reference Bosker, Pinget, Quené, Sanders and De Jong2012; Cucchiarini, Strik, & Boves, Reference Cucchiarini, Strik and Boves2000, Reference Cucchiarini, Strik and Boves2002; Derwing et al., Reference Derwing, Munro, Thomson and Rossiter2009; Ginther, Dimova, & Yang, Reference Ginther, Dimova and Yang2010; Kormos & Dénes, Reference Kormos and Dénes2004; Riazantseva, Reference Riazentseva2001), (b) cognitive fluency (De Jong, Steinel, Florijn, Schoonen, & Hulstijn, Reference De Jong, Steinel, Florijn, Schoonen and Hulstijn2013; Kahng, Reference Kahng2014; Segalowitz & Freed, Reference Segalowitz and Freed2004), (c) task type (Skehan, Reference Skehan2003; Tavakoli & Skehan, Reference Tavakoli, Skehan and Ellis2005), and (d) development (Du, Reference Du2013; Freed, Reference Freed1995; Lennon, Reference Lennon1990; Mora & Valls-Ferrer, Reference Mora and Valls-Ferrer2012; Towell & Dewaele, Reference Towell, Dewaele and Dewaele2005; Towell et al., Reference Towell, Hawkins and Bazergui1996).
Skehan (Reference Skehan2003) and Tavakoli and Skehan (Reference Tavakoli, Skehan and Ellis2005) further subdivided utterance fluency into three types: speed, breakdown, and repair fluency. Speed fluency refers to the rate at which one is able to produce language. Breakdown fluency comprises measures of duration, location, and number of silent and filled pauses. Repair fluency comprises measures of repetitions, corrections, and false starts, among others. Using these subcategories has proved beneficial in understanding utterance fluency and its connections to perceived fluency as well as L2 processing and proficiency. For example, research exploring pausing patterns has demonstrated effects of processing (Kahng, Reference Kahng2014; Pawley & Syder, Reference Pawley, Syder and Riggenbach2000) while other work (Baker et al., Reference Baker-Smemoe, Dewey, Bown and Martinsen2014; Cucchiarini et al., Reference Cucchiarini, Strik and Boves2002; Ginther et al., Reference Ginther, Dimova and Yang2010; Kormos & Dénes, Reference Kormos and Dénes2004) has found that some aspects of utterance fluency are connected to L2 proficiency (speed and breakdown), but not others (repair). Mixed/contradictory findings from this body of work, however, have highlighted the need for consistent operationalization of temporal measures of utterance fluency. Given the possibility that aspects of L2 fluency are influenced in different ways by L1 fluency behavior, cross-linguistic differences, and proficiency, then the use of less confounded, as opposed to more global, measurements of fluency, such as those in De Jong et al. (Reference De Jong, Groenhout, Schoonen and Hulstijn2015), is warranted in the current investigation.
MODELS OF SPEECH PRODUCTION
The work of Levelt (Reference Levelt1989, Reference Levelt, Brown and Hagoort1999) and De Bot (Reference De Bot1992) describing the internal speech production model of an L2 speaker has been influential in contributing to an understanding of what is involved in fluent speech. The model begins at conceptualization, the site of message generation (i.e., the preverbal message), and then moves to formulation, where the original message is formed through grammatical and phonological encoding of lemmas from the lexicon. Finally, the last stage, articulation, is where the phonetic plan is converted to actual speech. Drawing upon this work, Segalowitz (Reference Segalowitz2010) presented an adapted “blueprint” of the L2 speaker, which summarizes the “linguistic, psycholinguistic, and cognitive issues underlying the act of speaking” (p. 8). The model also includes seven “critical points in the architecture,” which can be considered “fluency vulnerability points where processing difficulties might be expected to give rise to L2 dysfluencies” (p. 17). Examples of these include grammatical encoding, lexical encoding, self-monitoring, and so on. One limitation of the model, as acknowledged by Segalowitz (and Levelt and De Bot), is that it does not provide information about development, but rather a picture at a single point in time. However, in order to incorporate such developmental information into the model, it is necessary to first understand the relationship between L1 and L2 fluency, and uncover whether certain aspects of fluency are unique to L2 speech and not the result of individual differences in L1 fluency behavior (De Jong, Schoonen, & Hulstijn, Reference De Jong, Schoonen and Hulstijn2009; Segalowitz, Reference Segalowitz2010). In addition, it might be that the relationship between L1 and L2 fluency changes as L2 proficiency develops and that cross-linguistic differences between the L1 and the L2 mitigate this relationship.
RELATIONSHIP BETWEEN L1 AND L2 FLUENCY
A small body of research has begun to examine the relationship between L1 and L2 fluency (De Jong et al., Reference De Jong, Groenhout, Schoonen and Hulstijn2015; Derwing et al., Reference Derwing, Munro, Thomson and Rossiter2009; Riazantseva, Reference Riazentseva2001; Towell & Dewaele, Reference Towell, Dewaele and Dewaele2005; Towell et al., Reference Towell, Hawkins and Bazergui1996) and has adopted a variety of approaches including (a) comparing group differences between the L1 and L2, and learners and native speakers using analyses of variance (Towell et al., Reference Towell, Hawkins and Bazergui1996), (b) analyzing relationships between L1 and L2 measures using correlations (De Jong et al., Reference De Jong, Groenhout, Schoonen and Hulstijn2015; Derwing et al., Reference Derwing, Munro, Thomson and Rossiter2009; Towell & Dewaele, Reference Towell, Dewaele and Dewaele2005), (c) investigating whether L1 measures can predict L2 measures using linear regressions (De Jong et al., Reference De Jong, Groenhout, Schoonen and Hulstijn2015), and (d) attempting to partial out L1 effects either by conducting analyses of covariance (Towell & Dewaele, Reference Towell, Dewaele and Dewaele2005) or using corrected measures of L2 fluency to predict L2 proficiency (De Jong et al., Reference De Jong, Groenhout, Schoonen and Hulstijn2015). Although results thus far appear to support the notion that L2 fluency relates to L1 fluency (De Jong et al., Reference De Jong, Groenhout, Schoonen and Hulstijn2015; Towell & Dewaele, Reference Towell, Dewaele and Dewaele2005), other variables such as the structural characteristics between the L1 and L2 (De Jong et al., Reference De Jong, Groenhout, Schoonen and Hulstijn2015) and participants’ proficiency appear to mitigate the strength of the relationship (Derwing et al., Reference Derwing, Munro, Thomson and Rossiter2009). In addition, the fact that researchers have used different measures of utterance fluency makes comparisons across studies difficult.
Towell et al. (Reference Towell, Hawkins and Bazergui1996) were the first study to investigate the development of L2 fluency before and after a 6-month stay abroad and then compare aspects of L2 fluency to the same learners’ L1 fluency behavior. Data were collected from 12 English L2 learners of French via a film narration, and three measures of speed fluency and two measures of breakdown fluency were calculated: (a) speaking rate (number of syllables divided by the total time including pauses), (b) articulation rate (number of syllables divided by the total time excluding pauses), (c) mean length of run (average number of syllables produced between silent pauses), (d) phonation time ratio (percent proportion of time spent speaking to time spent to produce the entire sample), and (e) average length of pauses (mean duration of silent pauses). The results showed that learners improved in speed measures (speech rate, articulation rate, and mean length of run) but neither breakdown measure during study abroad. In addition, for those L2 measures that improved, they still “lagged behind” L1 measures (p. 103). Learners were, however, able to approximate L1 fluency in average length of pause. Based on these findings, Towell et al. claimed “that advanced L2 subjects reach a plateau with respect to speaking rate” that is below their L1 (p. 113).
It should be noted, however, that when comparing L2 fluency measures to L1 fluency measures, it is important to consider the effect of cross-linguistic differences. For example, syllable structure and pausing can show considerable variation across languages. Roach (Reference Roach, Bauer and Trudgill1998) argued that when measuring speech rate using syllable counts, the syllable structures of the languages in question will influence the results. English has a wider syllable inventory than Spanish; thus, the number of phones within the syllables produced by an English speaker will most likely be greater than those of a Spanish speaker, and thus it is predicted that the speaking rates of English speakers will be lower than those of Spanish speakers. Pellegrino, Coupé, and Marsico (Reference Pellegrino, Coupé and Marsico2011) found speech rate differences between Spanish and English when calculating the number of syllables per second. Similar results comparing French and German were found in Trouvain and Möbius (Reference Trouvain and Möbius2014); the articulation rate of German speakers was slower than that of French speakers (like English, German has a more complex syllable structure than French). Thus, the different phonotactics of the languages under study in Towell et al. (English L1 and French L2) most likely influenced the plateau found in speaking rate.
Towell et al. (Reference Towell, Hawkins and Bazergui1996) also demonstrated that learners were able to approximate L1 fluency in average length of pause, but without baseline data from French native speakers, it is unknown whether learners were also approximating native speakers and whether pausing characteristics between French and English are similar. Previous research (Grosjean & Deschamps, Reference Grosjean and Deschamps1975, p. 159) comparing pausing behavior of French and English native speakers in interviews indicated cross-linguistic differences regarding the frequency and duration of pauses; English speakers paused more frequently than French speakers, but for shorter periods of time. Riazantseva (Reference Riazentseva2001) included baseline data from a group of native English speakers in her cross-sectional study of pausing characteristics of Russian L1 learners of English who contributed data in both their L1 and their L2. Significant cross-linguistic differences were found between native speakers of Russian and English in pause duration but not pause frequency or distribution. Native speakers of Russian paused longer in Russian than native speakers of English paused in English.
To investigate whether cross-linguistic similarities and differences may influence the relationship between L1 and L2 fluency, Derwing et al. (Reference Derwing, Munro, Thomson and Rossiter2009) explored the L2 fluency behavior of Slavic and Mandarin L1 learners of English longitudinally. Participants included highly educated immigrants in Canada who were beginning learners of English. Using the same narrative picture-based task, Derwing et al. collected recordings at 2 months (Time 2), 10 months (Time 6), and 1 year after these learners arrived in Canada (Time 7). Temporal measures included (a) the number of pauses per second, (b) speech rate (i.e., the number of syllables per second which includes pausing time), and (c) pruned syllables per second (i.e., the total number of syllables without repetitions, corrections, filled pauses, etc.). Perceived fluency ratings were also collected for both groups and indicated significant gains for the Slavic group, but not the Mandarin group from Time 2 to Time 7. The results also indicated significant positive correlations between L1 and L2 temporal measures of fluency for both Mandarin and Slavic speakers at Time 2, but significant correlations at Times 6 and 7 were found for the Slavic group only. Derwing et al. argued that the lack of correlation for the Mandarin group at later time points could have been related to the lack of improvement of the group as a whole.
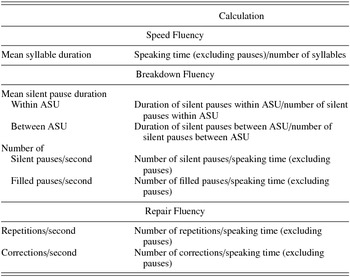
Perhaps the strongest evidence for a link between L1 and L2 fluency comes from De Jong et al.’s (Reference De Jong, Groenhout, Schoonen and Hulstijn2015) investigation of English and Turkish L1 learners of Dutch. Their aim was to investigate whether measures of L2 fluency that were corrected for L1 fluency behavior could predict L2 Dutch proficiency better than uncorrected measures. Participants included learners with intermediate to advanced proficiency in Dutch who had been living in the Netherlands for an average of 4.5 years. Seven measures of temporal fluency were investigated following the subcategories set forth by Skehan (Reference Skehan2003) and Tavakoli and Skehan (Reference Tavakoli, Skehan and Ellis2005). As these are the measurements adopted in the analysis in the current study, a detailed explanation and justification for their use is presented here. Speed fluency was represented by mean syllable duration (i.e., inverse articulation rate) and was calculated as the total speaking time (excluding silent pauses) divided by the total number of syllables. This measure differs from the measure of speech rate used in previous work (e.g., Derwing et al., Reference Derwing, Munro, Thomson and Rossiter2009; Towell & Dewaele, Reference Towell, Dewaele and Dewaele2005; Towell et al., Reference Towell, Hawkins and Bazergui1996) in that it excludes silent pauses and thus is a less confounded measure of fluency. Breakdown fluency comprised four measures, including those that take frequency, duration, and location into account. To investigate the location of silent pauses and whether behavior changed either within or between syntactic units, the analysis of speech unit (ASU) was used. This unit comprises “an independent clause, or sub-clausal unit, together with any subordinate clause(s) associated with either” (Foster, Tonkyn, & Wigglesworth, Reference Foster, Tonkyn and Wigglesworth2000, p. 365). Taking frequency, duration, and location into account, the four measures of breakdown fluency were (a) the mean length of silent pauses within ASU, (b) the mean length of silent pauses between ASU, (c) the number of silent pauses per second speaking time, and (d) the number of nonlexical filled pauses per second speaking time. In addition to using more fine-grained measures of pausing than Derwing et al., (Reference Derwing, Munro, Thomson and Rossiter2009), who used only average (silent) pause duration, De Jong et al. used a different silent pause threshold: 250 ms as opposed to 400 ms. A silent pause threshold of 250 ms has been shown to correlate more with measures of L2 proficiency (De Jong & Bosker, Reference De Jong and Bosker2013; Kahng, Reference Kahng2014). Finally, repair fluency, which represents the online modification of utterances (Tavakoli & Skehan, Reference Tavakoli, Skehan and Ellis2005), comprised two measures and included (a) the number of repetitions per second speaking time and (b) the number of corrections per second speaking time.
Comparing L1 and L2 performance on these measurements of temporal fluency, De Jong et al. reported significant differences on all temporal measures for both groups between Dutch and their L1s. The results also indicated cross-linguistic differences between L1 Turkish and L1 English. For example, mean syllable duration differed between L1 groups, which they attributed to the simpler syllable structure in Turkish. In addition, all seven L1 and L2 fluency measures correlated significantly when both L1 groups were combined. Conducting linear regression models to predict L2 fluency from L1 fluency and language group, results indicated L1 fluency significantly improved the model for each temporal measure. Language group contributed to those models where L1 differences were found between Turkish and English. Saving the residuals from these regression analyses, they determined whether corrected measures of L2 fluency could better predict proficiency (as measured by a productive vocabulary task) than uncorrected measures. Although they found that all seven L1 measures could predict characteristics of the L2 fluency measures, only one of the corrected measures (mean syllable duration) was a stronger predictor of L2 proficiency than the uncorrected measures. Towell and Dewaele (Reference Towell, Dewaele and Dewaele2005) also concluded that “fluency in the L2 reflects fluency in the L1, most directly in speaking rate” (p. 232).
Based on this review of the literature, the research investigating the relationship between L1 and L2 fluency has generally found medium to strong correlations between L1 and L2 measures of utterance fluency. However, it has been shown through cross-linguistic comparisons that languages may differ in ways that could mediate the strength of the relationship between L1 and L2 fluency. Furthermore, longitudinal studies such as Derwing et al. (Reference Derwing, Munro, Thomson and Rossiter2009) show different results over time depending on L1 group and proficiency level. Therefore, to further our understanding of L2 fluency behavior, it is necessary to consider the extent to which variables such as cross-linguistic differences and proficiency mediate the relationship between L1 and L2 fluency.
RESEARCH QUESTIONS
The goal of the current study is to explore the relative contribution of L1 fluency behavior, cross-linguistic differences, and proficiency in predicting L2 fluency behavior. By comparing the relative predictive power of these variables for preimmersion L2 fluency and during-immersion L2 fluency, it is possible to examine if the predictive power of these variables shifts over time. Based on previous research, there is strong evidence that L2 fluency improves in a study abroad context (e.g., Du, Reference Du2013; Freed, Reference Freed1995; Mora & Valls-Ferrer, Reference Mora and Valls-Ferrer2012; Segalowitz & Freed, Reference Segalowitz and Freed2004; Serrano, Llanes, & Tragant, Reference Serrano, Llanes and Tragant2011). In addition, cross-linguistic similarities and differences, as well as individual L1 fluency behavior, appear to have an effect on the strength of the relationship between L1 and L2 fluency. Thus, in order to understand the effects of cross-linguistic differences, it is also necessary to compare the fluency behavior of native speakers of the languages.
The research questions guiding the current study are as follows:
-
1. To what extent do native speakers of English, Spanish, and French differ with regard to measures of speed, breakdown, and repair fluency?
-
2. To what extent is there a relationship between L1 and L2 fluency behavior before and after 5-months’ residence abroad?
-
3. To what extent can L2 fluency measures be predicted from L1 fluency behavior, target language group (Spanish or French), and proficiency before and after 5-months’ residence abroad?
Based on the review of the literature, several predictions can be made. First, cross-linguistic differences between English, Spanish, and French native speakers are predicted, especially regarding measures of speed fluency (i.e., mean syllable duration). It is possible that frequency and duration of pauses as well as repetitions may differ, given that these aspects of fluency have been shown to differ in previous studies. Second, correlations between L1 and L2 fluency measures are also predicted (De Jong et al., Reference De Jong, Groenhout, Schoonen and Hulstijn2015). Third, given that no previous research in L2 fluency has investigated the relative contributions of L1 fluency behavior, cross-linguistic differences, and proficiency in predicting L2 fluency behavior in a single model, it is unclear what those relative contributions will be, and whether they shift over time. Nevertheless, the findings of Derwing et al. (Reference Derwing, Munro, Thomson and Rossiter2009), in which significant correlations between L1 and L2 fluency measures were maintained over time for Slavic L1 learners of English but not Mandarin L1 learners, might suggest that the contribution of cross-linguistic differences may differ as proficiency changes. Fourth, it is also predicted that for those measures that differ between native speakers, the addition of the target language group variable will significantly improve models predicting L2 fluency behavior whereas for those that are similar it will not (De Jong et al., Reference De Jong, Groenhout, Schoonen and Hulstijn2015).
METHOD
Participants
The participants come from the longitudinal Languages and Social Networks Abroad Project (Mitchell, Tracy-Ventura, & McManus, Reference Mitchell, Tracy-Ventura and McManus2017) that investigates language learning before, during, and after residence abroad. They were undergraduate students from a university in the United Kingdom who were undertaking French (n = 29) or Spanish (n = 27) degrees and were required to spend their third year (of a 4-year degree) abroad. Because the current study compares L1 and L2 fluency, participants whose L1 was not English were excluded (n = 5). An additional two participants were excluded because of low quality or missing recordings.
Of the remaining 24 participants in the Spanish learner group, more than half spent the academic year in Spain (n = 15) and the rest in Mexico (n = 9). Seven participants were male and 17 were female. Their mean age at the start of data collection was 21 (SD = 1.2 years), and the mean length of studying Spanish was 6 years (SD = 3.2 years). Of the remaining 25 participants in the French learner group, all spent the academic year in France. Two participants were male and 23 were female. Their mean age at the start of data collection was 20 (SD = 0.7 years), and the mean length of studying French was 11 years (SD = 2.4 years). Unlike more traditional study abroad programs where students go abroad and take classes, students in the United Kingdom have a choice of placement type while abroad: as Erasmus exchange students at a partner university, as English teaching assistants, or as interns in different types of work placement (Meara, Reference Meara1994; Mitchell, McManus, & Tracy-Ventura, Reference Mitchell, McManus, Tracy-Ventura, Mitchell, Tracy-Ventura and McManus2015). Therefore, their day-to-day experiences differed depending on the placement type they chose (see Mitchell et al., Reference Mitchell, Tracy-Ventura and McManus2017, for more details). Adult native speakers of Spanish (n = 18) and French (n = 10)Footnote 1 who were age matched to the learner group were also recruited to complete the narration tasks in their L1 for cross-linguistic comparison purposes.
Instruments
Speaking tasks
Two picture-based narratives were used in this study: the Cat Story, borrowed from Dominguez, Tracy-Ventura, Arche, Mitchell, and Myles (Reference Dominguez, Tracy-Ventura, Arche, Mitchell and Myles2013) and based on Langley (Reference Langley2000), and the Brothers Story created for the larger project based on the children's book I Very Really Miss You (Langley, Reference Langley2006). Each story began with a prompt. The Cat Story, for example, depicts the story of a little girl and her cat and what happens one day when the cat goes missing. It begins with a prompt Todas las mañanas eran iguales/Tous les matins étaient pareils (“Every morning was the same”), which signals a series of background information about what the little girl and her cat used to do every day. A few pages later the phrase Hasta que un día/Mais il est arrivé un jour (“Until one day”) appears in order to signal that the main events of the story are about to begin. The English version of the Cat Story was also administered. The only change was that the prompts were provided in English. All participants were given approximately 1 min of planning time to look through the pages and get a sense of the full story before orally retelling the story. While narrating the story, participants were able to continue looking at the pages.
Elicited Imitation Test (EIT)
The measure of proficiency adopted in the current study was an EIT. An EIT requires test takers to listen to test stimuli and repeat them orally as accurately as possible. The idea behind an EIT as a measure of L2 proficiency is that learners can only imitate sentences that they have both parsed and comprehended (Bley-Vroman & Chaudron, Reference Bley-Vroman, Chaudron, Tarone, Gass and Cohen1994). EITs, particularly those with a range of sentence lengths, have been found to be valid and reliable measures of L2 proficiency (Yan, Maeda, Lv, & Ginther, Reference Yan, Maeda, Lv and Ginther2015). The Spanish EIT used in the current study was designed by Ortega (Reference Ortega2000). Parallel versions of this EIT were also created in English, German, and Japanese for a cross-linguistic study of syntactic complexity measures and their relationship to L2 proficiency (Ortega, Iwashita, Norris, & Rabie, Reference Ortega, Iwashita, Norris and Rabie2002). Versions are also available in Chinese (Wu & Ortega, Reference Wu and Ortega2013) and Korean (Kim, Tracy-Ventura, & Jung, Reference Kim, Tracy-Ventura and Jung2016). The test sentences of the Spanish EIT were constructed to include high frequency vocabulary items, a range of syntactic complexity, and typical grammatical features known to challenge instructed learners. A French version of the EIT, translated based on the English stimuli, was created for the Languages and Social Networks Abroad Project (Tracy-Ventura, McManus, Norris, & Ortega, Reference Tracy-Ventura, McManus, Norris, Ortega, Leclercq, Edmonds and Hilton2014). The Spanish and French versions of the EIT used in the current study have nearly the same stimuli; the French and Spanish versions both include 30 test sentences. The French sentences range from 7 to 19 syllables, and the Spanish sentences range from 7 to 17 syllables. This difference in the highest number of syllables is not a major concern in the comparability of the two tests, however, because item difficulty analyses demonstrated that the items with the highest number of syllables are not necessarily the most difficult (see Tracy-Ventura et al., Reference Tracy-Ventura, McManus, Norris, Ortega, Leclercq, Edmonds and Hilton2014). The Spanish EIT was also used in Bowden (Reference Bowden2016) and is available, along with the French EIT, on IRIS (https://www.iris-database.org/iris/app/home/index).
Procedures
Data in the longitudinal investigation were collected six times over an almost 2-year period (May 2011–February 2013) including three data collection points during a 9-month stay abroad when participants were visited in situ by a member of the research team; however, in the current analysis, we focus on a subset of that data, from the pretest and Visit 2 abroad, because these data collection rounds included the proficiency test, whereas the other two visits abroad did not. The L2 version of the Cat Story was administered at the pretest (May 2011) and the L2 version of the Brothers Story was administered at Visit 2 (February 2012). The same EIT was administered at both the pretest and Visit 2. Because a second version of the EIT with different test items does not exist, the decision was made to administer the EIT at Visit 2 (February 2012) abroad instead of Visit 1 (November 2011) to increase the time between administrations to 9 months in an effort to minimize any practice effects. The L1 version of the Cat Story was administered at the last data collection round, 8 months after students had returned from their stay abroad (February 2013).
Data analysis
Speaking tasks
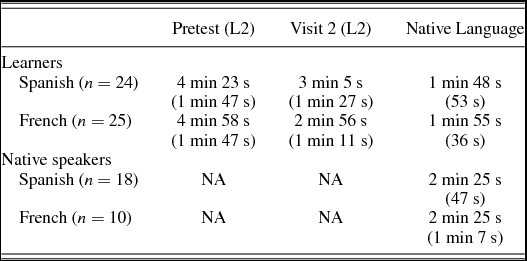
Data included 8 hr and 55 min of audiorecorded narrations. Participants were not given a time limit, and thus the recording length varied among them. Table 1 presents the means and standard deviations of the length of the recordings in the L1 (English, Spanish, or French) and L2 (Spanish or French).
Means (standard deviations) of recording length separated by learner group and language

Note: L2, Second language.
All data were first transcribed according to the Codes for Human Analysis of Transcripts conventions for later use with the Computerized Language Analysis program (MacWhinney, Reference MacWhinney2000). After the transcriptions were completed, they were checked for accuracy by another member of the research team. Transcriptions were coded for filled pauses (e.g., um or uh), repetitions (i.e., when a speaker repeated a word or phrase verbatim), and corrections (i.e., when a speaker modified a previously spoken word or phrase). Syllables for each of the language data sets (English, French, and Spanish) were counted by research assistants, and a subset of each set was also coded by the authors. Syllables were counted by hand based on the transcripts for the Spanish and English data and based on the transcripts and audio for the French data because of the possibility of differences in production of words like finalement (three vs. four syllables).Footnote 2 Interrater reliability was calculated between the two ratings for each of the data sets and the resulting Cohen κ was 0.99 (English), 0.99 (Spanish), and 0.99 (French), demonstrating very good agreement.
Audio data were then automatically segmented using Praat's Annotate to TextGrid (silences) feature (Boersma & Weenink, Reference Boersma and Weenink2010). The minimum lower bound for silent pauses was set to 250 ms (De Jong & Bosker, Reference De Jong and Bosker2013; Kahng, Reference Kahng2014). As stated previously, a lower bound of 250 ms for silent pauses (as opposed to the 400 ms used in Derwing et al., Reference Derwing, Munro, Thomson and Rossiter2009) was chosen because of research demonstrating this as an optimal threshold for correlation to L2 proficiency. Next, accuracy of the segmentation was checked manually by the first author, and adjustments were made.Footnote 3 The second author manually checked 20% of the data. Interrater reliability was calculated between the two raters and the resulting Cohen κ was 0.92, demonstrating very good agreement; thus, the first author manually checked the remaining data.
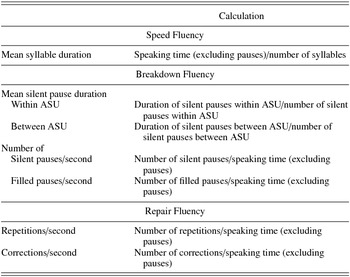
Utterance fluency in the current analysis is investigated using the subcategories proposed by Skehan (Reference Skehan2003) and Tavakoli and Skehan (Reference Tavakoli, Skehan and Ellis2005): speed, breakdown, and repair fluency. Following De Jong et al. (Reference De Jong, Groenhout, Schoonen and Hulstijn2015), seven measurements of fluency were calculated, as seen in Table 2.
Fluency measure calculations
Note: ASU, Analysis of speech unit.
EIT
The EIT was scored using the 5-point rubric (0–4) outlined in Ortega (Reference Ortega2000). A score of 4 was given for exact repetition, 3 for repetitions that preserve the original meaning of the stimulus but include small changes in grammar, 2 for repetitions that are meaningful but depart slightly from the original meaning of the stimulus, 1 for repetitions that are missing important content from the original stimulus and may also be incomplete sentences, and 0 for repetitions that include minimal to none of the original content of the stimulus. The total possible score on the EIT was 120 (30 items × 4 points each).
RESULTS
Before addressing the research questions, descriptive statistics are presented for the measure of proficiency adopted in the current study, the EIT, and the measures of utterance fluency. Learners in the Spanish group (n = 24) scored a mean of 83.96 (SD = 11.73) at the pretest on the proficiency test and a mean of 98.92 (SD = 7.72) at Visit 2. As the data were normally distributed and contained no outliers, a paired-samples t test was conducted and indicated significant improvement for the Spanish group from pretest to Visit 2, t (23) = 7.97, p < .001, d = 1.51. Learners in the French group (n = 25) scored a mean of 59.28 (SD = 16.04) at the pretest on the proficiency test and a mean of 76.56 (SD = 14.74) at Visit 2.Footnote 4 A paired-samples t test indicated significant improvement for the French group from pretest to Visit 2, t (24) = 9.18, p < .001, d = 1.12.
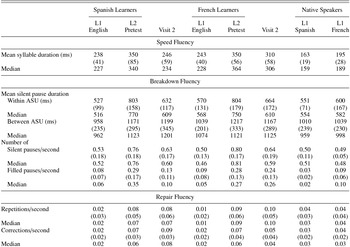
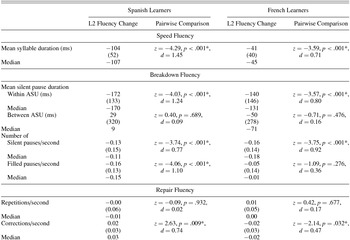
Table 3 provides the mean, standard deviation, and median of the speed, breakdown, and repair fluency measurements for the pretest, Visit 2, and English data for both the Spanish and French groups, and the L1 data from the Spanish and French native speakers. As shown in Table 3, the English L1 fluency measures of the two learner groups appear to be comparable.Footnote 5 Table 4 provides the mean, standard deviation, and median of the changes in L2 fluency from the pretest to Visit 2 for both the Spanish and the French groups. Nonparametric tests were conducted to determine whether changes over time on the L2 fluency measures between the pretest and Visit 2 were significant as not all data were normally distributed and several measures contained outliers. As shown in Table 4, the results of Wilcoxon signed-rank tests indicated statistically significant gains in three measures for both the Spanish and French learner groups: mean syllable duration, mean silent pause duration within ASU, and the number of silent pauses per second. Both learner groups also showed significant differences in the number of corrections per second, but the Spanish group showed an increase whereas the French group showed a decrease. For the number of filled pauses per second, the Spanish group showed a significant decrease in filled pauses, but there was no significant difference for the French group. Finally, neither group showed significant differences for the average length of silent pauses between ASU or the number of repetitions per second.
Means (standard deviations) and medians of temporal fluency measures from the pretest, Visit 2, and English separated by learner group and L1 Spanish and L1 French from the native speaker groups

Note: L1, First language; L2, second language; ASU, analysis of speech unit.
Changes in L2 fluency for the Spanish and French groups

Note: L2, Second language; ASU, analysis of speech unit.
*p < .05.
Before running inferential statistics to test whether L1 measures of fluency were comparable between English, French, and Spanish (Research Question 1) and whether L1 and L2 measures of fluency correlated for the learners (Research Question 2), parametric test assumptions (e.g., normality and existence of outliers) were first checked. For example, the data were inspected visually, and Shapiro–Wilk normality tests indicated that of the seven sets of fluency measures (see Table 3), six contained at least one subset (pretest, Visit 2, English) that failed the Shapiro–Wilk test for the French learner group data, and the same was true for five sets of the Spanish learner group data. For the Spanish and French native speakers, three measures failed the Shapiro–Wilk test. In addition, the data contained outliers in some of the measures: 6 of the 21 variables for the French learner group and 10 of the 21 variables for the Spanish learner group (many of which were in the English data), and 4 of the 14 variables in the Spanish and French native speaker data. In an attempt to obtain normally distributed data so as to not violate assumptions of the parametric tests, a variety of transformations [e.g., log(x + 1) and SQRT(x)] were conducted where appropriate given a particular measure (Larson-Hall, Reference Larson-Hall2010); however, none of the transformations resulted in normally distributed data nor did they affect outliers. Thus, the original data were retained and nonparametric tests were conducted. The α level was set at p < .05, and effect sizes are reported using the absolute value of d. These were interpreted following Plonsky and Oswald (Reference Plonsky and Oswald2014) for within-group contrasts: d = 0.60 (small), d = 1.00 (medium), and d = 1.40 (large); between-group contrasts: d = 0.40 (small), d = 0.70 (medium), and d = 1.00 (large); and correlation coefficients: r = .25 (small), r = .40 (medium), and r = .60 (large).
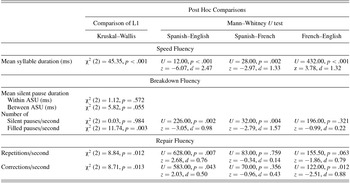
Research question 1 examined to what extent there were cross-linguistic differences between native speakers of English, Spanish, and French with regard to measures of speed, breakdown, and repair fluency. The results of the Kruskal–Wallis tests indicated statistically significant differences between the native speaker groups on four of the seven temporal fluency measures: mean syllable duration (speed fluency), the number of filled pauses per second (breakdown fluency), and both the number of repetitions and corrections per second (repair fluency). Table 5 lists the chi square test statistics and their associated p values for each of the seven measures. Post hoc Mann–Whitney U tests were conducted on those four measures with α levels adjusted to p < .0167. Table 5 lists the U and z test statistics and their associated p values and effect sizes for each of the four measures (Larson-Hall, Reference Larson-Hall2010).
Chi square test statistics and their associated p values as a result of the Kruskal–Wallis tests and U and z test statistics and their associated p values and effect sizes as a result of the Mann-Whitney U tests

Note: L1, First language; ASU, analysis of speech unit.
The results from the Mann–Whitney U tests indicated significant differences and large effect sizes between all language pairings for mean syllable duration, with English speakers having a longer mean syllable duration than French (z = 3.78, p < .001, d = 1.32) and Spanish speakers (z = –6.07, p < .001, d = 2.47), and French speakers having a longer mean syllable duration than Spanish speakers (z = –2.97, p = .002, d = 1.33). For the measure of the number of filled pauses per second, results indicated significant differences and large effect sizes between Spanish and both English (z = –3.05, p = .002, d = 0.98) and French (z = –2.79, p = .004, d = 1.57), such that Spanish speakers produced fewer filled pauses than French or English speakers. No significant differences were found between French and English (p = .321, d = 0.22). For the number of repetitions per second, results indicated significant differences with a medium effect size between Spanish and English (z = 2.68, p = .007, d = 0.76), such that Spanish speakers made fewer repetitions than English speakers. No significant differences were found between Spanish and French speakers (p = .759, d = 0.14) or English and French speakers (p = .063, d = 0.79). For the number of corrections per second, results indicated significant differences between English and both Spanish (z = 2.03, p = .043, d = 0.50) and French (z = –2.51, p = .012, d = 0.88), with a small and medium effect size, respectively, such that English speakers made more corrections than Spanish or French speakers. No significant differences were found between Spanish and French (p = .356, d = 0.43).
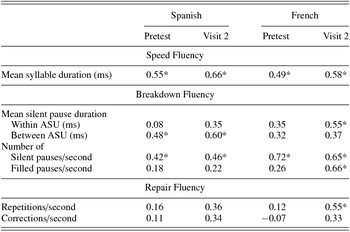
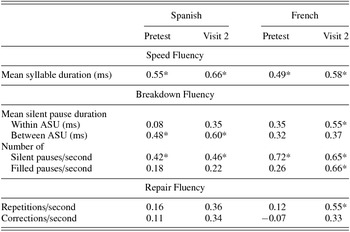
Research question 2 examined to what extent there is a relationship between temporal measures of fluency in the L1 and L2 before and after 5-months’ residence abroad. To address this question, Spearman correlations were conducted for the seven temporal measures between the L1 and the L2 at the pretest and at Visit 2 for both the French and Spanish groups (see Table 6).
Correlations between L1 fluency and L2 fluency measures for the Spanish group and the French group at the pretest and at Visit 2
Note: L1, First language; L2, second language; ASU, analysis of speech unit.
*p < .05.
As can be seen in Table 6, the results for both groups demonstrate positive correlations between the L1 and the L2 fluency measures (except the number of corrections per second for the French group at the pretest, r = –.07) that range from weak to strong (r = .08 to r = .72), yet only a subset of these correlations are significant. For the Spanish group, the same three fluency measures are significant at both the pretest and Visit 2: mean syllable duration (pretest: r = .55, Visit 2: r = .66), mean silent pause duration between ASU (pretest: r = .48, Visit 2: r = .60), and number of silent pauses per second (pretest: r = .42, Visit 2: r = .46). In contrast, for the French group, whereas only two of the correlations are significant at the pretest (mean syllable duration, r = .49 and number of silent pauses per second, r = .72), five of the seven measures correlate significantly at Visit 2 (all but mean silent pause duration between ASU and number of corrections per second).
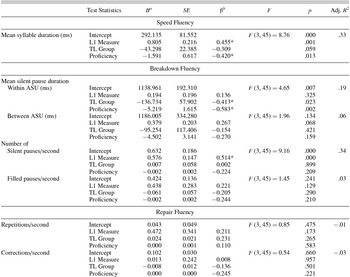
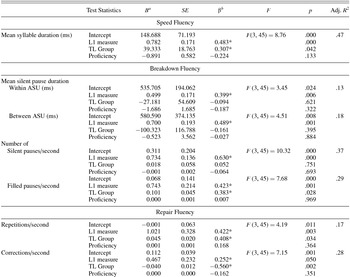
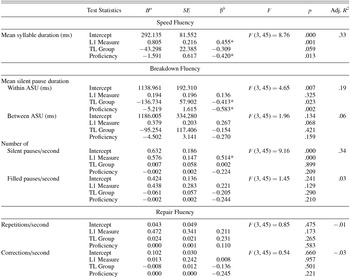
Research question 3 examined to what extent L2 measures of fluency can be predicted from L1 measures of fluency, target language group, and proficiency before and after 5-months’ residence abroad. To address this question, multiple regressions were conducted (variables entered simultaneously) with the L2 fluency measure as the dependent variable and the L1 fluency measure, target language group (Spanish or French, coded as a dummy variable), and proficiency (EIT score) as independent variables. Assumptions for multiple regression (e.g., normal distribution of residuals, independence of observations, linearity between dependent and independent variables, and homoscedasticity) were checked and met. The results from the multiple regressions at the pretest are presented in Table 7 and those from Visit 2 are presented in Table 8.
Results of the multiple regression models predicting L2 fluency at the pretest from L1 fluency, TL group, and proficiency
Note: L2, Second language; L1, first language; TL, target language; ASU, analysis of speech unit.
a Unstandardized regression coefficient.
b Standardized coefficient.
*p < .05.
Results of the multiple regression models predicting L2 fluency at visit 2 from L1 fluency, TL group, and proficiency

Note: L2, Second language; L1, first language; TL, target language; ASU, analysis of speech unit.
a Unstandardized regression coefficient.
b Standardized coefficient.
*p < .05.
At the pretest, models predicting L2 fluency measures from L1 fluency measures, target language group, and proficiency were significant for mean syllable duration, F (3, 45) = 8.76, p < .001 (speed fluency), and two measures of breakdown fluency: mean silent pause duration within ASU, F (3, 45) = 4.65, p = .007, and the number of silent pauses per second, F (3, 45) = 9.16, p < .001. The amount of variance explained for mean syllable duration was 33%, for mean silent pause duration within ASU was 19%, and for the number of silent pauses per second was 34%. For mean syllable duration, the L1 fluency measure and proficiency significantly contributed to the model (p < .001 and p = .013, respectively), and target language group approached significance (p = .059). For mean silent pause duration within ASU, target language group and proficiency significantly contributed to the model (p = .023 and .002, respectively), whereas the L1 fluency measure did not (p = .325). For the number of silent pauses per second, the L1 fluency measure significantly contributed to the model (p < .001), whereas target language group and proficiency did not (p = .899 and .209, respectively).
At Visit 2, models predicting L2 fluency measures from L1 fluency measures, target language group, and proficiency were significant for all seven temporal measures of fluency, with the amount of variance explained ranging from 13% to 47%. In contrast to results from the pretest, the L1 fluency measure contributed significantly to each model, whereas proficiency did not significantly contribute to any model. Target language group significantly contributed to mean syllable duration, the number of filled pauses per second, the number of repetitions per second, and the number of repairs per second. Note that these were the same measures that differed among the native speakers.
DISCUSSION
The purpose of this study was to investigate the effects of individual differences in L1 fluency behavior, cross-linguistic differences, and proficiency on L2 fluency behavior over time. The results indicated that both groups’ L2 proficiency and several measures of L2 fluency significantly improved after 5-months’ residence abroad, and the effect sizes were large, which supports previous research demonstrating development as a result of residence/study abroad (e.g., Du, Reference Du2013; Freed, Reference Freed1995; Mora & Valls-Ferrer, Reference Mora and Valls-Ferrer2012). It was also the case that English, Spanish, and French native speakers differed significantly on some measures of fluency: mean syllable duration, number of filled pauses per second, number of repetitions per second, and number of corrections per second, but not average silent pause duration within or between ASU or the number of silent pauses per second. In the current study, we found that English native speakers had a longer mean syllable duration than Spanish and French native speakers, and French native speakers, in turn, had a longer mean syllable duration than Spanish native speakers. These results are in line with the syllable structures of these given languages and previous work indicating cross-linguistic differences regarding speech rate with other languages (e.g., De Jong et al., Reference De Jong, Groenhout, Schoonen and Hulstijn2015; Roach, Reference Roach, Bauer and Trudgill1998). In addition, results of the current study demonstrated that Spanish native speakers produced fewer filled pauses and repetitions than English native speakers, and that English native speakers used more corrections than Spanish or French native speakers. Unlike the results from Grosjean and Deschamps (Reference Grosjean and Deschamps1975), it was not the case that differences were found between English and French native speakers with regard to pause frequency. One possible explanation for this may be a result of different tasks: the current study examined data from picture-based narratives whereas Grosjean and Deschamps examined interview data. Task type has been shown to influence temporal measures of fluency (Préfontaine & Kormos, Reference Préfontaine and Kormos2015), including articulation rate and pause duration. The fact that cross-linguistic differences were found between the three languages supports the idea that the fluency characteristics of the languages under investigation might influence the strength of the relationship between L1 and L2 fluency. This finding is addressed in Research Question 3.
The second research question examined to what extent there is a relationship between L1 and L2 temporal measures of fluency before and after 5-months’ residence abroad. Only two of the seven temporal measures of fluency, mean syllable duration and the number of silent pauses per second, correlated at the pretest (and Visit 2) for both groups. For the Spanish group, the average pause duration between ASU was also significant at the pretest and Visit 2, but no other measures were significant at Visit 2. For the French group, all but two measures, average pause duration between ASU and the number of corrections per second, were significant at Visit 2. These results are in contrast to those presented in De Jong et al. (Reference De Jong, Groenhout, Schoonen and Hulstijn2015), who found significant correlations between all measures in the L1 and the L2 and Derwing et al. (Reference Derwing, Munro, Thomson and Rossiter2009), who found significant L1–L2 correlations at Time 2 for all three of their measures. One explanation for the current findings could be related to the exposure that participants in each of the studies had at the time of testing. Participants in De Jong et al. had already resided abroad for an average of 4.5 years compared to participants in Derwing et al., who had been residing abroad for an average of 4.8 months. The participants in the current study had never resided abroad before the pretest for any significant amount of time. It is important to note that significant correlations between L1 and L2 fluency were found for measures of mean syllable duration and pausing frequency from early on, and this result parallels previous findings such as those in Derwing et al. and Towell and Dewaele (Reference Towell, Dewaele and Dewaele2005). Derwing et al. did not find significant L1–L2 correlations for the Mandarin group at Times 6 and 7 (although significant correlations were found for learners in the Slavic group); however, this result might be explained by the fact that learners in the Mandarin group did not show improvement between the two time points whereas learners in the Slavic group and learners in the current study did improve over time.
The third research question examined to what extent L2 measures of fluency can be predicted from L1 measures of fluency, target language group, and proficiency before and after 5-months’ residence abroad. The results indicated that at the pretest, only models predicting L2 mean syllable duration, mean silent pause duration within ASU, and the number of silent pauses per second were significant; however, L1 fluency only contributed to models of mean syllable duration and the number of silent pauses per second. In contrast, at Visit 2 L1 fluency significantly contributed to all models, target language group contributed to those models where cross-linguistic differences were found between native speakers, and proficiency contributed to none. These findings suggest that L2 fluency behavior and its relationship to L1 fluency behavior are mitigated by both cross-linguistic differences and proficiency and that the relative explanatory power of these factors shifts with language experience. The contribution of cross-linguistic differences changes between pretest and Visit 2, with target language group at Visit 2 contributing to those models only in which differences were found between native speaker groups. In other words, when predicting L2 fluency behavior at the pretest, not much information is gained by knowing whether these English speakers are learning French or Spanish. At Visit 2, however, knowing the language an English speaker is learning significantly contributes to explaining variation in those measures that differ between English, Spanish, and French native speakers. Although not highlighted in their paper, these results parallel those from De Jong et al. (Reference De Jong, Groenhout, Schoonen and Hulstijn2015), who found that language group contributed to a best fit model of the three fluency measurements that differed between Turkish and English native speakers (mean syllable duration, number of silent pauses per second, and number of repetitions per second). Based on these results, it seems possible that cross-linguistic differences in fluency characteristics between a learner's L1 and L2 could affect the amount of gains that can be made. For example, L1 English speakers who are learning Spanish have more room to develop in the area of mean syllable duration than if they were learning French because the difference between English and Spanish is greater than between English and French. Future research is needed to investigate this claim.
The finding that L1 fluency behavior and cross-linguistic differences contribute to explaining more variation in L2 fluency behavior as L2 fluency improves is perhaps explained by processing difficulties at lower proficiency levels. It might be the case that at the pretest, learners’ weaker L2 cognitive fluency contributed more to explaining variation in L2 utterance fluency than the factors investigated in the current study. Although we did not include any tests of cognitive fluency to examine, for example, whether participants became more efficient at making word–meaning links, given that at Visit 2 they had been residing abroad for 5 months and practicing the L2 regularly, their L2 cognitive processing skills likely became more automatized as proficiency improved. As the difference between their L1 and L2 cognitive fluency decreased, it became possible to observe the influence of other variables on the participants’ L2 utterance fluency, including L1 fluency behavior and cross-linguistic differences. To empirically test this claim, future research is needed that includes tests of cognitive fluency as well.
Conclusion
Some limitations of the current study should be acknowledged. The same measure of proficiency, the EIT, was administered at both the pretest and Visit 2 abroad. Although there were 9 months between administrations of the test, it is possible that there may have been some practice effects. In addition, findings from the current study are based on comparisons of English, Spanish, and French only. While evidence was found for cross-linguistic differences with regard to temporal measures of fluency, more work investigating cross-language differences of these features is needed with a wider variety of combinations of L1s and L2s and larger sample sizes to determine whether these results hold across language pairs. Furthermore, while it was demonstrated that learners’ proficiency and several measures of L2 fluency improved between the pretest and Visit 2 abroad, the current study did not aim to explain what might account for these gains and whether L1 fluency behavior, target language group, and proficiency at predeparture might play a role. Thus, it may be beneficial to include these variables in future research investigating L2 fluency development. A final direction for future work is to investigate the relationship between L1 and L2 fluency in a variety of tasks (Derwing, Rossiter, Munro, & Thompson, Reference Derwing, Rossiter, Munro and Thomson2004; Foster & Skehan, Reference Foster and Skehan1996; Tavakoli & Skehan, Reference Tavakoli, Skehan and Ellis2005). The current study used a picture-based oral narration. Future research should include additional tasks such as those that elicit spontaneous speech (e.g., an interview or conversation). Incorporating results from a variety of task types will ultimately provide a more complete picture of the relationship between L1 and L2 fluency and how task type might mitigate results.
These limitations notwithstanding, the results of this study have demonstrated that variation in L2 fluency behavior is not only explained by individual differences in L1 fluency behavior but also related to other factors such as proficiency and cross-linguistic differences. Perhaps of more importance, the findings indicated that these factors differentially contribute to explaining variance in L2 utterance fluency between preimmersion and after 5-months’ residence abroad. Thus, it may be worthwhile for future research to shift the focus beyond investigating if there is a relationship between L1 and L2 fluency, to rather how that relationship shifts as development occurs. In sum, these results suggest that factors influencing L2 fluency behavior are dynamic, and as such, L2 models of speech production should be equipped to explain these shifts.
ACKNOWLEDGMENTS
The Languages and Social Networks Abroad Project (http://langsnap.soton.ac.uk/) was funded by the Economic and Social Research Council award number RES-062-23-2996. We are grateful to our colleagues Rosamond Mitchell, Kevin McManus, Laurence Richard, Patricia Romero de Mills, and Karen Ruebens; the participants; and our transcribers and research assistants for their contribution to this research. We also thank those from the SPLLOC 2 project, funded by the Economic and Social Research Council award number RES-062-23-1075. Finally, we thank Luke Plonsky and Tom Parker for their assistance with the statistical methods and two anonymous reviewers for their comments.