Introduction
There appears to be a paucity of scientific data on the short-term development of endurance capacity following prolonged low-intensity ski trekking (LIST) in highly aerobically fit recreational athletes (maximal oxygen uptake (V̇O2max) ≥60 mL·kg−1·min−1). In the only study that we know of in this specific field, Sandbæk, Steine, Røseth, Falch, & Steine (Reference Sandbæk, Steine, Røseth, Falch and Steine1997) reported that one male (pre-trek run-specific relative V̇O2max of ∼60 mL·kg−1·min−1) maintained absolute V̇O2max, whereas in two other males (pre-trek run-specific relative V̇O2max of ∼60–67 mL·kg−1·min−1) absolute V̇O2max decreased by ∼5–7%, following 21 days of unsupported prolonged LIST from the east to the west coast of Greenland (∼540 km). In addition to this, Péronnet et al. (Reference Péronnet, Abdelaoui, Lavoie, Marrao, Kerr, Massicotte and Giesbrecht2009) evaluated the ski trek-simulated oxygen cost (L·min−1) in five active males (pre-trek V̇O2max unknown) following 20 days of supported (mid-way) prolonged LIST (∼2 km·h−1, ∼10 h·day−1) from the northern to the southern part of Lake Winnipeg, Canada (∼415 km). The results showed no significant alteration in oxygen cost, indicating no change in work economy, following the traverse (Péronnet et al., Reference Péronnet, Abdelaoui, Lavoie, Marrao, Kerr, Massicotte and Giesbrecht2009). However, as far as the authors know, no studies have examined the short-term development of ski trek-simulated performance and aerobic endurance (V̇O2max, lactate threshold (LT) and work economy) following prolonged LIST in recreational athletes with high aerobic fitness.
Most ski trekkers prefer a slow pace (LIST) during ski expeditions. One important rationale for this is to avoid excessive sweating and thus risk of freezing. Such a condition (freezing) can also cause another negative effect – muscle shivering, which can lead to waste of energy and thus safety concerns and increased risk of unwanted/unnecessary loss of body mass (conversation with Lars Ebbesen, an experienced Norwegian polar explorer). Another interesting fact is to instinctively choose the most energy-efficient pace during LIST. In a study of moderately and highly aerobically fit individuals, by Booth, Thoden, Reardon, Jette & Rode (Reference Booth, Thoden, Reardon, Jette and Rode1991), the results indicated a connection between the choice of pace (mean velocity of ∼2.9 km·h−1) during a 91-day supported traverse from Siberia (over the North Pole) to Ellesmere, Northern Canada (∼1730 km) and the velocity (3 km·h−1) with the lowest oxygen cost (ml·kg−1·km−1) during low-intensity ski trek-simulated work in the laboratory at pre-expedition. This phenomenon is of interest to examine further.
The aim of the present study was thus to explore the short-term development of ski trek-simulated performance and aerobic endurance following prolonged LIST and examine whether there is a connection between the mean pace during LIST and the most energy-efficient speed during ski trek-simulated low-intensity work in the laboratory, in highly aerobically fit recreational athletes. As LIST with skins under the skis resembles walking, we chose treadmill walking, and used hauling weights for simulation of a loaded sledge on snow, for the exercise tests in the laboratory.
Methods
Participants
Two males, aged 24 and 26 years, with high aerobic fitness (V̇O2max expressed in ml·kg−1·min−1 at pre-trek corresponding to ∼125% of the Norwegian reference value (Edvardsen, Hansen, Holme, Dyrstad, & Anderssen, Reference Edvardsen, Hansen, Holme, Dyrstad and Anderssen2013), requested assessment of performance and aerobic endurance before and after a ski expedition in Svalbard. Prior to the case study, the two LIST participants usually performed ∼40 min to several hours of moderate- to high-intensity aerobic-related training (mountain walking, running, cross-country skiing, and/or rowing) two to three times weekly. Before the study commenced, the South-Eastern Norway Regional Committee for Medical and Health Research Ethics (REC South-East) reviewed the project. As the purpose of this study was not to produce new medical or health-related knowledge, REC South-East concluded that the project did not require their approval. Prior to the study, the two participants gave written informed consent.
Exercise test procedures
Following habituation testing, as recommended by Currell and Jeukendrup (Reference Currell and Jeukendrup2008), the two LIST participants performed pre-tests 6–11 days before and post-tests 7–13 days after the ski trek. The time gap between the ski trek and the pre- and post-tests was due to the travel schedule to the starting point and from the end point of the expedition, whereas the interval between the two different test protocols performed at pre- and post-trek (descriptions below) was to provide appropriate rest in between. The same test engineer conducted the pre- and post-tests at approximately the same time of day, with a similar temperature and relative humidity in the laboratory. During the tests, the subjects were not allowed to listen to music or have any spectators in the laboratory.
In order to determine work economy, LT and long-distance performance, a modified version of the stepwise treadmill test protocol of Helgerud, Ingjer, & Strømme (Reference Helgerud, Ingjer and Strømme1990) was used. Following an initial 10-min walk at 3 km·h−1 (0% incline), speed was increased by 1 km·h−1 every fifth minute up to a peak velocity corresponding to 5 km·h−1 (0% incline), after which only the incline was increased by 2.5% every fifth minute, until volitional exhaustion after >45 min of exercise. During the test, the participants pulled weights totalling 12.5 kg, using a rope attached to a pelvic belt, which extended behind them to a ∼1.1 m high stand, ∼3.2 m behind the treadmill. Here the rope went via a pulley at the top of the stand, and the weights hung freely from the rope about 40–45 cm above the floor. The oxygen cost (mL·kg−1·min−1) when walking on a treadmill at 0% incline and pulling weights of 12.5 kg appears to be similar to pulling a ∼55 kg sledge on snow on level ground (Juhani, Pekka, & Timo, Reference Juhani, Pekka and Timo1986). This is about the same load as the LIST participants were hauling during the last period of the trek. Oxygen uptake (V̇O2) and heart rate (HR) were recorded in steady state phase between the third and fifth minute at each workload (Helgerud et al., Reference Helgerud, Ingjer and Strømme1990), whereas blood lactate concentration (BLC) was measured during a standard 30-s break between workloads (Helgerud et al., Reference Helgerud, Ingjer and Strømme1990). V̇O2 measured at 3–5 km·h−1 and 0% incline (33–53% V̇O2max) was used to evaluate work economy. For this purpose, we chose the V̇O2 unit mL·kg −1 ·m −1 , not allometric scaling (e.g. mL·kg −0.75 ·m −1 ), as the velocities were low (walking), and the total weight of the participant and the weights pulled was high. To determine individual LT, BLC immediately following warm-up + a delta value of 2.0 mmol·L−1 was used, which is a useful approach to the “gold standard,” maximal lactate steady state (Mamen, Laparidis, & van den Tillaar, Reference Mamen, Laparidis and van den Tillaar2011).
After 3–6 days of rest, an exhausting ramp test procedure was used to assess V̇O2max and short-distance performance, following a standard 25-min warm-up. This test procedure was a modified version of that of Tønnessen et al. (Reference Tønnessen, Sylta, Haugen, Hem, Svendsen and Seiler2014) and was performed walking at a constant velocity corresponding to 6 km·h−1, starting at a 0% incline, which was increased by 4% each minute until volitional exhaustion within ∼4–6 min. As in the stepwise test procedure, the participants pulled weights totalling 12.5 kg during the ramp test. The mean of the two highest subsequent 30-s V̇O2 readings was calculated as V̇O2max (Tønnessen et al., Reference Tønnessen, Sylta, Haugen, Hem, Svendsen and Seiler2014). A levelling off of V̇O2, despite increased workload, was the main criterion for having achieved V̇O2max (Taylor, Buskirk, & Henschel, Reference Taylor, Buskirk and Henschel1955). Moreover, the subjects needed to fulfil at least three of the following supportive criteria if no levelling off of V̇O2 was observed: I) a peak pulmonary respiratory gas-exchange ratio (RERpeak) ≥1.10 (Edvardsen, Hem & Anderssen, Reference Edvardsen, Hem and Anderssen2014), II) a BLC ≥ 9.0 mmol·L−1 2 min after test completion (Edvardsen et al., Reference Edvardsen, Hem and Anderssen2014), III) a rate of perceived exertion ≥17 on the Borg RPE6–20 scale (Borg, Reference Borg1970; Edvardsen et al., Reference Edvardsen, Hansen, Holme, Dyrstad and Anderssen2013, Reference Edvardsen, Hem and Anderssen2014), and IV) clearly visible exhaustion (Esfarjani & Laursen, Reference Esfarjani and Laursen2007). Due to these criteria, one retest had to be repeated.
Because time to exhaustion was used to assess performance, each participant walked at the same workloads during the stepwise and ramp test procedures pre- and post-trek. The participants were not allowed to view the time during the exercise tests and did not receive their test results until the study was completed. HRmax was estimated as peak heart rate + 5 beats·min−1 following the ramp test (Ingjer, Reference Ingjer1991).
Instruments
All exercise tests were performed on a Woodway PPS 55 treadmill (Woodway GmbH, Weil am Rhein, Germany). To assess V̇O2, carbon dioxide production (V̇CO2), RER and pulmonary ventilation (V E ), a Sensor Medics VMax29 metabolic analyzer with mixing chamber (Vyaire Medical, Höchberg, Germany) was used. To the best of our knowledge, the VMax29 has not been validated against the “gold standard,” the Douglas bag method, during exercise, in any scientific papers. However, comparison of unpublished data from the Norwegian Sport Medicine Clinic (Nimi) and the Norwegian School of Sport Sciences (NIH) indicates that the Vmax29 and Oxycon Pro (Vyaire Medical, Höchberg, Germany), which have previously been validated against the Douglas bag method (Foss & Hallén, Reference Foss and Hallén2005), are approximately equated for submaximal absolute V̇O2 measurements below LT (steady state V̇O2 values measured at 100 to 200 Watts) (conversation with Svein Leirstein, physiology laboratory engineer at NIH). During the tests, the participants wore a nose clip and breathed through a mouthpiece connected to a two-way non-rebreathing valve (2700 series, Hans Rudolph Inc., Kansas, USA). Via a tube (∼2 m), the expired air was led into the mixing chamber for successive analyses of V̇O2, V̇CO2 and V E .
Before testing, the VMax29 was calibrated against room air and calibration gases with known content (Bottle I: 4.0% CO2, 16% O2 and stable N2, Bottle II: 0% CO2, 26% O2 and stable N2). Volume calibration was performed manually with a 3-L syringe. Body mass was measured with a Seca Model 708 digital weight (Seca GmbH Hamburg, Germany). BLC was analysed with a Lactate Pro LT-1710 analyzer (Arkray Inc., Kyoto, Japan). HR was recorded using an HR monitor (Polar Electro Oy, Kempele, Finland), while running time was measured with a digital stopwatch (Hanhart Prisma 200, Hanhart GmbH, Germany).
The ski trek
Six days after completing the pre-tests, the two LIST participants started the ski trek in the north of Svalbard, at Verlegenhuken (N80.06125 | E16.24893), on 11 April 2016. From there, they performed 7 ± 2 h of daily skiing for 23 consecutive days, with skins under their skis and hauling sledges (each ∼80 kg initially and ∼55 kg at the end of the trek) to Sørneset in the south of Svalbard (N76.55994 | E16.67244), and then north again, to Doktorbreen (N77.50921 | E16.55246), where the ∼640 km ski trek (11 017 m ascent, 10 775 m descent) was completed on 3 May 2016. The distance and velocity during the trek were calculated by a global positioning system (Garmin GPSMAP 64x, Kansas, USA). HR was measured on HR monitors (Polar Electro Oy, Kempele, Finland), but data were only recorded during the first four days, since the storage capacity limitations of the monitors were unknown, and the participants had received insufficient instructions on how to handle this (e.g. write down the HR data in a paper diary and delete previous data). This issue is briefly discussed under “Exercise intensity” in the discussion section.
Statistical analysis
The results for the two participants are presented individually in tables and in the text. Mean values ± SD were calculated using Excel spreadsheets (Microsoft Corp., Redmond, WA, USA).
Results
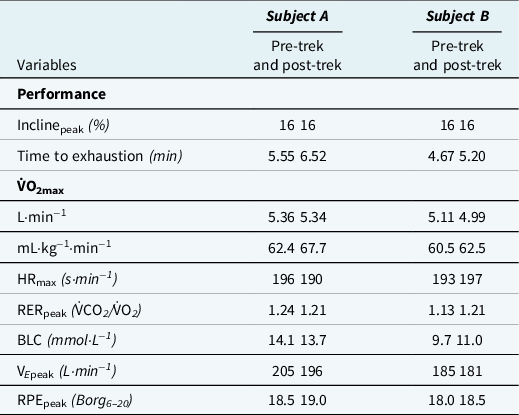
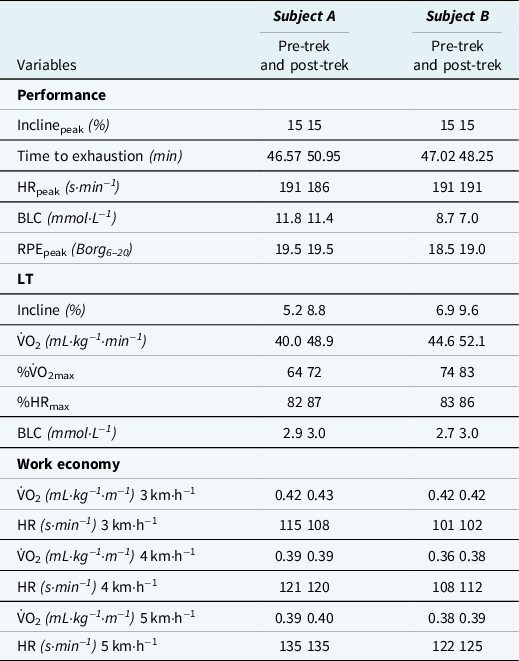
The mean absolute and relative exercise intensity during LIST were 3.9 ± 1.0 km·h−1 and ∼60 ± 8% HRmax, respectively. Body mass decreased by 7.0 kg (8.0%), from 85.9 kg to 78.9 kg, in subject A and by 4.6 kg (5.5%), from 84.4 kg to 79.8 kg, in subject B. Time to exhaustion during the ∼4–6 min ramp walking test increased by 17% and 11% in subjects A and B, respectively (Table 1), whereas time to exhaustion during the >45 min stepwise walking test increased by 9% and 3% in subjects A and B, respectively (Table 2). No notable change in absolute V̇O2max (L·min−1) was observed in the two participants, whereas V̇O2max relative to body mass (mL·kg−1·min−1) increased by 8% in subject A and 3% in subject B (Table 1). LT incline, LT V̇O2 and LT % V̇O2max increased by 69%, 22% and 13%, respectively, in subject A, whereas the same variables increased by 39%, 17% and 12%, respectively, in subject B (Table 2). No notable change in oxygen cost (mL·kg−1·m−1) was observed in the two participants from pre- to post-trek (Table 2). The pre-trek oxygen cost was ∼7% lower at 4 km·h−1 and 5 km·h−1 than at 3 km·h−1 in subject A (Table 2). In subject B, the pre-trek oxygen cost at 4 km·h−1 was ∼14% lower than at 3 km·h−1 and ∼5% lower than at 5 km·h−1 (Table 2).
Short-distance performance and physiological variables in the LIST participants from the ramp test at pre- and post-trek.

Inclinepeak = peak treadmill incline, V̇O2max = maximal oxygen uptake, HRmax = maximal heart rate, RERpeak = peak pulmonary respiratory gas-exchange ratio, BLC = blood lactate concentration, V Epeak = peak pulmonary ventilation, RPEpeak = peak rate of perceived exertion.
Long-distance performance and physiological variables in the LIST participants from the stepwise test at pre- and post-trek.

Inclinepeak = peak incline on the treadmill, HR = heart rate, HRpeak = peak heart rate, BLC = blood lactate concentration, RPEpeak = peak rate of perceived exertion, LT = lactate threshold, V̇O2 = oxygen uptake.
Discussion
This case study appears to be the first to examine the short-term development of ski trek-simulated performance and aerobic endurance following prolonged LIST in recreational athletes with high endurance capacity. The main finding was that LIST increased time to exhaustion during a stepwise and ramp test treadmill procedure, indicating improved long-distance and short-distance performances, respectively. This appeared to be due to decreased body mass and improved fractional utilisation of V̇O2max (increased LT %V̇O2max). Another interesting finding of this study was that there seems to be a connection between the choice of pace (mean velocity) during LIST while hauling a supply sledge and the most energy-efficient velocity during low-intensity treadmill walking while pulling weights.
Exercise intensity
An evaluation of the HR–V̇O2 relationship from the stepwise treadmill test revealed that the participants’ mean relative exercise intensity in percentage of HRmax (∼60 ± 8% HRmax) measured in the first four days of the ski trek corresponded to ∼42 ± 6% V̇O2max. This is similar to the mean pre-trek relative work intensity (58 ± 4% HRmax/40 ± 1% V̇O2max) recorded at the speed on the treadmill (3.9 km·h−1, 0% incline) which corresponded to the mean pace during the ski trek (3.9 ± 1.0 km·h−1). There is thus reason to believe that the mean relative exercise intensity during the whole ski trek was ∼60% HRmax/∼40% V̇O2max. This is in line with that reported (∼62% HRmax/∼42% V̇O2max) following medium-term (32 days) prolonged LIST in moderately trained subjects (pre-trek whole-body relative V̇O2max of ∼51 ml·kg−1·min−1), who crossed Greenland from the west to the east coast (∼570 km) (Helge et al., Reference Helge, Overgaard, Damsgaard, Sørensen, Andersen, Dyrskog, Hermansen and Wojtaszewski2006). According to the five-zone training intensity scale (zones 1–5) suggested by the Norwegian Olympic Training Centre, the mean relative exercise intensity in the two LIST participants of the present study corresponded to “low” zone 1 (zone 1 = 55–75% HRmax/45–65% V̇O2max) (Seiler & Tønnessen, Reference Seiler and Tønnessen2009).
Body mass
The two participants of this study lost a considerable amount of body mass during the expedition. This differs from the findings in the three highly aerobically fit recreational subjects in the short-term study by Sandbæk et al. (Reference Sandbæk, Steine, Røseth, Falch and Steine1997), who reported maintenance, and even gain, in body mass following the traverse. These different results appear to be explained by a lower energy intake (∼21 370 kJ·day−1 versus ∼22 650 kJ·day−1) in heavier ski trekkers (84.4–85.9 kg versus 67–80 kg) and a longer trek distance (∼640 km versus ∼540 km) in the present study versus the study by Sandbæk et al. (Reference Sandbæk, Steine, Røseth, Falch and Steine1997).
Performance
As the present study appears to be the first to investigate the short-term development of ski trek-simulated short-distance and long-distance performances following prolonged LIST in highly aerobically fit recreational athletes, there is a lack of scientific research with which to compare our findings. However, a cautious comparison suggests that the performance improvements in the LIST participants of the present study are in line with the finding of upper-body (arm cycling) performance enhancement (increased peak power output during a ∼10–16 min incremental test) observed following medium-term (42 days) prolonged LIST (∼6 h·day−1, ∼60% HRmax) (Boushel et al., Reference Boushel, Ara, Gnaiger, Helge, González-Alonso, Munck-Andersen, Sondergaard and Calbet2014), but differ from the result of no improvement in lower-body (two-leg cycling) performance (no change in peak power output during a ∼10–16 min incremental test) following medium-term (42 days) prolonged LIST (∼6 h·day−1, ∼60% HRmax) (Boushel et al., Reference Boushel, Gnaiger, Larsen, Helge, González-Alonso, Ara, Munch-Andersen and Calbet2015), in moderately trained subjects (two females, seven males, pre-trek relative V̇O2max of ∼48 ml·kg−1·min−1) (Boushel et al., Reference Boushel, Ara, Gnaiger, Helge, González-Alonso, Munck-Andersen, Sondergaard and Calbet2014, Reference Boushel, Gnaiger, Larsen, Helge, González-Alonso, Ara, Munch-Andersen and Calbet2015). The present findings and those observed following the 42-day supported expedition in north Greenland in the studies by Boushel et al. (Reference Boushel, Ara, Gnaiger, Helge, González-Alonso, Munck-Andersen, Sondergaard and Calbet2014, Reference Boushel, Gnaiger, Larsen, Helge, González-Alonso, Ara, Munch-Andersen and Calbet2015) suggest that short-term and medium-term prolonged LIST can improve aerobic energy-dominated performance in moderately trained and well-trained individuals, but also that performance effects following ski trekking should be evaluated by using activity-specific, or near activity-specific, whole-body or upper-body exercise test procedures. However, further studies are needed to enhance knowledge of this issue.
V̇O2max
The two participants of this study maintained absolute V̇O2max, whereas relative V̇O2max increased due to the decline in body mass. The maintenance of absolute V̇O2max is in line with the observation in one highly aerobically fit LIST participant in the short-term study by Sandbæk et al. (Reference Sandbæk, Steine, Røseth, Falch and Steine1997), but differs from the result in the two other subjects whose absolute V̇O2max decreased substantially (Sandbæk et al., Reference Sandbæk, Steine, Røseth, Falch and Steine1997). The different findings between the present study (maintained absolute V̇O2max) and the study by Sandbæk et al. (Reference Sandbæk, Steine, Røseth, Falch and Steine1997) (decreased absolute V̇O2max in two of three participants) may be due to the use of different test methods (ski trek-simulated testing in the present study versus run-specific testing in the study by Sandbæk et al. (Reference Sandbæk, Steine, Røseth, Falch and Steine1997)). Nevertheless, as intervention studies of moderately trained individuals (pre-training relative V̇O2max of ∼50–60 ml·kg−1·min−1) indicate that exercise intensities >85% HRmax are necessary to affect absolute V̇O2max significantly (Helgerud et al., Reference Helgerud, Høydal, Wang, Karlsen, Berg, Bjerkaas, Simonsen and Hoff2007; Jarstad & Mamen, Reference Jarstad and Mamen2019), it is not to be expected that recreational athletes with high aerobic fitness (pre-training relative V̇O2max of ≥60 ml·kg−1·min−1) would improve absolute V̇O2max following low-intensity exercise around 60% HRmax.
LT
The substantial increase in incline and relative V̇O2 associated with LT observed in the two LIST participants appears to result from both the decline in body mass and the increase in LT %V̇O2max. As this study appears to be the first to evaluate the development of LT following prolonged LIST, there are no studies with which to compare our results. However, it is worth mentioning that the improvement in LT %V̇O2max following short-term prolonged LIST in the present study is similar to the increase (18%) in ski trek-simulated ventilatory threshold as a percentage of V̇O2max reported following medium-term (30 days) prolonged LIST in moderately aerobically fit subjects (Parent, Martin, Morales, Boucher, & Comtois, Reference Parent, Martin, Morales, Boucher and Comtois2018). Therefore, although more research should be conducted in this field, the finding in the present study and that reported by Parent et al. (Reference Parent, Martin, Morales, Boucher and Comtois2018) indicate that short-term and medium-term prolonged LIST may affect the fractional utilisation of V̇O2max.
Work economy
The finding of no notable change in work economy following short-term prolonged LIST in the present study concurs with the results reported by Péronnet et al. (Reference Péronnet, Abdelaoui, Lavoie, Marrao, Kerr, Massicotte and Giesbrecht2009). It is therefore possible that ∼3 weeks of prolonged LIST is too short a time to achieve physiological adaptations that may enhance work economy. This suggestion may be supported by Booth et al. (Reference Booth, Thoden, Reardon, Jette and Rode1991), who reported a ∼15% decrease in oxygen cost, indicating a substantial improvement in work economy, following extremely long-term (91 days) prolonged LIST.
At pre-trek, the oxygen cost during ski trek-simulated low-intensity work in the laboratory was lowest at 4 km·h−1 in subject B and at 4 km·h−1 and 5 km·h−1 in subject A. This indicates that the two participants instinctively chose the most energy-efficient low-intensity pace during the trek. This pattern appears to be similar to that reported by Booth et al. (Reference Booth, Thoden, Reardon, Jette and Rode1991).
Practical implications
Training intervention studies have reported no improvement in LT %VO2max following 45 min of low-intensity exercise (70% HRmax), three times·week−1 for eight weeks, in moderately trained subjects (pre-training V̇O2max of ∼56 mL·kg−1·min−1) (Helgerud et al., Reference Helgerud, Høydal, Wang, Karlsen, Berg, Bjerkaas, Simonsen and Hoff2007), or following ∼70 km of mainly low- to moderate-intensity training (65–82% HRmax), divided into six sessions·week−1 for 10 weeks, in highly trained endurance athletes (pre-training V̇O2max corresponding to ∼70 mL·kg−1·min−1) (Enoksen, Shalfawi & Tønnessen, Reference Enoksen, Shalfawi and Tønnessen2011). However, the results in the present study indicate that more frequent and/or substantially longer low-intensity exercise than typically performed in training intervention studies (Enoksen et al., Reference Enoksen, Shalfawi and Tønnessen2011; Helgerud et al., Reference Helgerud, Høydal, Wang, Karlsen, Berg, Bjerkaas, Simonsen and Hoff2007) may be necessary in practice to enhance LT %V̇O2max when the initial aerobic fitness level is moderate and higher. This observation (increased LT %V̇O2max) can be useful for ski trekkers in particular, but the principle of this finding can also be of value to endurance coaches and athletes competing in prolonged endurance events, such as cross-country skiing, biathlons, distance running and cycling, in which ∼70–85% of the total training volume is performed at low exercise intensities (zone 1, ≤65% V̇O2max/≤75% HRmax) (Seiler & Tønnessen, Reference Seiler and Tønnessen2009; Tønnessen et al., Reference Tønnessen, Sylta, Haugen, Hem, Svendsen and Seiler2014).
Finally, to be able to move as energy efficiently as possible during LIST expeditions, the findings in the present study and those by Booth et al. (Reference Booth, Thoden, Reardon, Jette and Rode1991) indicate that individuals should instinctively set their own pace.
Limitations in this study
Although the two participants clearly expressed that they benefitted, based on their subjective feeling of recuperation, from performing the post-trek tests ∼1–2 weeks after the expedition, it cannot be excluded that slightly larger performance improvements would have been observed if the post-trek tests had been conducted sooner after the expedition (e.g. ∼3–5 days). Furthermore, time-to-exhaustion protocols lasting ∼6–7 min and ∼20–60 min may have coefficients of variation of ∼15% and ∼15–25%, respectively (Currell & Jeukendrup, Reference Currell and Jeukendrup2008). Therefore, although the two participants performed a habituation test prior to pre-testing (thus reducing the learning effect), the performance results in the present study should also be interpreted with caution due to the known relatively low reliability of time-to-exhaustion protocols.
Conclusions
Short-term prolonged LIST can improve ski trek-simulated performance and fractional utilisation of V̇O2max in recreational athletes with high aerobic fitness. Moreover, highly aerobically fit ski trekkers appear to instinctively choose the most energy-efficient pace during LIST.
Acknowledgements
Firstly, the authors wish to thank Nimi and the former CEO of Nimi, Katrine Agnes Hay, for providing the necessary test equipment for this study. The authors would also like to thank Frank Ingjer, Professor Emeritus of Sports Physiology, for professional input during this study. Further thanks go to Torgeir Langholen, Service Director of Timik Medical (Oslo, Norway), for assistance with technical questions about the ergospirometry system Sensor Medics VMax29. For copy editing, the authors wish to thank Paul Farmer of Paul Farmer Translations for excellent assistance. For valuable assistance in preparing the equipment used for weight pulling during the exercise tests, the authors would like to thank carpenter Magnus Nilsson. Finally, the authors wish to thank the two participants for their excellent contribution to the present study.
Funding/Support
Nimi provided test equipment for the present study.
Conflicts of interest
The authors have no conflicts of interest to declare.