

With few exceptions, women are severely under-represented in politics. This deficit of descriptive representation has come under persistent criticism from “critical mass” theory. Elegantly formulated by Rosabeth Moss Kanter, the theory predicts that where women compose less than 15 percent, men’s culture dominates, and women function as mere tokens. They have little influence or agency, are subject to exclusionary and dominance behaviors by men, are perceived as less competent, and are treated according to the negative stereotypes about their gender. Men’s verbal displays turn hyper-masculine with women bearing the brunt. But when women’s percentage climbs well beyond 15 percent and reaches approximately 35 percent, they can begin to make a difference in the culture of the group, and experience more equal treatment. And should women achieve a balance with men, their experience and power improves further still. Or so the theory goes. Footnote 1
Inspired by this theory, the United Nations in 1995 declared a 30 percent female target for its member states. Its formal language states that “the figure of 30 percent forms the so-called ‘critical mass,’ believed to be necessary for women to make a visible impact on the style and content of political decision-making.” Footnote 2 In response to the UN declaration, over 100 countries, as well as various international bodies, have encouraged or mandated gender quotas, as have some states and localities in the U.S. Footnote 3 Similar efforts are being implemented in quasi-public or private domains, such as laws requiring minimal female representation on corporate boards, enacted in Spain, Iceland, the Netherlands, Norway, and France. Footnote 4
Yet studies have not shown a clear positive effect of descriptive representation for women’s substantive or symbolic representation. Footnote 5 Mala Htun and S. Laurel Weldon find that feminist movements and organizations in civil society affect social policy much more than “intra-legislative political phenomena such as . . . women in government.” Footnote 6 Similarly, Karen Beckwith and Kimberly Cowell-Meyers argue that “critical mass theory is both problematic and under-theorized,” its mechanism “unspecified” and the power of small numbers of women “neglected.” Footnote 7 To put it simply, the literature finds that even a small number of women can sometimes matter; at other times, that even 50 percent can fail to matter; and how any of this comes about (or fails to come about) is mostly unknown.
Why do women’s numbers fail to elevate women’s substantive and symbolic representation? Are quotas misguided, and if so, why? Why does the scholarship on descriptive representation find that numbers have no clear effects?
We offer one solution to this puzzle that highlights the interaction of individuals within deliberating bodies. Specifically, we argue that the way in which participants interact while speaking may enhance or undermine women’s status in deliberation, and that numbers affect this interaction, but in combination with rules. Our hypothesis about the interaction of institutional rules and women’s numbers builds on the emerging but under-specified theme in the literature on women’s representation that focuses on the conditioning effect of institutions. Footnote 8 Yet we have little notion of how the process of decision-making matters to the effect of descriptive representation. Institutional features are typically treated in a limited way, consisting primarily of variables capturing the strength of women’s close alliance with strong and secure leftwing parties (i.e., with predominantly male parties in power), a factor that recent rigorous research has found to be weak. Footnote 9 So although the literature on critical mass has been saying that the rules or norms within institutions matter to what numbers do, we have moved little beyond this general insight.
We argue that the process of communication is a mechanism connecting numbers and outcomes. Small numbers matter when institutions include them; large numbers fail when institutions fail to give numbers power. And a way that institutions include or exclude is through the practices of discourse, which build or undermine authority.
This hypothesis represents a new synthesis of three claims in the gender and language literature. First, gendered roles and expectations construct women’s speech as less authoritative, and thus, deliberative bodies such as legislatures, or any type of discursive gathering, will disadvantage women. Footnote 10 We take up the notion that gendered expectations interfere with women’s authoritative speech later on, but for now, we note that this claim is the basis of a robust critique by scholars such as Iris Young and Lynn Sanders of normative advocates of deliberation, such as Jurgen Habermas. Footnote 11 The critics’ concern is that disadvantaged identity groups such as women do not exercise their voice equally with men, and because their discursive styles are different from those of men, are less likely to be listened to or to be regarded as authoritative contributors to the discussion.
The debate matters because the advocates of deliberation are not limited to the ivory tower; they are actively organizing grass-roots deliberations around the globe, in locations as disparate as Porto Allegre, Brazil; British Columbia, Canada; Rajasthan, India; São Tomé and Principe; Benin; and the state of Texas. Footnote 12 But while deliberative democracy is being cultivated in the grassroots, the question of women’s substantive representation in these settings has been wallowing in the backwater. And when scholars do ask when these forums represent women adequately, they often cannot produce a clear answer. In studies of participation in Indian village meetings, for example, a team of researchers has concluded that “it is clear that Gram Sabhas (village meetings) are not a forum for women in their current form,” but did not locate variables to explain this. Footnote 13 Similarly, Pamela Conover, Donald Searing, and Ivor Crewe included controls on a host of possible variables that could explain why British and American women report engaging in fewer political discussions than men, but the gender gap persisted nonetheless, remaining largely unexplained. Footnote 14
Frank Bryan, one of the few scholars to rigorously study this question in the US, found that the higher women’s percentage in the deliberating body, the lower is their share of the speakers, and has recently declared, “for the life of me and after thirty years of research, I remain stumped when it comes to predicting women’s involvement” in public meetings. Footnote 15 Thus, deliberative bodies tend to be places of gender inequality, where even high descriptive representation does not consistently erase their low substantive representation. Gendered expectations of women’s low authority present an obstacle for women’s substantive representation at elite and grassroots levels.
A second strand we weave here is the notion that the way language is used in political discussion can reinforce women’s lower status in the group and their authority deficit in the deliberation. Footnote 16 Language can foster or undermine the standing of discussion partners, depending on how it is used. This, too, is a theme in critical writings on deliberation, which rightly criticize advocates for initially limiting good deliberative speech to discourse said to disadvantage women and devalue their distinctive forms of speech. Footnote 17 We focus on one way in which the social uses of language affect women’s authority deficit during deliberation.
Third, we take up the notion that the rules of interaction and the gender composition of the deliberating body jointly affect the degree to which speech elevates or depresses women’s authority. Footnote 18 Our “interaction hypothesis” explains why numbers alone do not help women; why rules alone do not integrate social identity minorities into the decision-making body; and why the nature of interaction between speakers is a missing link in political science theorizing about gender, representation, decision rules, and deliberation.
Specifically, we argue that descriptive representation, in combination with a decision rule, shapes women’s authority by affecting women’s and men’s relative experience of other members’ engagement with their speech. In that sense, gender is not only an individual difference between men and women, but also a socially-negotiated characteristic of the political situation, and is shaped by political rules of interaction among individuals and by social structures of group composition. The implication is that descriptive representation can affect not only concrete policy outcomes, but also the implications of gender for authority, by neutralizing sex as a marker of low authority.
The foregoing leads us to focus on a neglected yet important form of representation, which we label “authoritative representation.” We differentiate this concept from other types of representation, well discussed in connection with gender inequality by Jane Mansbridge. Footnote 19 Descriptive representation is the physical presence of the represented in decision-making. Substantive representation is the articulation of and influence for the interests, needs, concerns, values, and perspectives of the represented. Symbolic representation is the perception that the represented can and should govern. Authoritative representation is any feature of communication among decision-makers that affects their authority during the decision-making process. By authority we mean the expectation of influence.
Authoritative representation is similar to symbolic representation in that both deal with the perceived capacity of the group to govern. But it differs from symbolic representation in being a quality of the process of representation, not a quality of either the represented or the representative, and in being constructed during the interaction among decision-makers. Symbolic representation is a perception and thus is something that emerges at the end of a process. Furthermore, it is a trait of a social group. Authoritative representation is a feature of the process of decision-making and in turn may produce high or low levels of symbolic—and substantive—representation. The more that the features of the decision-making process signal and emphasize women’s status in the decision-making, that is, the more authoritative representation the process provides to women, the more symbolic and substantive representation women will have as a consequence.
To illustrate how this process of authoritative representation plays out in actual political settings, consider Laura Mattei’s description of gendered communication in the US Senate. Footnote 20 Mattei has conducted the most in-depth analysis of language patterns to date in her study of female versus male witnesses testifying before the all-male Senate Judiciary Committee on the nomination of David Souter to the Supreme Court. She found that relative to male witnesses, women were given less speaking time, were asked more challenging questions, were asked to bolster their testimony with more evidence, and were denied the floor when they attempted to interrupt. Moreover, they experienced proportionately more hostile interruptions. Female witnesses interrupted the senators back, but at a rate of one given to three received, while male witnesses, by contrast, responded at a rate of approximately one-to-one. Footnote 21 Finally, when men interrupted Senators, they were given the floor to continue more often than women. This pattern was characteristic of both Democratic and Republican senators (all male), and so cannot be explained away as partisan rather than gendered. Footnote 22
We go beyond this case study, and similar others, in formulating a theory of authoritative representation: what it is, what are some of its causes, and what are some of its consequences. We also go beyond the literature in offering a more systematic test of the effects of women’s numbers. To test the proposition that women’s authority rests on social interaction, and that the interaction is shaped by rules, we conducted an experiment in two American cities (whose generalizability we discuss at the article’s end). The cities differ in many characteristics, including their level of liberalism or conservatism, their location, and the religious traditionalism of their population. We use a large number of groups and link individual-level speech with pre- and post-discussion attitudes. We randomly assigned the group’s gender composition and decision rule. We asked the group to deliberate and decide the level of economic redistribution that should apply in society and also to their own earnings in the study. As we report elsewhere, we found that under majority rule, women’s high numbers elevate women’s participation and perceived influence in the group. Footnote 23 But under unanimous rule, women do rather well even as a small percentage, and furthermore, increasing women’s numbers under unanimity does not increase their participation or influence, and sometimes decreases it. Footnote 24 The worst condition for women’s participation and influence is the one most prevalent in the world—majority rule with few women. We seek to explain this conditional effect of numbers and rules by examining the patterns of authoritative interaction.
We find that numbers and rules enhance or detract from women’s authority by providing immediate affirmation or rejection from other members while women speak. When women are few and the group uses majority rule, women are singled out for a high ratio of negative to positive interruptions. But in groups where either numbers or rules elevate women’s status, women encounter few hostile interruptions or more positive interjections. Group interaction can thus affect women’s status by providing interruptions that enhance the speaker’s power or that create rapport for women. Footnote 25
The Meaning of Interruptions
Status
The act of speaking provides an opportunity to establish authority and status as a valuable member of the group, but the group’s reaction is what affords the speaker this status. Interruptions are a communication signal. People signal their status and others’ through their use of such communication cues, and they glean status from others’ signals. Footnote 26 Individuals independently verified as, or made to be, the more dominant or confident members of a conversation use a constellation of verbal forms that signal their higher status: they speak more; they speak earlier; they may initiate and complete more negative interruptions during a discussion, especially regarding a conflict; and they may issue fewer positive interruptions to their subordinates than subordinates issue to them. Footnote 27 Interruptions are correlated with volubility, but carry a clearer signal of individual agency than volubility, which may indicate pure sociability. And they may have a particularly negative, silencing effect on lower-status groups, since those groups’ authority is fragile and disagreements they may direct at high-status members tend to be countered with aggressive reactions or backlash. Footnote 28 Differences in patterns of interruptions are thus an indicator of, and reinforce, status inequality in conversation.
Because men have more authority than women do in society, they tend to use communication acts that symbolize high status, while women tend to employ those that mark low status. Footnote 29 A meta-analysis of 43 studies confirms that interruptions conform to a pattern of gender hierarchy: men negatively interrupt more than women, especially in groups. Footnote 30 Other studies confirm that men issue negative interruptions more often and positive interruptions less often than women, and talk longer. Footnote 31 Moreover, because women lose influence when they act too assertively, and may intuit this fact, women may be more likely than men to interpret disagreements they receive as a negative signal of their authority. Footnote 32 Kristin Anderson and Campbell Leaper also found that women are three times more likely than men to yield when negatively interrupted in a group discussion on a gender-neutral task. Footnote 33 Gender differences of this kind are sharpest when the task involves a domain considered masculine. Footnote 34 Politics is such a domain; women are viewed, and view themselves, as less confident and expert about politics, regardless of their actual level of expertise. Footnote 35 Because women are more likely to enter a formal discussion of politics with a lower sense of authority, they may be more subject to, and more affected by interruptions. Footnote 36
Social Rapport
Speech is not only a route to achievement and power; it can also establish social connection. Footnote 37 Positive interjections can be a form not only of instrumental cooperation and agreement, but of affirmation of and rapport with others.
Because they enter with less authority, women may be especially affected by a lack of affirmation, and thus by an absence of positive interruptions. Women sometimes complain that when they do speak, people don’t listen. A female doctor interviewed about her service on charitable committees summed it up this way: “You get your cues right away. I will make comments about things, but it seems that no one hears me or no one agrees with me. And then I clam up" [Emphasis ours]. Footnote 38 The absence of positive acknowledgment may signal to the speaker that their speech—and they as a member—lack value. As one interviewee told Mansbridge after a town meeting, “if you don’t say what they want to hear you’re not even acknowledged”; Footnote 39 that is, lack of acknowledgement may be taken as indirect negativity toward the speaker as a group member, not just toward the specific content of their speech, and have a similarly depressive effect. The positive attention of other members may thus be important, perhaps especially to women. One way that speakers can communicate this attention is to offer positive interjections, and these may have a stronger effect on women’s perceived influence than on men’s.
The Effect of Numbers on Interruptions
Only a handful of studies have examined the effect of group gender composition on interruptions, and they are limited by small group N and inconsistent findings. One study assigned university students to a six-member work group, and found that majority-male groups engaged in more negative interruptions than other groups. Footnote 40 Similarly, Elizabeth Aries, Conrad Gold, and Russell Weigel found that dominant-personality women interrupt negatively when interacting in all-female groups but not in mixed-gender groups. Footnote 41 Another controlled study, however, found only limited composition effects. Footnote 42 These studies use only between 20 and 36 groups.
Observational studies of political settings are also few and also involve a very small number of groups, lacking the ability to contrast across compositions. They do, however, tend to find that men use negative interruptions especially against women and that this correlates with other indicators of women’s lower status in the discussion setting. We discussed earlier the findings in Mattei’s study of the all-male US Senate Judiciary Committee. Similar findings are presented in the pioneering study of Lyn Kathlene. Footnote 43 In other words, in heavily masculine settings, negative interruptions may be used by men to assert their authority and to detract from women’s. Again, however, these conclusions are highly uncertain, because they are based on very small samples.
As we noted, interruptions fulfill two distinct functions, and power is only one of them; the other is social solidarity and interpersonal support. Footnote 44 Women tend to perform this function more than men, but gender composition matters, as women do so especially in interacting with other women. Footnote 45 Thus, descriptive representation may elevate the rate of positive and depress the rate of negative interruptions of female speakers.
Decision Rule and Interruptions
However, none of the studies we have just reviewed addresses the group’s rules and procedures. No study examined the effect of rules on speech, much less on the authoritative use of speech acts. We argue that the level of gender inequality in speech acts depends on the group’s procedures, specifically, the group’s decision rule, which operates jointly with gender composition.
Decision rules can create norms of decision-making that apply to the deliberation preceding the decision. These norms may either over-ride or boost the effects of gender on authority. Specifically, under unanimous rule, everyone must agree, and this expectation in turn creates norms of consensus and cooperation. Footnote 46 Mansbridge’s study of naturally-occurring groups found that “a consensual rule can actually create unity” Footnote 47 and, more importantly for our argument, equal respect. Footnote 48 By implication, when each person matters, then every voice is given adequate respect, even when that voice comes from women. Footnote 49 The consensual norm created by unanimous rule may over-ride the expectation of deference with which women tend to enter the discussion, and this benefits women when they are few. Consistent with this notion, a large previous study of political discussion in groups reports that women’s floor time equals men’s when women are few and the group is instructed to use unanimous rule. Footnote 50 Consequently, when women are few, we should see that the number of negative interruptions directed at women declines, and positive interruptions increase, under unanimous rule relative to majority rule.
However, unanimous rule does not create inviting dynamics across the board. Footnote 51 As reported elsewhere, when women predominate, men are more talkative and perceived as more influential relative to groups with few women and unanimous rule, and to groups with many women and majority rule. Footnote 52 We may find, then, that the inclusive dynamic that women experience under unanimous rule applies only when women are the minority. We hypothesize that unanimous rule decreases negative interjections and increases positive interruptions toward women only when women are few.
Finally, majority rule can create a dynamic of conflict and individual agency. Footnote 53 We hypothesize that majority rule creates a high level of gender inequality in interruptions when women are few and thus occupy a low status. When women have low status in the group by dint of low numbers, the conflictual norms of majority rule imply that whoever predominates gets to dominate. This may produce conditions where men engage in assertive speech acts, and where women have difficulty in taking and retaining the floor. Specifically, under majority rule with few women, relative to the other combinations of numbers and rule, we may see high levels of negative interruptions directed by men at women; when negatively interrupted, women may not finish their thoughts as often as men; and women may receive fewer positive interruptions.
Data and Methods
To explore these hypotheses, we fielded a fully crossed 6x2 between-subjects design, randomly assigning individuals to a five-member discussion group composed of between 0 and 5 women, and randomly assigning each group to unanimous or majority rule. We randomly assigned compositions to dates and times, and subjects signed up to attend a session not knowing its assigned composition. This ensured that composition did not cluster on particular days of the week, and participants had a roughly equal probability of being assigned to a composition, satisfying the random assignment assumption. Footnote 54 Randomization checks and propensity score analyses show that groups are equivalent on relevant covariates.
We recruited students and community members at two different sites—a liberal, small town on the mid-Atlantic coast, and a conservative, medium-sized city in the Mountain West. We control on site, though the basic results are unchanged without it. Because race likely introduces powerful statistical interactions, we ran the study only with non-Hispanic whites, a choice we further address in the conclusion. We have 470 individuals in 94 groups (refer to supplementary Appendix table A1). Footnote 55
We adapted the protocol of a study by Norman Frohlich and Joe Oppenheimer in which participants were told that they would be performing tasks to earn money, and that the amount they actually received would be based on their group’s collective decision about redistribution. Footnote 56 After privately filling out a pre-treatment questionnaire and receiving information about different principles of income distribution, individuals in our study sat with their assigned group around a table. They were instructed to conduct a “full and open discussion” to decide collectively (by secret ballot) on the “most just” principle of redistribution and to set a poverty line in dollars. Footnote 57 At the time of the group deliberation, participants did not know the nature of the work task. All instructions other than the decision rule were identical across conditions. On average, groups discussed for 25 minutes (SD=11). Following Frohlich and Oppenheimer, we instructed participants to reach a group decision that would not only apply to themselves, but also could apply hypothetically to society, in order to generalize beyond the lab to the decisions people make about redistribution in politics. Participants then returned to private computer stations and completed the protocol, including assessing the group’s functioning, performing tasks to earn money, and answering questions on their attitudes. We recorded and transcribed each individual’s speech and matched it with their individual characteristics. Footnote 58
Measuring Interruptions
We operationalize an interruption as an overlap in two speakers’ words that lasts at least 0.5 seconds, in which the first speaker spoke for at least 1.5 seconds and the interrupting speaker spoke for at least one second. Footnote 59 That is, the speaker must clearly hold the floor, and a second speaker clearly attempts to take the floor. Our software classified each speaking turn as an interruption turn based on these criteria. We then checked these interruptions by human coding. Footnote 60
We defined interruptions as positive, negative, or neutral, following established definitions and building on Jennifer Stromer-Galley’s coding. She and others define a positive interruption as supporting, agreeing with, or adding to the first speaker’s comment. Positive interruptions are a way of supporting the original speaker without detracting from that speaker’s effectiveness. Accordingly, we defined a positive interruption as either expressing solidarity with, affection, or support for the speaker or the speech, or an interruption that completes the prior speaker's thought in the same direction without disagreement or contradiction. Footnote 61 Positive interruptions often begin with “I agree,” “yeah,” and so on. Refer to Appendix F for coding details.
Negative interruptions are a power play. They represent one member’s attempt to seize the floor from another to express opposition or deprecation. A negative interruption disagrees, raises an objection, or completely changes the topic. A negative interruption may begin with phrases such as “well,” “but,” “however,” “not,” “I sort of disagree,” “I'm not sure about that,” or “I don't know.” Not all negative starts are a negative comment, however. It is negative if it changes the topic without expressing understanding of the previous turn; does not use acknowledgment cues; or does not refer to the prior turn in any way, implicit or explicit. Footnote 62
We also coded the interruption as elaborated or unelaborated. We defined elaboration as explaining one’s meaning. For positive interruptions, this entails adding content rather than simply echoing what is being said by the current speaker. For negative interruptions, this means giving reasons for one’s disagreement. This is a measure of direct engagement by one speaker of another, and reflects a measure of quality of deliberation. But it is also a measure of power; a negative interruption that is not elaborated represents a form of dominance behavior; conversely, a positive interruption that is not elaborated represents pure support for the speaker, and thus anchors the other end of the conflict-support continuum. Footnote 63
For reliability, one coder coded all the discussions, and another coder independently coded 248 interruptions, 10 percent of the total. The percent agreements and Krippendorff’s alphas (in parentheses) are as follows: for positive, negative, and neutral interruptions, 83 percent (0.65), 79 percent (0.53), and 88 percent (0.43); for elaborations, 75 percent (0.50). The alphas are lower than desirable, but the standards in the literature come from text that is much more orderly and clear, such as interviews, speeches, or structured forums where speakers take clearly delineated turns, and attend to grammar, which makes positive or negative content much easier to discern. Footnote 64 We view these alphas as satisfactory considering the challenges of coding five-member informal interactions where turns are sometimes not clear and grammar is often murky. We note that the effects on these measures are no less trustworthy as a consequence of lower alphas; in fact, the effects must be powerful in order to cut through the noise of these measures.
For the whole sample, the average group’s positive interruptions are the most numerous, negative ones less so, and neutral interruptions are very few (refer to figure A1). Elaborations are much more likely for negative than positive interruptions, but summed across the valences they are fairly common in the average group (when pooling positive, negative, and neutral, the average number of elaborations per group is 19.5). However, we are concerned with variations across conditions and by gender, as we will explain.
We create two measures of interruptions. One is the negative proportion of all interruptions received. Footnote 65 This measure holds constant the act of interrupting to focus on the balance of negativity and positivity of the interruption. It has the virtue of not conflating the likelihood of speaking or even of interrupting with the tenor of the interruption. Also, neutral interruptions are very few and have a lower coding reliability, and this measure sets them aside. As a second measure, we use the proportion of the person’s total speaking turns that were interrupted. Footnote 66 We use separate measures for the negatively and positively interrupted proportion of the speaker’s speaking turns. Footnote 67 This measure is not as clean as our first measure, but it includes individuals with zero interruptions received, while the first measure omits them.
We must guard against the possibility that the interrupting behavior of men (or of women) changes as the number of men (or women) changes simply because there are more men (or women) who could issue interruptions. To account for this spuriousness, we constructed our interruption measures by calculating the average behavior of the interrupters of each interrupted person. Thus, when we ask if men increase the interruptions they issue to women across the conditions, for example, we are looking at the average interruptions issued by males to each female.
We use OLS regression with robust clustered standard errors to account for the interdependence of observations within the deliberating group. We control on location, the interrupted person’s egalitarianism, and the number of egalitarians in the group, so that we can get at the pure effect of gender and gender composition rather than of political attitudes that correlate with gender but that are more peripheral to it. Footnote 68 As needed we add controls for the quantity of the person’s speech—typically, the speaker’s number of speaking turns. Where the dependent variable is skewed and concentrated at zero, we replicate the main results with alternative estimators, typically Tobit (refer to Appendix B). We also replicate the main results with a fully-saturated control model that includes a term for the interaction of decision rule and number of egalitarians (refer to Appendix C). That interaction term is never close to statistically significant, while the main and interactive effects of number of women remain fairly steady. We find similar results when we replace egalitarianism and number of egalitarians with liberalism and number of liberals (refer to Appendix D). Finally, we provide some raw results as well.
The Balance of Negativity
We begin with our first measure of authority in speech, the negative proportion of interruptions received.
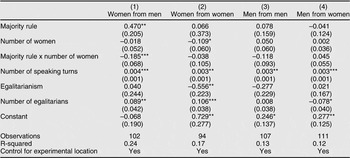
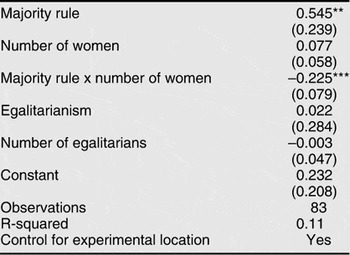
Table 1 displays the results of an OLS regression with the controls listed above, as well as a control for the interruptee’s number of speaking turns, for mixed-gender groups, since we expect rule to matter more consistently when women interact with men. We estimate the effects of the conditions separately for each gender combination in the interruption dyad: women interrupted by men, women by women, men by men, and men by women. The first column shows that women are more likely to be negatively interrupted by men as a minority under majority rule than as a minority under unanimous rule (the coefficient on majority rule is positive and predicted values from the model show that the difference across rules is significant at p<.05), so unanimous rule protects women when they are few; but this effect of rule erodes as women’s numbers increase (the negative interaction term for majority rule and gender composition). Footnote 69 Put differently, numbers help women only under majority rule, and rule helps women only when they are few.
Negative proportion of men’s and women’s interruptions received, separately by male and female interrupters, mixed groups

Robust standard errors in parentheses
*** p<0.01, **p<0.05, *p<0.10
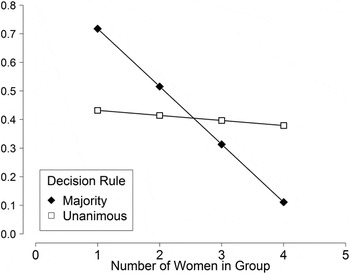
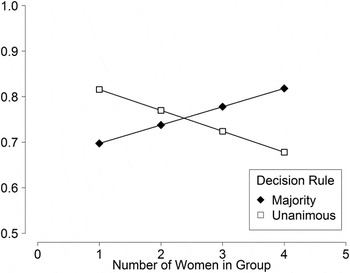
Figure 1 displays predicted values from this regression (holding all other variables at their observed values). When women receive an interruption from men, that interruption is much less likely to be negative than positive as their numbers grow, but only under majority rule. The magnitude of the effect of composition under majority rule is quite large: negative comments make up anywhere from approximately 70 percent (at worst) to less than 20 percent (at best) of the interruptions women receive from men. Gender composition shifts the tone of men’s direct engagement with women from clearly negative to highly positive. But it does so only under majority rule. Women do not enjoy the power of numbers under unanimous rule; under that rule, composition makes no difference. Finally, unanimous rule does help women in the minority relative to majority rule.
Negative proportion of negative and positive interruptions received by women from men, mixed groups

Some illustrations can give a flavor for how these patterns of interaction play out. In a majority-rule group with only two women (Example 1), one participant begins by acknowledging that he has spoken too much and tries to offer the floor to a woman. But almost immediately, he jumps back in, interrupting the woman repeatedly.
Participant C goes on to speak for nearly a minute without interruption. Thus, Participant D’s repeated, polite attempts to gain the floor—and to offer positive reinforcement to the other participants—are ultimately unsuccessful. She cannot utter a full sentence without interruptions from the men in the room, who are focused on “their problems” with the principles they are considering.
Contrast the dynamic in that majority-rule group with what happens in a unanimous rule group with only one woman (Example 2). In this group, the group members engage in a series of positive interruptions, each of which reinforces what the previous person has said.
The dynamic could not be more different from what occurred in the majority-rule condition. The group laughs and jokes together, and the lone woman in the group repeatedly receives positive reinforcement about the points she is attempting to make. The sense of group solidarity is palpable, and Participant E is a full participant, sometimes finishing the thoughts of the men in the room and even ending this exchange by asking a question on behalf of the other group members.
So in conditions that give women the power of numbers or that protect them when they are few, women fare better. These settings serve to protect women by curtailing men’s dominant speech forms. This protection is clearly needed, as can be seen by the high level of men’s negativity toward women in the condition where women’s status is lowest—when women are a small numerical minority under majority rule. Unanimous rule protects minority women from this high negativity, though women do best as a majority under majority rule.
The effects apply only to men’s interruptions of women. Women direct a somewhat lower negative proportion of interruptions at other women as their numbers in mixed-gender groups grow, but this is unaffected by rule (table 1, column 2). Footnote 70 Finally, the negativity experienced by men is unaffected by the conditions (columns 3 and 4). Footnote 71 Neither men nor women alter their behavior toward men as men’s proportion shrinks. (figure A2 shows the same patterns with the raw proportions.)
These results represent an important validation of our argument that the mechanism accounting for women’s participation and representation in group discussion is women’s status. And that status is driven by men’s behavior toward women—not their behavior toward people, and not people’s behavior toward women, but specifically, men’s behavior toward women. Men take a dominant posture toward women in the conditions where we expect women to have low status; and by the same token, men undergo a drastic change when women’s status improves—they become far less aggressive toward them.
In sum, the composition and the procedures of deliberation jointly shape women’s authority during deliberation. Where women’s status is lowest—under majority rule and few women—over two-thirds of the interruptions women receive from men are negative. Where women’s status is likely to be highest—as majorities under majority rule—that proportion more than reverses, and over 80 percent of the interruptions they experience from men are positive. Men’s experience does not shift; only women’s does. And only men’s interruptions of women undergo this shift. What the conditions of deliberation do, then, is to shift men’s displays of power toward and affirmation of women. That is, interruptions appear to function as an indicator of women’s shifting status in the group, and men significantly affect that status.
Positive or Negative?
Are these patterns a result of a wave of negative interruptions, or of a steep decline in the number of positive interruptions, or both? We examine the proportion of the person’s speaking turns that received an interruption, separately for negative and positive interjections. Footnote 72
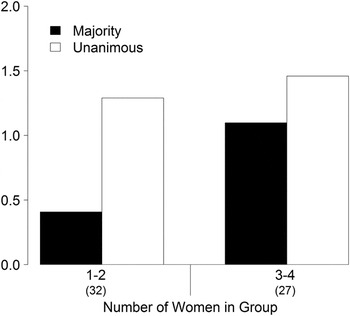
We begin by comparing women to men. We take the proportion of a person’s speaking turns that received a positive interruption, and calculate the group’s average for women divided by its average for men, for mixed-gender groups. Figure 2 shows the raw percentages, grouping the minority conditions together and the majority conditions together, to increase the statistical power to detect differences between them.
Ratio of women’s to men’s positively interrupted speaking turns, mixed groups (raw)

Figure 2 makes a number of points. First, the conditions shift the likelihood that women will receive a positive interruption. Second, minority women under majority rule are much worse off than other women or men. These women receive positive affirmations at less than half the rate enjoyed by men in their group, at 40 percent of men’s, to be exact. Third, this visual impression is confirmed by statistical significance tests, for the most part. The effect of rule on groups with minority women is statistically significant: minority women are far more disadvantaged than men in their group under majority than unanimous rule (p = 0.01, two-tailed group-level). Also, as expected, the effect of composition on groups with majority rule is significant: under majority rule, majority women do much better than minority women, as compared to men in their group (p = 0.005, two-tailed). Third, as expected, composition does not have this effect with unanimous rule—increasing numbers of women does not matter under unanimous rule (p = 0.73). The final test fails: the effect of rule on majority-female groups is not statistically significant, contrary to our expectation, indicating that majority rule is no better than unanimous rule for majority-female groups. One other finding (shown in figure A3) also underscores the unusually bad situation women face when they are a small minority under majority rule. Lone women under that rule issue one of the highest rates of positive reinforcement of any gender group under any condition. Yet they receive the lowest rate of affirmation in turn. These women receive only about one-quarter of the affirmations that lone women get with unanimous rule, and about half of the affirmations that lone men receive under majority rule. Footnote 73
These tests largely support our basic argument: what the conditions do for gender equality is to correct the high level of inequality that minority women experience under majority rule. This can be achieved either by introducing unanimous rule in groups with few women, or by increasing the number of women and keeping majority rule. Majority rule is good for majority women, while unanimous rule is good for minority women, relative to the men in their group.
In sum, women’s inequality relative to men in the group is marked, but only where their status is lowest—as a minority under majority rule. It manifests especially in the gap in affirmations one experiences when one is speaking. Unanimous rule reverses the inequality in the experience of support regardless of women’s numbers. So do numbers.
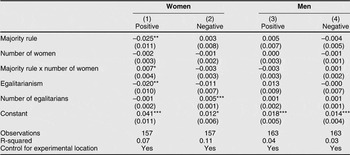
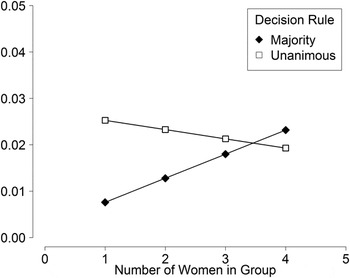
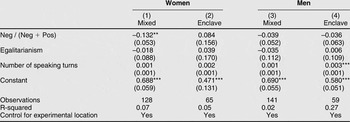
To test these hypotheses more rigorously, table 2 presents regressions of the proportion of speaking turns that are positively interrupted, and those that are negatively interrupted, separately for interrupted men and women. Footnote 74 The only significant coefficients are for women’s positively -interrupted proportion of speaking turns (column 1), and they show the expected pattern: women do worst as a minority under majority rule, and improve their situation as their numbers rise under that rule. Figure 3 displays these results.
Proportion of turns receiving positive and negative interruptions, mixed groups

Robust standard errors in parentheses
*** p<0.01, **p<0.05, *p<0.10
Proportion of women's speaking turns receiving a positive interruption, mixed groups

Figure 3 shows, as expected, that women’s positively-interrupted proportion of speaking turns increases as the number of women rises under majority rule. Again, we see the difference that rule makes to the effect of numbers—composition does not have an effect under unanimous rule. There are no significant effects on the negative interruptions received by women (table 2, column 2). The rule and rule-composition interaction coefficients for negative interruptions do run in the opposite direction from those in the positive column, but those changes are not significant. Men’s experience of interruptions is unaffected (columns 3, 4). Footnote 75 In sum, composition helps women receive increased positive reassurance, but only under majority rule, and unanimous rule protects minority women. Men are not affected, further indicating that the pattern of interruptions acts on women’s authority but not on men’s.
Overall, we have now seen that settings that empower women do so by increasing the positive encouragement they receive. Footnote 76 Relative to other women, and to men in their own group and in other conditions, women receive far fewer encouragements when in the minority under majority rule. In this sense, unanimous rule protects minority women. There, women receive concrete evidence that they are indeed being listened to. Similarly, we now understand why majority rule is bad for minority women—they seldom hear encouragement when they speak. The combination of a few negative and sparse positive feedback, deceptively neutral and inconsequential, represents a powerful dose of invalidation for women—and not for men.
Elaborated Interjections
Next we examine whether the interjections come with elaboration on the current speaker’s comments. Elaboration is an indicator of the quality of discussion—more elaboration enriches the discussion by adding content that is not currently articulated. In addition, more relevant to our study, elaboration added to a negative interruption softens the interruption; conversely, a negative interruption without elaboration tilts more toward pure hostility rather than toward conflictual engagement. However, elaboration of a positive comment works (moderately) the other way—elaboration allows the interjector to add their own thoughts and thus detract attention from the speaker, while unelaborated positive interjections simply support the speaker. So elaboration on the positive means a moderate loss of power by the original speaker, while elaborations on the negative protect the speaker’s authority. Consistent with this interpretation, our initial look in figure A1 revealed that negative interruptions are more likely to be elaborated than are positive interruptions. This tells us that negative interruptions that are not elaborated are probably perceived as hostile and the elaboration is meant to soften them. We assume that elaborating on the negative is an attempt to soften the hostility of the interruption and is an indicator of respect to the interruptee.
Accordingly, we divide elaborations into negative and positive and examine them separately. We want to see if a rise in women’s status from rule and numbers increases the elaborated proportion of negative interruptions issued to women, and decreases the elaborated proportion of positive interruptions women receive.
The familiar interaction pattern comes through cleanly in Figure 4, which shows the elaborated proportion of negative interruptions received by women from either men or women. The figure shows predicted values from a regression in table A3 (column 1). Footnote 77 Women receive more respect from those around them as their status rises. Rising numbers alone are no guarantee of greater respect; women’s numbers only help under majority rule.
Elaborated proportion of negative interruptions received by women from men and women, mixed groups
Note: Based on predicted values from table A3, column 1.

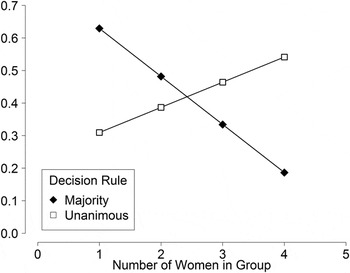
When we examine these effects separately by each gender combination in the dyad, we find one model with effects even approaching significance—and that is for men positively interrupting women. Table 3 shows that the positive interruptions women receive from men are much less likely to be elaborated in conditions where women have higher status—the familiar interaction effect we find throughout our analyses shows up here and is highly significant. We also see the protective effect of unanimous rule for minority women. Footnote 78 Figure 5 shows the predicted values from the model in table 3 and clearly illustrates how men change their elaboration behavior as women’s status increases. Under majority rule when women’s status is the lowest, nearly 63 percent of the positive interruptions they receive from men are elaborated; this decreases to about 19 percent when women are at their strongest. Similarly, women receive more positive elaborations from men as the unanimous rule’s protective effect weakens.
Elaborated proportion of positive interruptions to women from men, mixed groups

Robust standard errors in parentheses
*** p<0.01, **p<0.05, *p<0.10
Elaborated proportion of positive interruptions received by women from men, mixed groups only

In sum, women receive a more polite form of disagreement when their status is high (though this effect only approaches significance); and in such settings, they also receive considerably more unambiguous support when interrupted, specifically from men. Using a positively-worded statement when interrupting a speaker is a standard form of politeness that saves face and pre-empts conflict. But it can be a means to achieving an instrumental end. A polite maneuver designed to take the floor for oneself serves the goal of articulating one’s own view. Men are much less likely to use such polite means to assert their thoughts during women’s floor time as women’s status rises. Put differently, men are more likely to simply affirm women rather than to affirm them while taking the floor for their own thoughts. That only women experience this rise in simple support, while men do not, suggests that women’s shifting status is at work. Furthermore, men are the ones shifting their behavior, and do so only in addressing women. This again supports the notion that the explanation lies in men’s recognition of women’s status. Men are the ones instantiating women’s rise in status in the group.
Overall, then, we found a number of ways in which women’s numbers and the group’s rules—our indicators of women’s status—shape women’s experience of authority. First, women receive fewer positive interruptions when their status is low, and thus experience a high negative-to-positive balance of interjections, particularly from men. Second, what positive interruptions they do receive are more likely to include elaborations that involve intrusions upon their floor time, again particularly from men. Third, the negative signals directed toward women are more likely to be hostile—raw expressions of disagreement not accompanied by any attempt to soften the comment with further elaboration, from both men and women. It is not just that women are receiving fewer positive interruptions in conditions where they have low status (though that’s important); it is also that the positives are less affirming and the negative signals are more negative.
The Effects of Interruptions
Next, we ask whether the balance of positivity and negativity is associated with other indicators of authority, measured after discussion. Do interruptions have an effect on perceived influence in the eyes of others? The conditions of deliberation affect the influence of deliberators, as measured by the number of other members who chose a given member as “the most influential member of your group during the group discussion” (ranging from 0 to 4). We found there that the more women, the more likely is the average woman to be chosen as most influential—but only under majority rule. The effect of composition reverses under unanimous rule, where the average woman is more likely to be seen as influential when women are few than when they are many. Now we can see if interruptions help explain these patterns of influence. Footnote 79
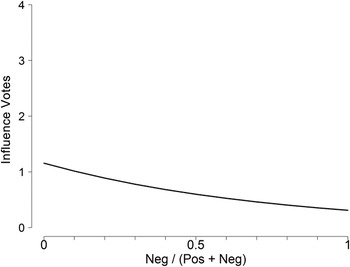
Figure 6 displays the effects from panel A of table 4. That table shows the negative binomial regression estimates of the effect of the person’s negative balance of interruptions received on others’ ratings of that person’s influence in the group, controlling on talkativeness, for both mixed-gender and enclave groups. The figure and table show that for women especially, the higher their balance of negative interruptions, the fewer the influence votes they receive. The figure shows that as the proportion of negative interruptions moves across its range, the perceived influence of women in mixed-gender groups drops by over two-thirds. The effect is similar in all-female groups, but much smaller for men, whether in mixed or all-male groups.
Effect of negative interruptions on perceptions of women’s influence, mixed groups
Note: Predicted values from table 4, panel A, column 1.

Panel A. Effect of negative proportion of interruptions received on others’ ratings of speaker’s influence, all groups

Note:
Note: Coefficients from a negative binomial model
Robust standard errors in parentheses
*** p<0.01, **p<0.05, *p<0.10
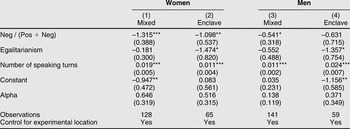
Panel B. Effect of negative proportion of interruptions received on self-rating of speaker’s efficacy, all groups

Robust standard errors in parentheses
*** p<0.01, **p<0.05, *p<0.10
It seems, then, that women’s authority is especially affected by the experience of affirmation versus hostility in conversation. The conditions of deliberation that cause male members to negatively interrupt women without providing significant positive feedback also cause women to lose standing as deliberators. What groups do while interacting can lower or raise women’s ability to make valued contributions to the collective. Footnote 80
And what about participants’ sense of their own influence? The results in panel B of table 4 show that on the key measure of “my opinions were influential,” the negative balance of interruptions again matters. A higher balance of negative interruptions is associated with lower perceptions of women’s self-efficacy in discussion (column 1), but not with men’s (columns 3 and 4). Furthermore, the effect on women applies only when they interact with men; when we examine all-female enclaves separately, the effect decreases and loses statistical significance (column 2). Women’s sense of their contribution to the group depends on the balance of interjections they receive, but not when they are in all-female groups. One of the functions of women’s enclaves, then, is to take the sting out of other people’s responses to one’s opinions. Men do not need male enclaves to be able to brush off hostility or the absence of approval.
Finally, the effect on women’s rating of their own influence holds when we replace the negative balance with the positively interrupted proportion of speaking turns (b = 2.6, SE = 0.85) but not with the negative proportion of turns (the effect is 0.71, SE = 1.26, the wrong sign and not significant). Footnote 81 A few negative comments do not deter women as long as they also receive a good number of positive reinforcements. Women need positive validation while they speak in order to feel that they matter; men do not. The importance of the positive in communication is underscored by the fact that if the message is positive frequently enough, the negative becomes irrelevant.
A formal test of mediation confirms the basic result. Footnote 82 The mixed-group conditions affect women’s influence—in their own eyes and in the eyes of others—in part through their effect on the negative proportion of interruptions received (refer to table A4). The conditions substantially affect the balance of negativity directed toward women, and it, in turn, affects women’s authority. In sum, the relative negativity one receives is a crucial factor in women’s—and others’—sense of their influence. The conditions of discussion shape the kinds of social interactions women experience, and those interactions can elevate or depress women’s authority.
Positive interruptions play a particularly helpful role for women who entered the discussion with low levels of confidence in their ability to participate. Footnote 83 We can ask how the dynamics of discussion affect women with varying levels of confidence. Pooling across all mixed-gender conditions, we find that for both low- and high-confidence women, a higher proportion of positive interruptions is correlated with increased talk time during the discussion and more influence votes from other members of the group afterwards (table A5). But positive interruptions also yield a unique benefit to low-confidence women, increasing their self-rated sense of efficacy at a higher rate than that of high-confidence women (the difference-in-differences is significant at p<.09, two-tailed test; table A6). Footnote 84 Put differently, confidence moderates the effect of positive interruptions on feeling that one’s opinions influenced the group’s discussion and eventual decision. Footnote 85 When they receive few positive interruptions, women with low pre-deliberation confidence report lower levels of post-discussion efficacy than those who entered the discussion with more confidence. But when they receive more encouraging feedback in the form of a higher rate of positive interruptions, low confidence women equal and even surpass high-confidence women in feeling that their opinions helped to shape the group (figure A4). Footnote 86 This effect holds only for mixed-gender groups. In all-female enclaves, efficacy is unaffected by positive interruptions.
Positive interruptions are thus especially important for women who entered the discussion harboring some concerns about their ability to participate effectively, and only when they interact with men. Strong positive signals during the discussion provide a substantial boost to the post-discussion efficacy of those women, which they appear to need more than others do. By comparison, positive interruptions have no effect on the efficacy of men, regardless of their level of pre-discussion confidence. Footnote 87
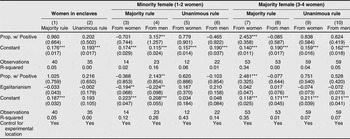
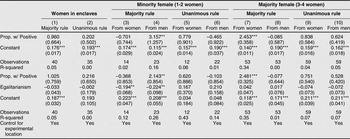
Another way to examine the encouraging effects of interruptions is to ask if positive interruptions elevate the speaker’s percentage of talk in the group. In table 5 we find that for female speakers, the answer is yes, but only when the encouragement is issued by the gender empowered in that condition. That is, women accelerate their talk the more they are encouraged either by men in conditions where women are least empowered (majority rule, few women), or by women when women are empowered (majority rule, majority women). That is, women speak more when they get more positive interruptions from men, but not from women, when women are disempowered; and they speak more when they get positive encouragement from women but not from men when women are the dominant gender. Female speakers thus calibrate the volume of their speech to the more powerful gender in the group. Men are not affected in this way. Footnote 88
Effect of the proportion of speaking turns receiving positive interruptions on women’s Proportion Talk
Note:
Note: Dependent variable in all models is Proportion Talk. Independent-level analysis. Cluster robust standard errors in parentheses.
*** ***p<0.01, **p<0.05, *p<0.10
In sum, we have seen that the experience of interruptions carries crucial consequences for deliberators. In particular, the relative negativity one receives when other members engage with one’s speech is a crucial factor in women’s sense of their influence and in others’ perception of women’s influence. The heart of the matter is whether women receive positive signals; when they do, they can withstand the occasional negative response.
And again, we see that the same experience can elicit very different responses by men and women. Women need frequent positive validation while they speak in order to feel that they matter; men do not. Footnote 89
The Rapport of Enclaves
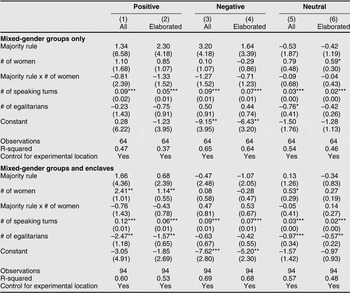
Finally, we argued that the level of rapport in the group not only matters to women, but that a preponderance of women may elevate it, and particularly so in female enclaves. So now we pose our final question: when does the group take on an affirming character? For this analysis we examine the group as a whole without differentiating women and men. We control on location, the number of egalitarians, and the group’s average number of speaking turns.
Table 6 shows that the number of women matters to the tenor of interaction in the group—but only with enclave groups included. As the number of women increases, the number of positive interjections in the group rises (without regard to rule). Footnote 90 In addition, when we look only at positive interruptions that elaborated on the content of the initial speaker’s thought, we find the same result—the more women, the more positive elaborated interruptions in the group. That is, the positive tone is accompanied by meaningful content. The interrupter offers some substance that goes beyond what the speaker articulated. Not only are predominantly female groups more friendly; they use this rapport to advance the discussion and provide a meaningful exchange of views. Footnote 91
Group-level effects on total number of interruptions, mixed-gender and enclave groups

Note:
Note: Group-level analysis. Standard errors in parentheses. ***p<0.01, **p<0.05, *p<0.10
This interpretation rests on the assumption that women elevate the positive—and not the negative. To test this hypothesis, we look at negative interruptions. These results are displayed next to the positive interruptions results in table 6. Unlike positive interjections, negative interruptions remain flat across the conditions. Neither do the conditions affect the number of negative interruptions with elaboration. Footnote 92
Finally, table 6 shows that when we omit the enclave groups and examine only mixed-gender groups, the only significant effect is for gender composition on neutral interruptions with elaboration. Positive interruptions do not rise with the number of women when women interact with men. They increase only among female enclave groups. That is, the affirmation effect from greater numbers of women is located specifically in gender-homogeneous groups. Footnote 93
These results tell us that the chief effect on groups as a whole is located with women’s enclaves. These settings are exceptionally warm. Further, these results imply that the warmth is the main way that elaboration is conveyed when one speaker directly engages another. In female enclaves, elaboration is achieved primarily through positive rather than negative or neutral interruptions. The warm tone of the group’s exchange directly affects the group’s success in providing new thoughts that add to what is being said. Women’s enclaves create a friendly, inclusive discussion tone, and this tone, unlike a hostile or conflictual tone, carries with it the contribution of one speaker to another’s thoughts.
Why Gender Equality Requires “Authoritative Representation”
Do women’s numbers affect women’s ability to express their voice? That is, does descriptive representation elevate other forms of representation and influence for women? Our results suggest that the answer is yes, but the rule moderates the effect. Groups with more women and majority rule, and groups with few women and unanimous rule, produce a more positive interaction style among the members. Moreover, women are the main beneficiaries of this style.
Especially badly off are women in the gender minority under majority rule. For these women, deliberation is a negative experience in which their speech is interrupted in a dismissive manner and their words rarely affirmed. Lone women, for example, issue a higher rate of positive interjections than any other gender subgroup, but receive the least in return (in each case, relative to their speaking turns). At 20 percent or 40 percent of the group, women are less than half as likely as men in their group to experience approval while speaking.
The effects are due to gender and not to factors correlated with it. The effects do not disappear when we control on preferences or values. Demographic controls for age, education, and income never change our basic findings, either when we control for individual-level attributes or how those attributes are aggregated within the group. Footnote 94
The results fit a broader pattern of gender inequality in deliberation. In the usual circumstances of political discussion, women are a numerical minority, and the group uses a norm of majority rule, whether it is officially stated or implied; thus, the expected style of interaction is one of individual agency and conflict. There, behavior tends to conform to a gendered pattern of differential power. Men tend to assert themselves through actions that society associates with higher power or status; women tend to behave in the opposite.
Similar patterns obtain in two other, very different settings. High-performing work teams exhibit a ratio of 6 positive to 1 negative comments, while poor performers have a ratio of 1 positive comment for every 3 negative. Footnote 95 In our study, the most negatively-interrupted members—minority-females under majority rule—experience a ratio similar to that of the poorly-functioning work teams. The implication is that the typical setting for political discussion, where women are a numerical minority under majority rule, is a dysfunctional one for women. In addition, our large-N findings replicate those from the consequential setting of legislatures, such as the confirmation hearings for Justice David Souter, or the Colorado state legislature. In these highly masculine settings, which our majority-rule, minority-female settings mimic, women encounter more hostile speech patterns than men do. Footnote 96 These cases also illustrate our findings that the ability of women to be heard in deliberation depends on the forms of speech. The pattern of interruptions one receives is a significant indicator of and instantiation of one’s authority.
These cases are reinforced by other studies that provide findings consistent with our argument. Though we were not able to examine interruptions, in other work, we replicated the gender gap we have documented elsewhere in our groups’ talk time using actual school board meetings from across the US and naturally-occurring dialogue groups in Midwestern towns. Footnote 97 One feature of these groups is repeated interaction, and yet that familiarity did not put a dent in gender inequality. In addition, the effects of women’s enclaves in our study are consistent with enclave effects on distributive decisions in Liberia and Kenya. Footnote 98
In considering the external validity of the study, we consider its various elements in turn. The task resembled the task in many deliberative settings—people made decisions about the distribution of resources to themselves and to others in society. While these were non-binding outside of the experimental setting, so are the recommendations of many actual citizens’ deliberative bodies. In addition, while we assembled people unfamiliar with each other to avoid the confounding effects from familiarity, so do many real-world settings. These include juries; civic deliberations (e.g., rebuilding the World Trade Center, or town planning); Footnote 99 government-organized meetings such as siting of hazardous materials; and local boards and commissions, which tend to meet infrequently and have high turnover. Footnote 100 As Lawrence Jacobs, Fay Cook, and Michael Delli Carpini find, meeting attenders are highly unlikely to know each other. Footnote 101 Our experimental setting thus shares important similarities with many groups of citizens who deliberate on issues of importance to their communities all across the United States.
However, we note caveats about the generalizability of the findings here, since we wish to avoid the mistake of automatically generalizing about the mechanisms of gender and power to any place or time. Our study featured a small group size not uncharacteristic in real-world deliberations, Footnote 102 but worth further study as a possible effect moderator. The mitigating influence of discussion moderators also merits investigation, Footnote 103 though moderators often focus on airing various views than on assuring equal floor time and opportunity to influence for disadvantaged populations, and tend not to focus at all on gender. Footnote 104 We were unable to fully include nonwhite Americans without also introducing variation in racial composition, and since we did not have the capacity to simultaneously examine racial and gender diversity, we sampled whites. However, in other work on school boards and race-dialogue groups we did include nonwhites, and the patterns are similar, as we noted above. Women of color may experience more hostile norms and practices than do white women, according to Mary Hawkesworth’s study of Congress. Footnote 105 Future studies should examine whether the speech patterns and effects we documented are characteristic among nonwhites, though that question should be further complicated by whether the interaction is in racially diverse or homogenous settings.
In addition, although status is typically associated with a proclivity to negatively interrupt in a variety of cultures, future research should investigate whether the specific patterns of interruption we found here apply in various cultures. Our two cities afford us some variation in women’s status in the community and in religious and traditional ideology, since one is a socially conservative, highly religious community in Utah, and the other a liberal, secular, and wealthy community in New Jersey, and yet the patterns we observed there are similar. However, it is worth considering what would happen in cases of still greater cultural difference from the US. One possibility is that in cultures where negative interruptions are the norm, and are used by more people and in more places, negative interruption is not associated with status or with gender, and the mechanisms we identified do not hold. The converse possibility is that in cultures where negative interruptions are very scarce, the status and gendered patterns we found are even stronger than in the US cases we examined. A third possibility, not associated with interruptions specifically, is that in cultures where women’s status is meaningfully equal with men, women who experience negative discursive forms such as negative interruptions are unaffected. Footnote 106
Our key point, however, is not found in previous studies: when the procedure does not account for the default inequalities between men and women, increasing descriptive representation does not increase other forms of representation. Representation depends not only on gender composition, but also on institutional norms and procedures that are neutral on their face but carry profound consequences for social inequality. While our results paint a dark portrait of gender inequality, the effects of unanimous rule are heartening for advocates of deliberation and for the goal of social justice. The dismal situation of minority women under majority rule improves dramatically under unanimous rule.
The decision rule is a simple yet powerful element of institutional design. It restrains the disrespect that men sometimes direct toward women where women have low status, and raises their affirmations of women’s speech. In these ways, it creates a norm of interaction that actively includes women. Gender inequality is produced by the assumption that women are not valuable in discussions that decide the fate of the collective. If women are not needed for making decisions, then they will not be much included. Conversely, our findings about rule imply that when women are needed, women are included. Women are needed both when they are a majority under rules that give a majority power, and when they are a minority under rules that give the minority power. The rule can elegantly set in motion a whole set of conversational practices that increase the affirmation that in turn elevate women’s representation.
We label such practices authoritative representation, and argue that institutional procedures can equalize symbolic and substantive representation by equalizing authoritative representation. Authoritative representation is the set of actions that occur during the process of representation and that affect the expectation that a person, or group, can exercise power and influence others. It can be affected by the other forms of representation, and in turn affects them, but it is a distinct form of representation. It occurs while people are interacting, and it directly builds authority. Once authority is built, the person is more likely to attempt substantive representation (that is, to attempt to speak up for their preferences and to articulate their perspectives), and emerges with higher symbolic representation (that is, the perception that the person is capable of governing and is well suited to it). We show how the process of interaction builds authoritative representation and how that in turn affects a woman’s symbolic representation (others’ and her own perception that the woman is influential and efficacious) and substantive representation (the woman’s attempts to speak, measured by floor time, and the content of her speech, measured by a willingness to articulate her own preferences and distinctive perspectives). Footnote 107 The various positive forms of speech engagement we document build authoritative power. The negative ones erode it. Thus, one important normative standard for equal deliberation is whether an institution or procedure or norm is conducive to women’s equal authoritative representation.
Our results also speak to advocates and critics of deliberation. One way in which they do so is regarding the ideal of civility in deliberation. Footnote 108 For some liberal theorists, reciprocity is the foundation of deliberative democracy, and civility is an integral part of reciprocity. Footnote 109 But we view the key concept for gender equality as affirmation rather than civility. Civility is a social code of politeness, Footnote 110 and politeness can be quite cold and indifferent in its emotional tone. Civility merely dictates that the listener get out of the speaker’s way by avoiding negative interruptions and hostility. That is an important criterion, but it is not sufficient. What matters is positive and proactive: women need affirmation and support, not merely the absence of negative attacks. In fact, our enclave result shows that disagreement per se is not deflating to women at all—as long as it occurs in an environment that is supportive. What deliberating groups should strive to achieve, then, is something close to friendship. Footnote 111 We do not mean actual relations of friendship, or the motivation to maintain close social ties, which may detract from good deliberation by dampening the willingness to raise points of disagreement, Footnote 112 but rather, the conversational forms of friendship. As sociolinguists put it, friendship is characterized by speech patterns that demonstrate a high level of supportive engagement, a “talking along” that creates solidarity and affirmation, camaraderie and rapport. Footnote 113 This is the concept we attempted to measure here, and it differs from the more minimal requirement of politeness.
Discursive friendship and rapport is an important feature of the process of discussion that shapes a member’s authoritative representation in the course of decision-making. In this communicative form, consensus is not weighed down by the pitfalls of a commitment to common perspectives or by the need for prior agreement on shared interests. While the rule of consensus may silence dissent in a call to act only on “common interests” defined to preclude women’s distinctive preferences, Footnote 114 consensus as a norm of communication provides affirming engagement to women when they speak, elevating rather than depressing their substantive representation. Thus, in contrast to theorists who regard consensus with suspicion or as unrealistically demanding, and who thus advocate adversarial discussion accompanied by a procedural commitment to listening, Footnote 115 we argue that egalitarian discussion rests not on adversarial but on supportive communication, which lifts women’s authority, since listening is extended to those with authority. We agree with Susan Bickford that a commitment to listening does not require a motive of empathy, but unlike her, we argue that listening requires the conversational expression of empathy for the speaker, because without such empathic expression, women are less likely to speak, and to be perceived as authoritative while speaking, and thus, without it, there would be nothing to listen to.
The results here also address the assumptions behind Habermasian theories of deliberation. A group may set out to deliberate with open-mindedness and mutual respect and to exchange reasons and appropriate evidence, as a Habermasian would like. Footnote 116 But the socio-emotional tenor of the discussion matters to its success. The logical and evidentiary content of speech is not the only dimension of speech that matters; its social meaning matters too, by shaping a speaker’s authority. If members offer criticisms without affirmations, the group dynamic will turn socially adversarial. And this, in turn, undermines social equality, a mainstay of the Habermasian pre-conditions of discussion. As Joel Anderson and Axel Honneth argue, deliberation requires “relationships of mutual recognition,” and “empathic engagement.” Footnote 117 This study contributes to the deliberation literature by spelling out the meaning of “mutual recognition” and “empathic engagement” in discussion, and pointing to the link between empathy and equal authority. Empathic communication equalizes authority, which in turn aids the communicative rationality sought in deliberation.
And this is also our contribution to the critical take on deliberation. Critics have worried that discussion undermines women’s standing. We have provided evidence to document this, but furthermore, we have shown exactly how women’s voice may be silenced during deliberation, thus providing evidence for when and why the critics are correct (though as we noted earlier, also showing when they are wrong). By directly examining how a speaker engages with another, as we do, we can understand both how disadvantaged groups achieve equal authoritative representation in discussion as well as how discussion can be deliberative.
Ten years ago, Simone Chambers asked, “What conditions are required to give marginalized groups voice and empowerment?” Footnote 118 Our answer is: a fit of rules to numbers, because that fit creates the affirmation that marginalized voices require. That affirmation, expressed in forms of conversational engagement, serves women in particular as a vehicle for the exchange of the forceless “force of the better argument.” Footnote 119
A permanent link to supplementary materials provided by the authors precedes the references section.
Tali Mendelberg is Professor of Politics at Princeton University (talim@princeton.edu). Christopher F. Karpowitz is Associate Director of the Center for the Study of Elections and Democracy and Associate Professor of Political Science at Brigham Young University (ckarpowitz@byu.edu). J. Baxter Oliphant is a doctoral candidate in politics at Princeton University (oliphant@princeton.edu). We gratefully thank Chris Achen, Patrick Egan, Susan Fiske, Marty Gilens, Amy Lerman, Markus Prior, the journal editors, and anonymous reviewers for their helpful feedback and input, as well as Lisa Argyle, Matthew Barnes, Kyrene Gibb, Steve Howell, Jesse Mudrick, Dan Myers, Lee Shaker, and many other assistants for their invaluable aid and hard work.
Supplementary Materials
-
• Supplementary Tables and Figures
-
• Alternative Estimator Models
-
• Fully-Saturated Control Models
-
• Liberal Control Models
-
• Instructions for Coding Interruptions
-
• Examples of Each Type of Interruption
-
• Complex Examples
-
• Participant Characteristics and Descriptive Statistics
-
• Sample Deliberation Transcript http://dx.doi.org/10.1017/S1537592713003691