


One of the most notable labor market shifts of the twentieth century was the rise of white married women working outside the home (Costa Reference Costa2000). Between 1900 and 2010, the share of married women in the U.S. labor force grew more than tenfold from 6 percent to 61 percent (Ruggles et al. Reference Ruggles, Nelson, Sobek, Fitch and Ronald Goeken2024). Prior work documents how various factors contributed to the growth in married women’s labor supply from the 1960s onward, including the introduction of new technologies, such as contraceptives and household appliances, and the shifting of social norms (Bailey Reference Bailey2006; Bertrand, Kamenica, and Pan Reference Bertrand, Kamenica and Pan2015; Fernández and Wong Reference Fernández and Wong2014; Greenwood, Seshadri, and Yorukoglu Reference Greenwood, Seshadri and Yorukoglu2005). However, less is known about the factors that contributed to the initial rise in women’s labor force participation (LFP), which began in the first half of the century.
This paper studies how married women’s labor supply in the early 1900s was affected by an important policy change: the passage of laws that prohibited the use of discriminatory “marriage bars” in the teaching profession in two U.S. states in the 1930s. The early twentieth-century United States was a time and place during which many white married women did not work and, in many white-collar occupations, did not have the option to work due to employers’ widespread use of marriage bars—a form of employer discrimination based on a woman’s marital status (Goldin Reference Goldin1991a). Footnote 1 Over the same time period, however, debates over tenure protection laws in one particular occupation began to spread across the country, centering teachers in a national discussion of married women’s employment rights. Amidst court cases of married women suing school boards for wrongful termination and numerous attempts by state legislators to pass employment protections for married women, only two states—Kentucky and North Carolina—ultimately passed laws prohibiting marriage bars in teaching. By comparing Kentucky and North Carolina to unaffected neighboring states in the Southern United States, we evaluate how prohibiting the use of marriage bars in teaching affected the employment of married women and, by extension, the overall labor force.
It is unclear ex-ante how prohibiting marriage bars would have affected the employment of married women, especially given the backdrop of gendered social attitudes at the time. Newspapers from this era chronicle an active public debate over the working married woman, deemed by many to be “taking money away from needy unmarried women” and “neglecting home duties” (New York Herald 1921; Oakland Tribune 1921). Had married women (or their households) also held these beliefs, then married women would have chosen not to work even if discriminatory employment practices were made illegal. Our setting thus provides a unique opportunity to assess whether the removal of barriers to employment for married women increased married women’s LFP in the 1900s, when the prevailing social norms were still that white married women should not work outside the home. Furthermore, if married women did, in fact, enter the labor force as a result of the prohibition of marriage bars in teaching, it is not obvious how the labor market would have been affected. For instance, if married women entered teaching but the overall teacher workforce did not expand, married women’s entry must have come at the cost of other workers’ exits. Who were these affected workers and where did they go?
The marriage bar prohibitions we study, which took the form of statewide legislation that made it illegal for school districts to discriminate against teachers based on their marital status in employment decisions, were passed in only two states. We leverage this variation in a difference-in-differences design, comparing outcomes in states that prohibited marriage bars to neighboring Southern states that did not. Using a combination of IPUMS full-count decennial U.S. Census data spanning 1910–1950 (Ruggles et al. Reference Ruggles, Nelson, Sobek, Fitch and Ronald Goeken2024) and linkages from the Census Tree (Price et al. Reference Price, Buckles, Haws and Wilbert2023a, 2023b, 2023c), the Census Linking Project (Abramitzky et al. 2022a, 2022b, 2022c), and the IPUMS Multigenerational Longitudinal Panel (Helgertz et al. Reference Helgertz, Ruggles, Warren, Fitch, David Hacker, Nelson, Price, Roberts and Sobek2023; Ruggles et al. 2021), we use our design to evaluate how the policy change affected the composition of the teacher workforce in cross-sections and to track the employment outcomes of individual women over time.Footnote 2
Our setting allows us to overcome two key challenges inherent to identifying the effects of removing barriers to employment for married women: (1) data availability and (2) endogeneity in employers’ choices of hiring policies. Although employers used marriage bars to prohibit the employment of married women across many occupations, there is no systematic data on which employers did so at specific points in time. In addition, the timing of individual employers’ decisions to allow married women to work may have been correlated with factors that simultaneously affected women’s employment, such as economic conditions, national trends in gender equality, or women’s wages. In teaching, however, a women-dominated occupation in which an estimated 70–80 percent of school districts used marriage bars at one point between 1930 and 1940 (Goldin Reference Goldin2021), we observe both (1) detailed documentation of employment policies relative to other occupations, and (2) plausibly exogenous prohibitions of marriage bar use in several states.
The validity of our empirical design rests on the identifying assumption that married women’s outcomes would have evolved in parallel between the “treated” (Kentucky and North Carolina) and “control” states (neighboring states) if marriage bars had not been prohibited. We provide three pieces of suggestive evidence that the “parallel trends” assumption holds. First, we show evidence of parallel pre-trends in our outcomes of interest prior to 1930. Second, using Gallup polling data from 1938, we find that the general public in treated and control states held similar views on whether married women should work (Gallup Organization 1938). Third, we find qualitative evidence from historical policy briefs and newspaper archives that show both treated and control states experienced similar policy discussions around protections for teachers at the time, suggesting that the marriage bar prohibitions were passed in some states but not others for seemingly idiosyncratic reasons, like the priorities of a particular state legislator.
Notably, our period of study overlaps with the Great Depression and subsequent economic recovery—large-scale economic events that could have affected women’s LFP differently in treated and control states absent the prohibitions. We address this identification concern using several robustness checks, including border county and matched county designs that allow us to match treated and control counties as closely as possible on pre-trends in economic conditions.
Our main finding is that prohibiting marriage bars in teaching increased the employment of married women in teaching, specifically by increasing white women’s employment, with no effect on Black women. Treated counties experienced a 4.1 percentage point (p.p.) increase between 1930 and 1940 (a 26 percent increase) in the share of white teachers who were married women. The likelihood that a white married woman worked as a teacher also increased by 20 percent between 1930 and 1940 in treated counties relative to control ones. Effects on Black teachers and Black women are not significantly different from zero. Our estimates thus squarely reject the null hypothesis that policy changes aimed at prohibiting employer discrimination against married women had no effect on married women’s labor market outcomes, and further suggest that marriage bars were not binding for Black women in the early twentieth century.
Furthermore, we find that the increase was driven by an extensive margin labor supply response among married women. Using our linked Census sample, in which we can observe individuals moving between occupations and in and out of the labor force, we find that the prohibitions led women to change their decision of whether and when to work as teachers rather than whether and when to get married. We find that the laws did not lead unmarried women to become more likely to get married, nor did they induce working women to switch from other occupations into teaching. Instead, the increase in married women teachers was driven by two primary channels: married women who were not in the labor force becoming more likely to enter teaching rather than remain out of the labor force, and unmarried women teachers becoming more likely to remain in teaching after marriage rather than exiting the workforce. We therefore conclude that the prohibition of marriage bars pulled white married women into teaching from outside the labor force, rather than from other occupations.
However, in pulling married women into the labor force as teachers, the laws also led to other workers—specifically, other women—switching out of teaching. We find that the increased employment of married women in teaching was entirely offset by a decrease in the employment of unmarried women in teaching, with no effect on the total number of teachers or on the share of men in teaching. We interpret the maintained ratio of men to women teachers before and after the laws as being consistent with two common beliefs that schools and other employers held at the time: that men and women workers were imperfect substitutes and that employing men took priority over employing women (Goldin Reference Goldin2021). Indeed, consistent with imperfect substitution, women teachers in many U.S. cities were paid less than a third of what men teachers were paid and tended to be allocated to subjects like home economics rather than mathematics (Blount Reference Blount1996; Bohan and Null Reference Bohan and Null2007).
Finally, we use our linked Census sample to investigate what happened to the unmarried women who were, or might have eventually become, teachers. We find that the laws did not deter unmarried women from later becoming teachers. Instead, we find evidence that the laws led unmarried women who were already teachers to switch to other occupations, without affecting their earnings as proxied by occupational scores. In addition, we show that the laws increased overall LFP among unmarried women who were already teachers, where the increase was entirely driven by those who became married and remained in the labor force. We therefore conclude that the policy change had a net positive impact on women’s labor market outcomes, pulling women into the labor force without pushing incumbent women teachers out of the labor force or to lower-paying jobs.
Overall, our study shows that removing institutional barriers to employment specific to married women modestly improved white women’s labor market outcomes between 1930 and 1950 in the context of teaching. Our findings also serve as a cautionary tale: in the presence of gendered social attitudes, the costs of such policies may be borne by other women who are reshuffled to different occupations. In our setting, while we show that prohibiting marriage bars increased the labor force participation of incumbent teachers without decreasing the labor force participation of potential future teachers, because teachers comprised only a small share of the population, we are unable to detect an effect of the prohibitions on all women’s LFP.
This paper contributes to our understanding of the historical factors that led to the rise in women’s LFP in the United States throughout the twentieth century. A significant body of work studies the effects of large-scale factors post-1950, including WWII (Acemoglu, Autor, and Lyle Reference Acemoglu, Autor and Lyle2004; Goldin Reference Goldin1991b; Rose Reference Rose2018), the introduction of oral contraceptives (Bailey Reference Bailey2006; Goldin and Katz Reference Goldin and Katz2002), shifting cultural attitudes (Fernández Reference Fernández2007), and improved household technologies (Greenwood, Seshadri, and Yorukoglu Reference Greenwood, Seshadri and Yorukoglu2005). However, few papers study the factors that contributed to the initial rise pre-1950, which happened despite married women facing active, legal employer discrimination. One notable exception is Goldin (Reference Goldin1991a), who documents the use of marriage bars in the early 1900s United States and explores employers’ economic justifications for using these discriminatory practices. Footnote 3 Motivated by these findings, we study how the prohibition of marriage bars impacted married women’s LFP in the first half of the century. Our findings suggest that the prohibition of marriage bars had sizeable effects on married women’s LFP in the short run, falling within the range of effect sizes of changes in the second half of the century like early access to the pill (which accounted for 8 percent of the rise in women’s LFP between the ages of 26–30, according to Bailey (Reference Bailey2006)) and improved household technologies (which accounted for over half of the later rise in women’s LFP, according to Greenwood, Seshadri, and Yorukoglu (Reference Greenwood, Seshadri and Yorukoglu2005)). We also provide the first empirical evidence that marriage bars were not binding for Black women, as posited by Goldin (Reference Goldin1991a).
This paper also contributes to the study of the intended and unintended consequences of anti-discrimination policies. While some policies have been found to affect the targeted population as intended—for example, the Equal Pay Act of 1963 and Title VII of the Civil Rights Act of 1964 resulted in an increase in women’s pay (Bailey, Helgerman, and Stuart Reference Bailey, Helgerman and Stuart2024; Carrington, McCue, and Pierce Reference Carrington, McCue and Pierce2000; Neumark and Stock Reference Neumark and Stock2001)—other policies have been found to have the opposite effect. For instance, the Americans with Disabilities Act (ADA) of 1990 decreased the employment of people with disabilities (Acemoglu and Angrist Reference Acemoglu and Angrist2001; Beegle and Stock Reference Beegle and Stock2003; DeLeire Reference DeLeire1997), and the Age Discrimination in Employment Act (ADEA) in 1968 decreased the employment of older workers (Lahey Reference Lahey2008; Neumark and Song Reference Neumark and Song2013). The latter group of papers illustrates that when an anti-discrimination policy imposes new costs on employers, they might take actions to minimize those costs and inadvertently negatively impact the workers being discriminated against. Footnote 4 Our paper provides new evidence of another example of an anti-discrimination policy with unintended consequences: while prohibiting marriage bars led married women’s employment to rise in teaching, schools also chose to maintain the gender ratio of teaching staff, leading single women to leave the profession with no anti-discrimination policy in place to protect their employment.
EMPLOYMENT DISCRIMINATION AGAINST MARRIED WOMEN IN THE EARLY TWENTIETH-CENTURY UNITED STATES
This section provides historical background on the evolution of the institutional barriers to employment that married women faced in the early twentieth-century United States, both nationwide and specifically in the teaching profession.
The Evolution of Marriage Bar Use: 1900–1960
Marriage bars, the class of discriminatory employment practices that excluded married women from the workplace, began to emerge across the world throughout the late 1800s and early 1900s. Goldin (Reference Goldin1991a, p. 514) argues that marriage bars were “the most numerically significant form of all prohibitions in their impact on the employment of married women.” In the United States, marriage bars were popular among employers that employed women as clerical workers (such as banks and insurance companies) and government agencies that employed women (such as school districts).
Importantly, marriage bars were mainly a discriminatory barrier to employment for white married women but not for Black women, as Black women were significantly more likely to work during this time period due to Jim Crow-era laws (Costa Reference Costa2000), and tended to work in highly segregated occupations in agriculture, manufacturing, or, in the case of education, in segregated schools (Boustan and Collins Reference Boustan and Collins2014). As such, the details that follow largely describe employers’ perceptions of white married women in the workplace.
In practice, marriage bars were implemented in two ways: married women were either not hired due to their marital status (“hire bars”) or single working women who got married were fired or expected to quit upon marriage (“retain bars”). Employers practiced one or both forms of discrimination, either formally by implementing rules not to employ married women at the organizational level or discretionarily on a case-by-case basis.
Employers viewed marriage bars as favorable personnel policies for three reasons. First, it was widely believed that men, rather than married women, were meant to support their families. Many employers thus preferred to offer jobs to men rather than to married women who had husbands to provide for them (Blount Reference Blount1996).
Second, it was believed that due to their household responsibilities, married women were less efficient workers than unmarried women and men (“the married woman lacks genuine interest in her work” (Cooke and Simms Reference Cooke and Simms1940, p. 208)). Not employing married women was thus justified on the basis that single women were more reliable workers than married women. Third, many employers used internal promotion practices and tenure-based salary schedules, both of which incentivized employers to maintain high turnover of employees. Firing married women was thus a convenient and socially acceptable way to avoid paying the higher salaries associated with longer tenures for a particular subset of workers (Goldin Reference Goldin1991a). Incidentally, teaching was a key example of an occupation that featured fixed salary schedules in the majority of school districts as early as the 1920s.
Although marriage bars were widely used, there is no systematic record of marriage bar use across U.S. employers. The available data on employer-level marriage bar use largely comes from a handful of surveys that were carried out between 1931 and 1956, asking nonrepresentative samples of employers about their policies concerning married women. The surveys show that discretionary marriage bar policies were especially common: in 1936, 50–60 percent of factories and offices in a survey conducted by Purdue University reported using formal or discretionary marriage bar restrictions (Mosca and Wright Reference Mosca and Wright2021). Formal marriage bar policies were less common, but still affected over a quarter of working women in urban centers due to the greater likelihood of large employers adopting formal policies (Goldin Reference Goldin1991a).
The most comprehensive data on marriage bar use was collected by the National Education Association (NEA) in their surveys of school districts in 1928, 1930 to 1931, 1942, and 1950 to 1951 (Goldin Reference Goldin2021). The surveys show that marriage bar use in schools increased over the course of the Great Depression, a trend that has been attributed to rising unemployment and a scarcity of jobs for men, then dropped significantly throughout the 1940s.Footnote 5 “Hire bars” in school districts, for instance, rose from affecting 60 percent of the urban population in 1920 to nearly 80 percent in 1942, before a dramatic decline to 17 percent in 1950/51.
The steep decline in school districts’ use of marriage bars between 1940 and 1950 mirrored a society-wide trend toward inclusion of married women in the workforce. After WWII, unemployment was near zero, and demand for workers was high. It became too costly for employers to continue excluding older, married women from the workforce (Goldin Reference Goldin1991a). As such, the use of marriage bars in the United States quickly declined and largely ended by the 1950s and 1960s.Footnote 6
Incidentally, rhetoric surrounding the efficiency of married women workers also flipped during this time period, with older women being praised for their “maturity,” “steadiness,” and “reliability,” in stark contrast to the earlier justifications made for using marriage bars.
The Prohibition of Marriage Bars in Teaching
School districts were the most prominent employers that used marriage bars throughout the early twentieth century. Their use was particularly notable as teaching was a woman-dominated occupation and one of the few socially accepted occupations for educated women at the time: in 1940, 31 percent of married women in the workforce with any college were teachers.Footnote 7
School districts used the same justifications as other employers to rationalize the use of marriage bars. However, unlike in other occupations, discriminatory hiring policies in teaching were contested nationwide in debates over tenure protection for teachers from the 1910s onward. By 1922, districts in 11 states offered tenure to teachers with various legislative limitations, but did not explicitly protect married women. Some of the women who ended up being dismissed on the basis of marriage took the offending school boards to court, but newspaper archives show that the court decisions were mixed, ranging from indicating that local school boards could use their discretion (such as in Massachusetts, Minnesota, Michigan, and South Carolina) to indicating that marriage was not a just cause for dismissal (such as in New York, West Virginia, Oregon, and Indiana) (Tampa Morning Tribune, 1934, 1938). By 1931, localities in nine states had passed tenure legislation for teachers that included protection against dismissal due to marital status; by 1939, the number increased to 13, and by 1943 to 33 (Cooke, Knox, and Libby Reference Cooke, Knox and Libby1943).
Importantly, although the tenure laws that protected teachers from being dismissed upon marriage became more common from 1920 to 1940, the majority of such laws were not statewide in their application. Repeated cross-sectional data show that some districts hired substantially higher rates of married women than others, confirming that marriage bars were implemented locally.
By 1940, only two states—Kentucky and North Carolina—had passed state-level legislation containing employment protections that explicitly prohibited discrimination against married women in teaching (Cooke and Simms Reference Cooke and Simms1940). The legislation in North Carolina in 1933 was broad in its application: the North Carolina Public Laws Chapter 562 Section 11 declared that “in the employment of teachers no rule shall be made or enforced on the ground of marriage or nonmarriage” (North Carolina General Assembly, Regular session, 1933). The legislation in Kentucky in 1938 was more specific to experienced teachers: House Bill No. 51 in the Kentucky General Assembly included an act “to prohibit boards of education or school superintendents from adopting rules preventing marriage of any school teacher who has had five years or more teaching experience” (Kentucky General Assembly, 1st and 2nd special sessions, 1938). The laws received virtually no coverage in local newspapers at the time, which suggests that the laws may have been more salient to school districts that were wary of being sued than to the general public.Footnote 8
We conclude with descriptive evidence that suggests that the statewide prohibitions in Kentucky and North Carolina may have led to greater employment of white married women in teaching. Figure 1 shows the distribution over time of the fraction of white teachers who were married women for counties in Kentucky and North Carolina versus other counties across the rest of the country. Married women gradually entered teaching between 1910 and 1930 in all states, as evidenced by the rightward shift in the distribution means.Footnote 9 The variances increase over time as well, indicating that some counties still maintained low shares of married women teachers even as married women began to enter teaching elsewhere. In 1940, however, the mass of the Kentucky and North Carolina distributions shifts right relative to other states, indicating that nearly all counties in Kentucky and North Carolina were hiring married women at relatively higher rates. Finally, by 1950, the other states appear to catch up to Kentucky and North Carolina in terms of married women’s employment in teaching.Footnote 10 Our empirical design leverages this variation to formally evaluate the effects of the laws in Kentucky and North Carolina on women’s employment in teaching.
DENSITY PLOTS OF THE COUNTY-LEVEL FRACTION OF WHITE TEACHERS WHO ARE MARRIED WOMEN, 1910–1950
Notes: Separate distributions are shown for (1) counties in states where marriage bars were prohibited in teaching in the 1930s (KY, NC), and (2) all other counties in the country. Vertical dashed lines represent group means.
Sources: 1910–1950 decennial Censuses.

DATA
Cross-Sectional Sample
For the first part of our analysis, we use data on teachers in the repeated cross-sectional full-count decennial U.S. Censuses from 1910 to 1950, which cover all individuals in the United States (Ruggles et al. Reference Ruggles, Nelson, Sobek, Fitch and Ronald Goeken2024). We define teachers as individuals between the ages of 16 and 64 who report teaching as their occupation and who are not self-employed. The data do not separately identify public and private school teachers, but because private schools accounted for less than 10 percent of total enrollment in the early 1900s, public school teachers likely comprise the bulk of the teachers we identify (U.S. Department of Education, National Center for Education Statistics 1993).
Linked Samples
For the second part of our analysis, we use panel data on the women who can be linked between consecutive decennial U.S. Censuses between 1910 and 1940. We use the links provided by the Census Tree, which is based on linkages obtained directly from a genealogical website called FamilySearch (Buckles et al. Reference Buckles, Haws, Price and Wilbert2023). Additional linkages are added using a machine learning algorithm trained on the FamilySearch linkages (Price et al. Reference Price, Buckles, Leeuwen and Riley2021), the Census Linking Project (Abramitzky et al. Reference Abramitzky, Boustan, Eriksson, Feigenbaum and Pérez2021), and the IPUMS Multigenerational Longitudinal Panel (Helgertz et al. Reference Helgertz, Ruggles, Warren, Fitch, David Hacker, Nelson, Price, Roberts and Sobek2023). To retain as many observations as possible, we only link between adjacent Censuses. We also drop the few linkages for which the sex or race differs between Censuses, or for which the implied year of birth varies by more than five years.
Reassuringly, we find similar linkage rates between treated and control states over time. Footnote 11 However, linkage loss could still introduce bias to our results. For instance, linkage rates differ by women’s marital and employment status. On one hand, because single women who get married between Censuses are less likely to be linked, single women who get married are underrepresented in our linked samples. As a result, using the linked data, our estimated effects of the prohibitions on the likelihood that a woman in t – 10 is married in t are attenuated toward zero. On the other hand, single women who stop working because they got married between Censuses are also underrepresented in our linked samples. As a result, using the linked data, our estimated effects of the prohibitions on the likelihood that a woman in t – 10 is working in t are upward biased. It is difficult to bound these biases, as doing so would require estimating the number of single women who get married whom we are unable to link, which is inherently unobserved. However, what we can say is that our main estimate of interest in our linked analyses—that is, the effect of the prohibitions on the likelihood that women in t – 10 become married women teachers in t—is ambiguously biased due to linkage loss, given it is subject to two sources of bias that go in opposite directions and could even negate each other.
Another potential concern is that linkage rates may differ by women’s level of education. If more educated women are more able to find employment and more likely to stay unmarried, then the unmarried women we can link across Censuses may be selected on higher education. As a result, using the linked data, we may obtain upward-biased estimates of the employment effects of the prohibitions on unmarried women, as the linked women would be more likely to work than the average unmarried woman. It is difficult, however, for us to bound this bias, as education is not available in the Census until 1940.
County Sample Selection
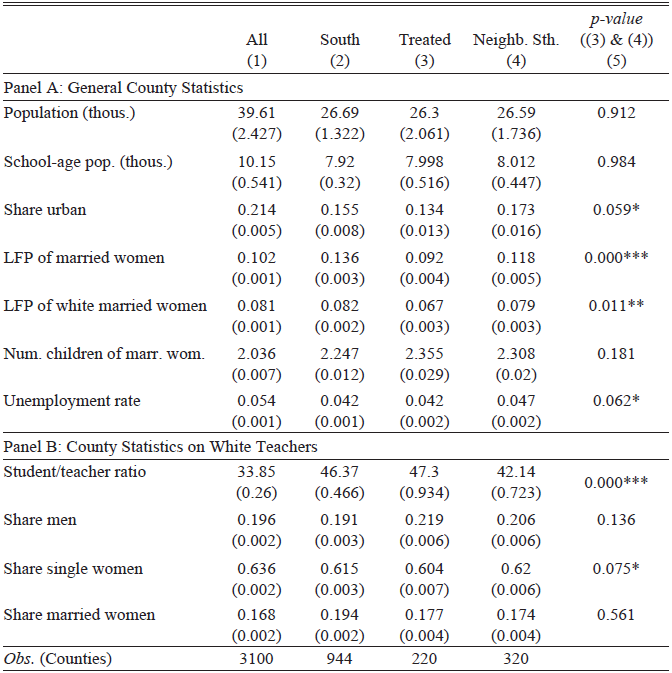
Our analysis focuses on the counties within and surrounding the states that passed prohibitions (Kentucky/North Carolina). To motivate this focus, Table 1 provides summary statistics comparing counties in Kentucky and North Carolina to counties in other states in 1930.
SUMMARY OF KEY COUNTY-LEVEL STATISTICS BY COUNTY GROUP IN 1930

Table 1 Long description
A table comparing county-level statistics by group in 1930. The table has two panels: Panel A and Panel B. Panel A focuses on general county statistics, while Panel B focuses on statistics on white teachers. Panel A includes rows for population, school-age population, share urban, labor force participation of married women, labor force participation of white married women, number of children of married women, and unemployment rate. Panel B includes rows for student/teacher ratio, share men, share single women, and share married women. Each row provides values for all counties, southern counties, treated counties, and neighboring states. The table also includes p-values for comparisons between treated counties and neighboring states.
Notes: Panel A presents means and standard errors of county-level variables for the whole county population, including population in thousands, the percentage of the county population living in an urban area, the percentage of married women and white married women in the county between the ages of 18 and 64 who are in the labor force, and the average number of children for married women. Panel B presents means and standard errors of county-level variables related to teachers, including the white school-age population divided by the number of white teachers in a county, and the share of white teachers in a county that are men, unmarried women, and married women. Column (5) presents p-values from t-tests for differences in means between the Treated and Neighboring South counties. *p < 0.10, **p < 0.05, ***p < 0.01
Source: All statistics are measured using the IPUMS full count 1930 Census data, aggregated to the county level.
Kentucky and North Carolina were highly comparable with their neighboring Southern states, South Carolina, Virginia, Tennessee, and West Virginia, as shown in Columns (3) and (4). Compared to the national average (Column (1)), counties in Kentucky/North Carolina and neighboring states had higher student-to-teacher ratios, exhibited a lower share of the population living in urban areas, and saw more children per married woman on average.Footnote 12 Within the U.S. South (Column (2)), counties in Kentucky/North Carolina and neighboring states tended to have lower rates of LFP among white married women, particularly in teaching. There are a few small but notable differences between Kentucky/North Carolina and the neighboring states—in 1930, neighboring states were more urban and had higher LFP among married women, higher unemployment rates, and greater shares of single women in teaching—which warrant robustness exercises using controls and different empirical strategies, outlined in Online Appendix C. However, given the overall cultural and statistical similarities between Kentucky/North Carolina and their neighboring states, the neighboring states comprise our preferred comparison group.
Our main analysis sample includes all 220 counties in treated states and all 320 counties in the neighboring Southern states (Kim and Tsao Reference Kim and Tsao2026). In parts of our analysis where we examine county-level outcomes (rather than individual-level outcomes), we restrict to a balanced sample consisting of 217 treated counties and 310 neighboring Southern control counties.Footnote 13 We make two further restrictions for analyses by race: when we examine county-level outcomes for white teachers, we exclude one control county with fewer than ten white teachers in 1930 or 1940; similarly, when we examine county-level outcomes for Black teachers, we exclude 109 treated and 129 control counties with fewer than ten Black teachers in 1930 or 1940. Our results are robust to alternate sample specifications.
EMPIRICAL STRATEGY
Main Specification
It is unclear a priori how the prohibition of marriage bars in teaching would have affected women’s LFP in the 1930s. If marriage bars were the main factor preventing married women from working as teachers, then prohibiting marriage bars would have a marked effect on the share of married women in teaching. On the other hand, if marriage bars played a negligible role relative to factors like social norms, then married women would continue to self-select out of teaching under the prohibitions, resulting in no discernible effect on the gender composition of teachers.
We evaluate the impact of the prohibitions on employment outcomes by comparing outcomes over time in counties that passed the laws—Kentucky and North Carolina—with counties in neighboring Southern states that did not. We use a difference-in-differences design to evaluate the effects of the statewide policy changes on the composition of the teacher workforce and on men’s and women’s employment. Footnote 14,Footnote 15
Our outcomes of interest, which are outlined in the following section, include region-level outcomes (such as the share of teachers in a county who are married women) and individual-level outcomes (such as the likelihood that an unmarried woman in 1930 becomes a married woman teacher in 1940). We therefore use both county- and individual-level specifications. Our preferred county-level specification is:

where c indexes county, t indexes Census year, s(c) is the state county c is in, y
ct
is the outcome variable of interest, Treat
s(c) is an indicator for whether a county is in a treated state, and
 capture year and county fixed effects, respectively.
Footnote 16
The main parameters of interest are
 , which, under certain assumptions, capture the effect of being in a treated state in 1940 and 1950 on county-level outcome y. Standard errors are clustered at the county level in the main analysis.Footnote
17
Analogously, our preferred individual-level specification is:

where i indexes individuals and the notation follows from the county-level specification. We include county and year fixed effects and cluster standard errors at the county level. We also add age fixed effects to account for the fact that the likelihood of marriage is strongly related to age.
Outcome Variables
We examine two sets of outcomes. The first set of outcomes allows us to explore the effects of the marriage bar prohibitions on the local teacher workforce. Since the closest geographic approximation we have to the school district is the county, we use cross-sectional decennial Census data to construct the following county-level outcomes for local teacher workforces: the share of teachers in county c in year t who are married women, unmarried women, and men; the share of teachers in county c in year t who are women with children; the number of married women teachers per hundred married women in county c in year t; and the total number of teachers in county c in year t.
The second set of outcomes allows us to understand the mechanisms by which the prohibitions affected the composition of teachers. These outcomes are constructed at the individual level using the linked decennial Censuses, allowing us to investigate women’s transitions in and out of marriage, teaching, and the workforce. For each woman i observed in year t − 10 ∈{1910,1920,1930}, our main outcomes of interest include: an indicator for her marital status in year t, and an indicator for the interaction between her marital status in year t and her occupational status in year t (either teaching, not teaching but in the labor force, or not in the labor force). Treatment status is defined based on the county in which the person lives in year t − 10.
Additional linked outcomes include a woman’s occupational score in year t and indicators for whether, in year t, she has any children, is in the labor force, or is living in a different state. Footnote 18 We follow prior work (Abramitzky, Boustan, and Eriksson Reference Abramitzky, Boustan and Eriksson2012) in using occupational scores, which are numerical ratings of occupations ranging from 0–80 based on the average income associated with the occupation in 1950, as a proxy for income.
Identifying Assumption
Causal inference relies on the “parallel trends” assumption, in other words, we require that in the absence of the marriage bar prohibitions being introduced in teaching between 1930 and 1940, the outcomes of interest would have evolved similarly in treated and control counties. A potential threat to identification would be if the prohibitions and the outcomes of interest had been jointly determined by some omitted variable. For example, if school districts in Kentucky and North Carolina held more progressive views on employing married women compared to neighboring states, then such views may have driven both the passing of the laws and an increase in married women teachers in Kentucky and North Carolina relative to their neighbors. Another important factor to consider is that the prohibitions took place against the backdrop of many economic and policy changes that could have affected women’s marriage and employment outcomes, such as changes in compulsory schooling laws, child labor laws, teacher training requirements, or the Great Depression and New Deal programs. Parallel trends could also be violated if any of these policies differentially impacted treated and control states.
In this section, we present three pieces of evidence that suggest the parallel trends assumption reasonably holds in our setting. We then discuss how the assumption is affected by the Great Depression and New Deal, and how we approach the biases these economic and policy changes may introduce into our analysis.
SUPPORT FOR PARALLEL TRENDS
First, we find that there are no differential pre-trends in our outcomes of interest between the treated and control counties until 1930. While a lack of pre-trends is neither necessary nor sufficient evidence that the parallel trends assumption holds, it is reassuring for our identification strategy that Kentucky and North Carolina were on similar trajectories as their neighboring states prior to 1930.
Second, using public opinion polls, we find suggestive evidence that there are no meaningful differences in public opinion on the employment of married women in teaching between our treated and control states. In a 1938 Gallup poll (Gallup Organization 1938), respondents were asked the following question: “Schools in some states only hire unmarried teachers and discharge them if they get married. Do you approve of this rule?” We compare the responses to this question between Kentucky and neighboring control states. Footnote 19 We find that respondents in Kentucky were weakly less likely to approve of the rule (22.0 percent, s.e. 4.9 percent) compared to respondents in Tennessee and West Virginia (27.9 percent, s.e. 5.9 percent), but that the gap is statistically indistinguishable from zero at the 90 percent confidence level (t-statistic: 0.77). We conclude that there were no meaningful differences in norms regarding the employment of married women in teaching between the treated and control states.
Third, we find suggestive qualitative evidence that the prohibitions were not driven by state-specific trends in sentiments toward married women teachers, but rather were passed due to idiosyncrasies in the priorities and actions of the legislators involved. Historical policy reports and newspaper archives show that tenure protections for teachers were being debated across the country throughout the 1930s, not only in Kentucky and North Carolina. Newspapers describe school districts that explicitly resolved not to renew teaching contracts for married women teachers in states such as Ohio, Minnesota, and Tennessee. Local court decisions on whether it was just for women to be dismissed on the basis of marital status were mixed, with some courts in Massachusetts, Minnesota, Wisconsin, South Carolina, California, Kansas, and Florida upholding the school boards’ right to dismiss, while other courts in New York, Alabama, California, Florida, Illinois, Indiana, Kentucky, Louisiana, New Jersey, New York, Oregon, Tennessee, and West Virginia did the opposite (Tampa Morning Tribune 1934, 1938). Furthermore, Kentucky and North Carolina were not the only states in which bills protecting married women against dismissal were introduced. In 1932, a Mrs. Emma Lee White introduced a similar bill to the Virginia General Assembly, which was ultimately unsuccessful (Daily Press 1932). We take these data as evidence that the policy discussion and sentiments toward married women teachers were similar in Kentucky and North Carolina as well as the neighboring Southern states.
THE GREAT DEPRESSION AND NEW DEAL
Despite the many economic and policy changes that took place between 1910 and 1950, which could have affected women’s marriage and employment outcomes, many of these changes did not differentially impact our treated and control states. For instance, changes in compulsory schooling laws and child labor laws, which could have affected the demand for teachers, did not occur in most of our treated and control states between 1910 and 1950. Footnote 20 One of the key changes in teacher training in the early 1900s was the shift from two-year “normal schools” to four-year college programs, but these changes largely took place before 1930.
However, we do find two notable differences in how our treated and control states were affected by the Great Depression and New Deal. Here, we reference prior work on the effects of the Great Depression to assess the potential biases these differences may cause in our design and develop strategies that allow us to address these concerns.
The first difference is that the average treated county experienced a more severe economic downturn and a more muted recovery than the average control county during the Great Depression.Footnote 21 Two control states in particular experienced comparatively mild effects of the Great Depression: in Online Appendix Table B2, Column (2) shows that while Kentucky and North Carolina experienced similar decreases in retail sales per capita between 1929 and 1933 as control states Tennessee and West Virginia, South Carolina and Virginia experienced much smaller declines. At the same time, Column (3) shows that, with the exception of West Virginia, control states experienced slightly larger recoveries in retail sales per capita between 1933 and 1939 than Kentucky and North Carolina.
How might these differential trends bias our results? Prior literature finds that the Great Depression delayed women’s decisions to marry (Hill Reference Hill2015) and contributed to more widespread implementation of marriage bars to preserve job openings for men (Goldin Reference Goldin1991a). At the same time, Bellou and Cardia (Reference Bellou and Cardia2021) find that more severe economic downturns pushed more white women into the labor market, with suggestive evidence that married women were affected as well—although this “added worker” effect was tempered by New Deal programs (Finegan and Margo 1994).Footnote 22
The direction of potential bias is therefore ambiguous. In the absence of the marriage bar prohibitions, worse economic conditions in treated states relative to control states would have increased the use of marriage bars, delayed marriage among women, and decreased resources for schools, all of which would have reduced the relative likelihood that women got married or taught in treated states compared to control ones. At the same time, the “added worker” effect may have resulted in larger inflows of married women into the labor force in treated states compared to control states. Our estimates could thus be biased downward by the reduced likelihood of treated women getting married or teaching in treated states, or biased upward by the “added worker” effect in treated states.
We use several strategies to address these potential biases. Our primary strategy involves comparing treated states to alternate control groups that were more similarly affected by the Great Depression. Online Appendix C outlines these specifications in detail, including a border counties design, where we only compare counties along state borders, and a matched county design, where we match counties based on 1920 and 1930 characteristics. We also include controls for unemployment rates and industry shares in several specifications.
The second notable difference between treated and control states was their exposure to New Deal policies. A large number of control counties in Tennessee, but only a small number of treated counties, were directly impacted by the Tennessee Valley Authority (TVA), a major New Deal program that aimed to provide the first federal electrification program and stimulate the economy in the hard-hit Tennessee Valley. Prior work finds that the TVA had large impacts on the local economy, particularly in shifting work away from agriculture to higher-paying manufacturing jobs (Kline and Moretti Reference Kline and Moretti2014). Combined with the aforementioned studies, these results suggest that including TVA-affected counties in our analysis could bias our estimates upward, as increasing manufacturing jobs in TVA-affected counties would have decreased the need for married women to work in more control counties than in treated ones. To address this potential bias, we conduct robustness checks that exclude the counties affected by the TVA.
THE EFFECTS OF PROHIBITING MARRIAGE BARS IN TEACHING
Direct Effects on Married Women
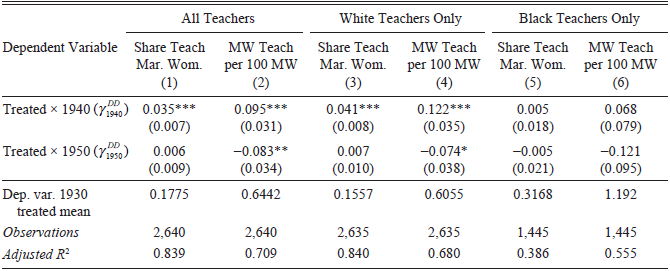
We start by examining how the prohibitions of marriage bars in teaching affected the employment of married women as teachers. Results from estimating Equation (1) are shown in Table 2. Column (1) (and triangles in Figure 2) shows the estimated effects of the prohibitions on the share of teachers in a county who were married women, while Column (2) shows the estimated effects on the number of married women teachers per hundred married women.
ESTIMATED EFFECTS OF THE PROHIBITION OF MARRIAGE BARS ON MARRIED WOMEN TEACHERS

Table 2 Long description
A table comparing the effects of marriage bar prohibitions on the employment of married women teachers. The table has six columns and four rows, focusing on different dependent variables and teacher demographics. Column headers include 'Dependent Variable', 'All Teachers', 'White Teachers Only', and 'Black Teachers Only', with sub-columns for 'Share Teach Mar. Wom.' and 'MW Teach per 100 MW'. Row labels include 'Treated x 1940', 'Treated x 1950', 'Dep. var. 1930 treated mean', and 'Observations'. Each cell contains specific values related to the study's findings. Notable trends include variations in the share of married women teachers and the number of married women teachers per 100 married women across different groups and treatment years.
Notes: Estimation uses a difference-in-differences approach as outlined in the Empirical Strategy section. The estimation sample includes counties in treated states (KY, NC) and neighboring Southern states (VA, SC, TN, WV) in 1910–1950. The outcome in Column (1) is the share of teachers who are married women and the outcome in Column (2) is the share of married women (ages 18–64) who are working as teachers, multiplied by 100. Columns (3) and (4) use the same outcomes computed for only white teachers and only white women respectively. Columns (5) and (6) use the same outcomes computed for only Black teachers and only Black women respectively. All regressions are at the county-year level, include year and county fixed effects, and are clustered at the county level. *p < 0.10, **p < 0.05, ***p < 0.01
Source: All regressions use the 1910, 1920, 1930, 1940, and 1950 IPUMS full count Censuses.
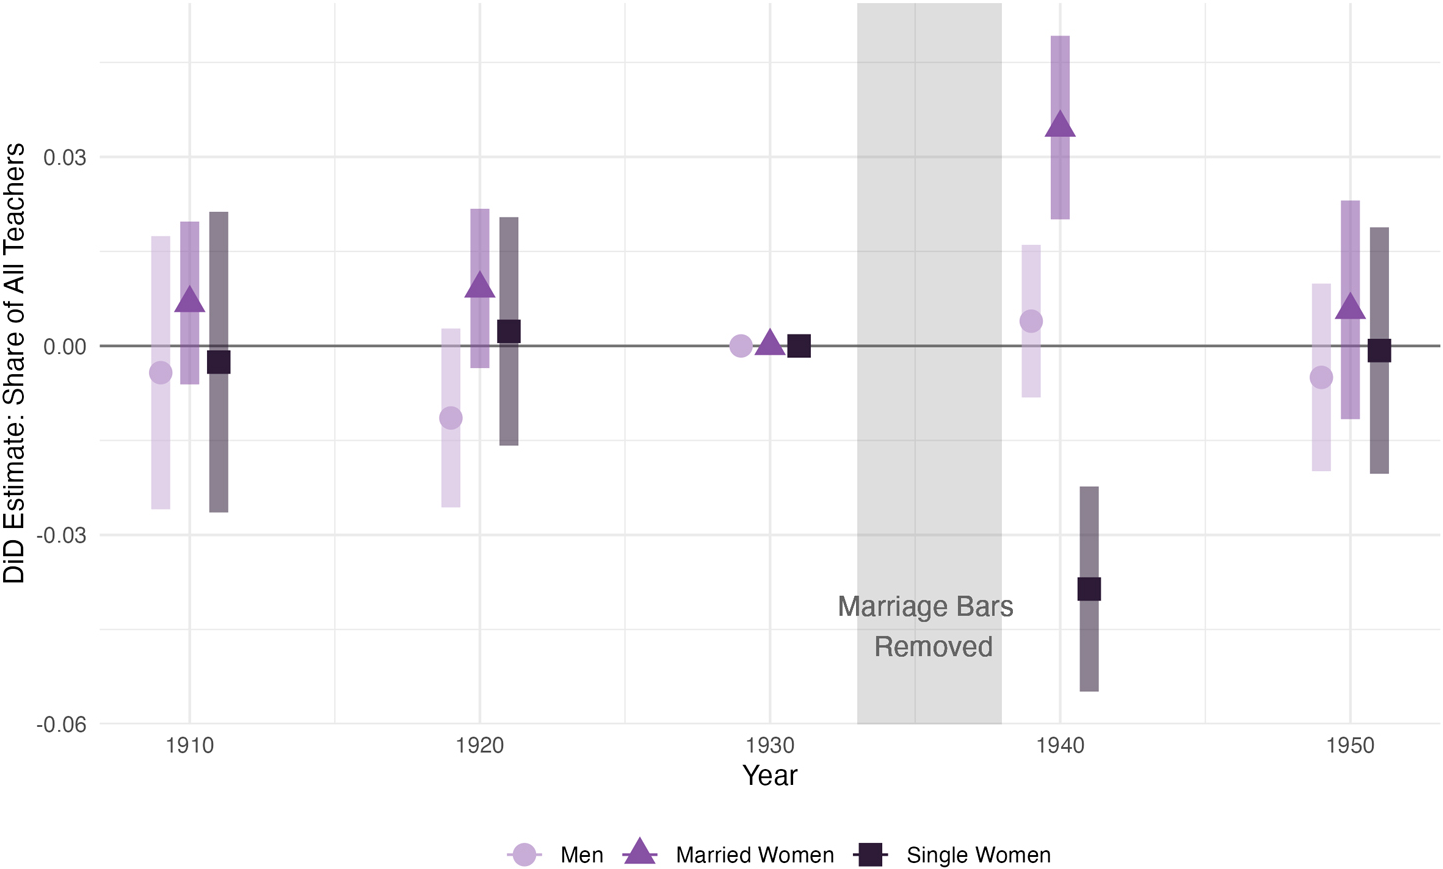
EFFECTS OF PROHIBITING MARRIAGE BARS IN TEACHING ON THE GENDER COMPOSITION OF TEACHERS
Notes: Sample includes KY, NC, and neighboring Southern states. The gender composition of teachers is measured at the county level.
Sources: 1910–1950 decennial Censuses.

Our main finding is that the prohibitions increased married women’s involvement in their local teaching workforce. Schools became more likely to employ married women among their teaching staff: relative to control counties, the share of teachers who were married women increased by 3.5 p.p. in treated counties between 1930 and 1940, roughly a 20 percent increase from 1930 when the mean share of teachers who were married women was only 17.8 percent. The effect is significant at the 1 percent level. The prohibitions also resulted in roughly one additional married woman per hundred married women working as a teacher in treated versus control counties, a 15 percent increase relative to the baseline mean of 0.64 married women teachers per hundred married women.
These effects were completely driven by white teachers (Columns (3) and (4), and Figure 3a), with no effects on the composition of Black teachers (Columns (5) and (6), and Figure 3b). Footnote 23 We interpret these findings as evidence that marriage bars were binding for white women but not Black women, as posited by Goldin (Reference Goldin1991a). Our findings are consistent with the fact that white and Black women in this setting worked in segregated schools due to Jim Crow-era laws, and the fact that Black married women were more likely to work during this time period in general (Costa Reference Costa2000).
EFFECTS OF PROHIBITING MARRIAGE BARS IN TEACHING ON THE GENDER COMPOSITION OF TEACHERS, BY RACE.
Notes: Sample includes KY, NC, and neighboring Southern states. The gender composition of teachers is measured at the county level.
Sources: 1910–1950 decennial Censuses.

One might be concerned that schools responded to the prohibitions by changing the margin on which they discriminated against married women: for example, by letting go of women if and when they had children instead. However, Online Appendix Figure A1 shows that the share of women teachers with children increased by 2.1 p.p. following the prohibitions being passed, suggesting that we can reject the null hypothesis that schools fully substituted toward discriminating against women with children.
Notably, the effect of the prohibitions on married women’s participation in teaching in treated states was relatively short-lived. By 1950, the gap between treated and control counties in the share of teachers who were married women shrank to be indistinguishable from zero. These results indicate that as employment discrimination against married women faded nationwide in the 1940s, control counties effectively “caught up” to treated counties in employing more married women in teaching.
Mechanisms Behind Direct Effects
What are the mechanisms driving our main effect? Did the prohibitions pull married women into the labor force (an “extensive margin” effect), or did the prohibitions only affect women who would have worked even absent the policy (an “intensive margin” effect), by either inducing unmarried teachers to marry or by inducing married workers to switch to teaching?
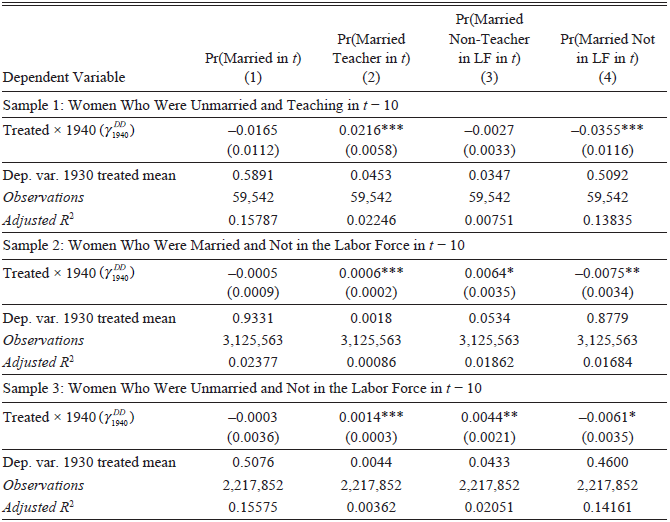
We answer this question using our linked Census data, which allows us to trace out individual transitions into marriage and employment for three groups of white women, grouped by their marital and employment status in year t − 10: (1) unmarried women teachers, (2) married women not in the labor force, and (3) unmarried women not in the labor force.Footnote 24 Results from estimating Equation (2) for each group are shown in Table 3. Given our findings that the marriage bars had no direct effects on Black teachers, from here on, we focus on white teachers in our analysis of mechanisms.
ESTIMATED EFFECTS OF THE PROHIBITIONS ON WHITE WOMEN’S PROPENSITY TO GET MARRIED AND EITHER TEACH, WORK OUTSIDE OF TEACHING, OR EXIT THE LABOR FORCE

Table 3 Long description
The table presents data on the estimated effects of prohibitions on white women's propensity to get married and either teach, work outside of teaching, or exit the labor force. It is divided into three samples: women who were unmarried and teaching, women who were married and not in the labor force, and women who were unmarried and not in the labor force. Each sample includes columns for the probability of being married, married teachers, non-teacher in the labor force, and not in the labor force. The table lists values for the treated variable in 1940, the dependent variable's 1930 treated mean, the number of observations, and the adjusted R-squared value. For example, in Sample 1, the treated variable in 1940 is -0.0165 with a standard error of 0.0112, and the dependent variable's 1930 treated mean is 0.5891. Sample 2 shows the treated variable in 1940 as -0.0005 with a standard error of 0.0009, and the dependent variable's 1930 treated mean is 0.9331. Sample 3 indicates the treated variable in 1940 is -0.0003 with a standard error of 0.0036, and the dependent variable's 1930 treated mean is 0.5076.
Notes: Estimation uses a difference-in-differences approach as outlined in the Empirical Strategy section. To construct our estimation samples, we identify women in treated states (KY, NC) and neighboring Southern states (VA, SC, TN, WV) in 1920, 1930, and 1940 whom we can link over consecutive Census years (between 1910 and 1920, 1920 and 1930, or between 1930 and 1940) using Census Tree linkages. From these women, we construct three samples: Sample 1, containing linked women who were aged 16–40, white, unmarried, and teaching in 1910, 1920, and 1930; Sample 2, containing linked women who were aged 18–50, white, married, and not in the labor force in 1910, 1920, and 1930; and Sample 3, containing linked women who were aged 8–40, white, unmarried, and not in the labor force in 1910, 1920, and 1930. All regressions are at the individual-year level, include year, county, and age fixed effects, and are clustered at the county level. *p < 0.10, **p < 0.05, ***p < 0.01
Source: All regressions use the 1910–1920, 1920–1930, and 1930–1940 linked full-count Census samples from IPUMS and Census Tree.
We start by looking at the effects for women who were unmarried and teaching in 1930 in Panel 1. Column (2) shows that the prohibitions led to a 2.2 p.p. increase in the likelihood that unmarried women teachers got married and continued teaching ten years later—an economically large effect, given that only 4.5 percent of unmarried women teachers in our linked sample in 1920 were both married and teaching in 1930. Strikingly, we also find that the increase was entirely driven by changes in women’s decisions to work rather than their decision to marry. The prohibitions did not increase the marriage rate for unmarried women teachers (Column (1)). Instead, unmarried women teachers responded to the prohibitions by getting married “as planned” but keeping their jobs: their propensity to exit the labor force fell by 3.0 p.p. (Column (4)), with no change in their likelihood of working outside of teaching (Column (3)). The prohibitions therefore had an extensive margin effect on the LFP of unmarried women teachers by keeping them in the labor force when they would have left after marriage in the absence of the prohibitions.Footnote 25
Next, we examine the effects for married women who were not in the labor force prior to the prohibitions. Results are shown in Panel 2. The majority of married women in our linked sample who were not in the labor force in 1920 stayed married (93 percent) and remained out of the labor force (88 percent) in 1930. Yet the prohibitions led to a 0.06 p.p. increase in the likelihood that married women who were previously not in the labor force became teachers (Column (2))—a 33 percent increase relative to the small baseline share of white married women who entered teaching after marriage—and led women to be less likely to stay out of the labor force (Column (4)).
Finally, we examine the effects on unmarried women who were not in the labor force prior to the prohibitions. Panel 3 shows that these women became 0.13 p.p. more likely to get married and enter teaching following the prohibitions (a 30 percent increase, shown in Column (2)), as opposed to getting married and staying out of the labor force (Column (4)). While our lack of intercensal data prevents us from disentangling the explicit mechanisms underlying this result, the increase could have been driven by either of the channels discussed previously: by women becoming teachers and then staying in teaching post-marriage, or by entering teaching for the first time after marriage.
Interestingly, Column (3) seems to suggest that the prohibitions weakly increased the likelihood that married women worked in non-teaching jobs as well. The magnitude of the effect is small relative to the other estimates (a 10 to 12 percent increase) and could be indicative of spillover effects of the prohibitions in teaching to other occupations. However, another interpretation could be that married women’s LFP was rising faster in treated states than in control states across all occupations, which would violate the parallel trends assumption. We find evidence that this is not a concern, as the estimate is not robust to controlling for unemployment, excluding counties affected by the Tennessee Valley Authority (TVA), or restricting to only counties bordering neighboring states (Online Appendix Table B6, Columns (4), (5), and (6)).
Our results suggest that the increase in married women in teaching was driven entirely by changes in extensive margin labor supply, both by increasing retention of incumbent teachers who would otherwise have exited the labor force and by increasing hiring of women who would have otherwise remained out of the labor force. We find no evidence of negative effects on the LFP of women who were already in the labor force or who would have entered the labor force even absent the prohibitions, as shown in Online Appendix Table B4.
Furthermore, our estimates suggest that new hiring contributed more to the increase in married women teachers than the retention of incumbent teachers did. To see this, we scale the estimated effects in Table 3 by the total number of treated white women in each group in 1930. Although the effect size in percentage points is largest for unmarried women teachers (2.2 p.p.), there were fewer than 8,000 such women in our treated linked sample in 1930, suggesting the prohibitions led to the retention of an additional 168 married women teachers. In contrast, there were more than 434,000 married women outside of the labor force in our treated linked sample in 1930, meaning our effect size of 0.06 p.p. translates to an increase of 258 married women teachers due to new hiring. We conclude that roughly 60 percent of the overall increase in married women teachers was due to the hiring of married women who were not in the labor market in 1930.Footnote 26
Effects on Men and Unmarried Women
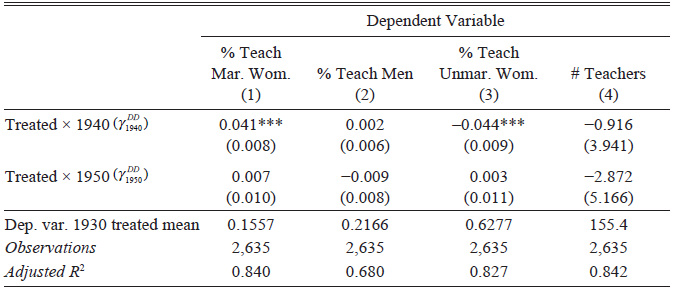
What were the consequences of the prohibitions on the employment of men and unmarried women, who were not directly targeted by the marriage bar prohibitions? We first look at effects within teaching. One possibility is that the influx of married women led to an overall expansion of the teacher labor force, resulting in larger teacher populations with no effects on men and single women teachers. We are able to conclusively rule out this possibility in Table 4: Column (4) (and Online Appendix Figure A2) shows that the prohibitions had no effect on the total number of white teachers per county. It must therefore be the case that the increased share of married women teachers resulted in a corresponding decrease in the share of men and/or single women teachers. To confirm this, we estimate Equation (1) using as outcomes the share of teachers who were men and unmarried women.
ESTIMATED EFFECTS OF THE PROHIBITIONS ON THE GENDER COMPOSITION OF WHITE TEACHERS

Table 4 Long description
A table with four columns and five rows, showing the estimated effects of prohibitions on the gender composition of white teachers. The columns are labeled '% Teach Mar. Wom.', '% Teach Men', '% Teach Unmar. Wom.', and '# Teachers'. The rows are labeled 'Treated x 1940', 'Treated x 1950', 'Dep. var. 1930 treated mean', 'Observations', and 'Adjusted R2'. Each cell contains numerical values representing the data for each category. The table provides insights into how the prohibitions affected the share of married women, men, and unmarried women teachers, as well as the total number of teachers.
Notes: Estimation uses a difference-in-differences approach as outlined in the Empirical Strategy section. The estimation sample includes counties in treated states (KY, NC) and neighboring southern states (VA, SC, TN, WV) in 1910–1950. The outcomes in Columns (1), (2), and (3) are the share of white teachers who are married women, men, and unmarried women respectively (note that these categories are exhaustive). The outcome in Column (4) is the total number of white teachers in a county. All regressions are at the county-year level, include year and county fixed effects, and are clustered at the county level. *p < 0.10, **p < 0.05, ***p < 0.01
Source: All regressions use the 1910, 1920, 1930, 1940, and 1950 IPUMS full count Censuses.
Results for all teachers are shown in Figure 2, with results split by race in Figure 3 and for white teachers only in Table 4. Consistent with our earlier finding that marriage bars were not binding for Black married women, Figure 3b shows that the prohibitions had no effect on Black men or Black unmarried women teachers either. For white teachers, however, Figure 3a and Table 4 show that the increase in married women teachers was entirely offset by a 4.4 p.p. (7 percent) decrease in the share of teachers who were unmarried women, with no effect on the share of teachers who were men. We interpret the maintained ratio of men to women white teachers after the prohibitions as being consistent with two common beliefs that schools and other employers held at the time: (1) that men and women workers were imperfect substitutes, and/or (2) that employing men took priority over employing women. For example, schools that held the former belief might have allocated men and women teachers to different types of teaching positions (high schools or elementary schools, for instance) based on beliefs about comparative advantages, while schools that held the latter belief might have only hired a married woman at the expense of letting go of an unmarried woman to uphold to the norm that men needed jobs to provide for their families.
What happened to the white unmarried women who left teaching following the prohibitions? Did they switch to other occupations, or were they pushed out of the labor force entirely? We explore this question using our linked sample of unmarried women teachers. Because we found in the previous section that these women became no more likely to marry due to the prohibitions, we can restrict our analysis to the sample of women who remained unmarried and examine their employment outcomes after the prohibitions were passed.
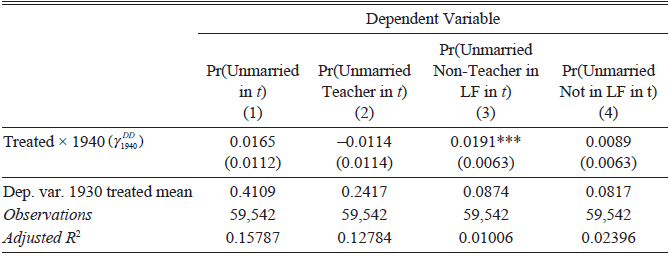
Table 5 shows the estimated effects of the prohibitions on the likelihood that unmarried women teachers in t − 10 remained unmarried (Column (1)) and either stayed teachers (2), stayed in the labor force but changed occupations (3), and left the labor force (4). In line with Table 4, we find a noisy decrease in the likelihood that unmarried women teachers remain unmarried women teachers. However, we also find that the prohibitions significantly increased the likelihood of unmarried women teachers switching occupations by 1.9 p.p. (22 percent), with no effect on the likelihood of leaving the labor force. These estimates suggest that the prohibitions led to some unmarried women switching to other occupations, but did not push them out of the labor force altogether.
ESTIMATED EFFECTS OF THE PROHIBITIONS ON WHITE UNMARRIED WOMEN TEACHERS’ PROPENSITY TO REMAIN UNMARRIED AND EITHER TEACH, WORK OUTSIDE OF TEACHING, OR EXIT THE LABOR FORCE

Table 5 Long description
The table has four columns and five rows, including the header row. The columns are labeled as follows: (1) Pr(Unmarried in t), (2) Pr(Unmarried Teacher in t), (3) Pr(Unmarried Non-Teacher in LF in t), and (4) Pr(Unmarried Not in LF in t). The rows include the treated effect, dependent variable 1930 treated mean, number of observations, and adjusted R-squared value. Each cell contains numerical values representing the estimated effects and statistical measures. The table shows the impact of prohibitions on the likelihood of unmarried women teachers remaining unmarried, staying teachers, switching occupations, or leaving the labor force.
Notes: Estimation uses a difference-in-differences approach as outlined in the Empirical Strategy section. To construct our estimation sample, we identify women in treated states (KY, NC) and neighboring Southern states (VA, SC, TN, WV) in 1920, 1930, and 1940 whom we can link over consecutive Census years (between 1910 and 1920, 1920 and 1930, or between 1930 and 1940) using Census Tree linkages. From these women, we construct a sample of linked women who were aged 16–40, white, unmarried, and teaching in 1910, 1920, and 1930. We use this sample for all regressions. All regressions are at the individual-year level, include year, county, and age fixed effects, and are clustered at the county level. *p < 0.10, **p < 0.05, ***p < 0.01
Source: All regressions use the 1910–1920, 1920–1930, and 1930–1940 linked full-count Census samples from IPUMS and Census Tree.
These displaced unmarried women teachers did not leave to lower-paying jobs, but we find some evidence that they may have been induced to move. Online Appendix Table B5 examines the effect of the prohibitions on the occupational scores (Columns (2) and (3)), LFP (Columns (4) and (5)), and mobility (Columns (6) and (7)) of unmarried women teachers, where occupational scores function as a proxy for earnings given income was not collected in the Census prior to 1940. Although the prohibitions resulted in higher average occupational scores and labor force participation across all incumbent unmarried teachers (Columns (2) and (4)), we find these increases were entirely driven by those in treated states who got married and kept their jobs (Columns (3) and (5)). These findings suggest that unmarried teachers who stayed unmarried kept working at a similar rate following the prohibitions, and that those who switched jobs moved to occupations that paid similarly to teaching. Similarly, although the prohibitions increased movement out of state on average across all incumbent unmarried women teachers (Column (6)), we find that this difference is almost entirely driven by those who remained unmarried (Column (7)). These results are consistent with incumbent teachers (in particular, unmarried women, who experienced no positive retention effects from the prohibitions) pursuing other jobs or wanting to teach in states that were unaffected by the prohibitions.Footnote 27
In summary, we show that the prohibitions pulled married women into the workforce, both through the retention of incumbent teachers who got married and through the increased hiring of women who were originally outside the labor force. We also show that this effect did not come at the expense of incumbent teachers who remained unmarried—these teachers maintained the same rate of LFP, either in teaching or in jobs that paid similarly to teaching (Online Appendix Table B5, Columns (2) and (4)). Together, these results suggest that the prohibitions had a net positive impact on women’s labor force participation. That said, because teachers comprised only a small share of all women (2.2 percent of working-age women in 1930), we detect no statistically significant effect of the prohibitions on the overall LFP of women, as shown in Online Appendix Table B8 (Ruggles et al. Reference Ruggles, Nelson, Sobek, Fitch and Ronald Goeken2024).
Robustness Checks
Though the absence of pre-trends and the historical context lend credibility to our identifying assumption of parallel trends in treated and control counties, one may still be concerned that the estimates are being driven by factors other than the prohibition of marriage bars in teaching. We test the robustness of our results in four ways: implementing a placebo test studying secretaries instead of teachers, varying the control group by using both a matched counties design and a border county design, conducting a state-level analysis using synthetic difference-in-differences, and including controls for factors that may have varied by county and year. We also discuss the relationship between our results and the Great Depression and the New Deal.
SECRETARY PLACEBO
First, to test whether the bans may have coincided with differential trends in attitudes toward employing married women or economic conditions in treated and control states, we conduct a placebo test by examining whether the prohibitions in teaching affected workers in a different occupation: secretarial/clerical work. Much like teaching, secretarial/clerical work was an occupation that was dominated by women during the early 1900s, and in which employers regularly discriminated against women based on their marital status (Goldin Reference Goldin1991a). Were it the case that the prohibitions in teaching were induced by differential trends in attitudes or employment of married women in the treated and control states, one might expect to see an increase in the share of secretaries who were married women in treated counties as well. To test this, we estimate Equation (1) using outcomes related to the employment of secretaries rather than our teaching-related outcomes of interest. The results are shown in Online Appendix Figure A3, which is analogous to Figure 2 but for secretaries, showing the effects of the prohibitions in teaching on the share of secretaries who were married women (triangles), men (circles), and unmarried women (squares). We find no significant effects of the prohibitions in teaching on the composition of the secretarial workforce, particularly between 1930 and 1940.
ALTERNATE CONTROL GROUPS
Second, we examine whether our main results are driven by our choice of control group. We use neighboring Southern states as our preferred control group because of their geographical proximity and cultural similarity to the treated states. However, one might be concerned that the neighboring Southern states do not provide the closest comparison possible to the treated states.
We address this concern in Online Appendix C by evaluating whether our results are sensitive to using alternate control groups. In our first approach, we restrict our county sample to only include “border” counties, which are plausibly even more similar to each other than neighboring states are over time. In our second approach, we keep all treated counties in our analysis but choose or weight control counties using various matching techniques. Our main results remain similar under both approaches.
STATE-LEVEL ANALYSIS
Our preferred specifications use county- or individual-level outcomes. Here, we investigate whether our results are sensitive to using state-level outcomes or state-level clustering of standard errors. To implement a state-level analysis with only two treated states, we use a synthetic difference-in-differences approach, outlined in Online Appendix D. The magnitudes and significance levels of our estimates remain similar. We also find that our main results are robust to clustering at the state level (using the wild cluster bootstrap as in Cameron, Gelbach, and Miller (2008) and Canay, Santos, and Shaikh (Reference Canay, Santos and Shaikh2021)), as shown in Online Appendix Figure A4.
ADDITIONAL CONTROLS
Our main specifications include year and county fixed effects without additional controls. However, particularly due to the Great Depression, there were also county-level time-varying factors that are not accounted for by county fixed effects. To address this, Column (4) of Online Appendix Table B3 shows the effect of the prohibitions on the share of teachers who are married women, including controls for county-level unemployment rates (to account for the effects of the Great Depression), shares of workers in manufacturing and in agriculture (to account for possible changes in demand for education), and log county population, and restricts the sample to only 1930 and 1940 (when data on unemployment is available). We find that our main results do not change with the inclusion of these controls.
THE GREAT DEPRESSION AND NEW DEAL
Finally, we discuss the robustness of our results to the impacts of the Great Depression and New Deal. Our alternate control group designs allow us to address the potential bias caused by treated states being more severely impacted overall by the Great Depression than control states. In our border counties design, we compare counties that share similar industry compositions and other unobservable characteristics before 1933, and hence are more likely to experience similar effects of the Great Depression and more similar New Deal support. In our matched counties design, we match counties on retail sales per capita in 1929 and growth over time. We also examine how our results are affected by including controls for county unemployment rates and industry compositions. Finally, in Column (5) of Online Appendix Table B6, we present our results excluding counties in the TVA. As discussed earlier, our results are robust to all these specifications, suggesting that any biases caused by the Great Depression are minimal.
CONCLUSION
This paper provides new evidence on the effects of a historical policy that sought to prevent U.S. employers from discriminating against women on the basis of marital status during a time period when white married women were largely kept out of the labor market. Employment discrimination against married women in school districts and debates over tenure protection for teachers were both at their height in the 1930s. In the midst of this policy environment, legislators in Kentucky and North Carolina successfully passed state legislation prohibiting the use of marriage bars in schools. The fact that only two states passed such legislation in the 1930s, along with the fact that neighboring states never passed similar legislation, allows us to use a difference-in-differences design to estimate the effects of the prohibitions on married women’s employment in teaching.
We find that the protections led to an increase in the share of teachers who were married women, an effect driven by white women who changed their decisions to work rather than their decisions to marry. We find no effect of the prohibitions on Black women’s employment in teaching, consistent with the fact that Black women had significantly higher rates of LFP during this time period. However, we also find that the increase was offset by a decrease in the share of teachers who were unmarried women, with no effect on men no on the total number of teachers. We find evidence that the decrease was driven by incumbent unmarried women teachers switching from teaching to other similarly paying occupations. Overall, our findings show that the policy pulled white married women into teaching who would have otherwise not been in the labor force, and while the policy did displace some unmarried women from teaching, they largely switched into other occupations and did not reduce their labor force participation. Our results are largely robust to various matching specifications.
Our study provides causal evidence that, despite the strong social norm that married women stayed out of the labor force in the early 1900s United States, there was demand among white women to work while married. Making discriminatory hiring practices against married women illegal in one occupation, even as early as the 1930s, pulled more white married women into the labor market in just a few years.
More generally, our findings suggest that the broader decline of marriage bar use across occupations may have been an important force behind the rise in women’s LFP by 1950. Marriage bars were already in steep decline by the 1950s and had largely disappeared by the 1960s (Goldin Reference Goldin1991a). At the same time, women’s LFP rose sharply between 1940 and 1960, and existing work highlights the role of WWII war production in driving the increase. More recent research, however, shows that while war production initially drove higher women’s LFP, the war itself had little impact on women’s LFP in 1950 (e.g., Rose Reference Rose2018). Given how quickly prohibiting marriage bars in a single occupation raised LFP among women at the margin of teaching, our results suggest that the nationwide demise of marriage bars by 1950 meaningfully contributed to the broader rise in women’s LFP, compounding the labor demand shock driven by WWII.




 Open access

