INTRODUCTION
Chemoreception is widely used by gastropods for mating, feeding, homing, predator avoidance and social behaviour (see Croll, Reference Croll1983 for a review). Particularly, in intertidal habitats, water- and air-borne odorant substances released into the environment guide mobile organisms towards both food and conspecific aggregate (Fratini et al., Reference Fratini, Cannicci and Vannini2001) and away from predators (Keppel & Scrosati, Reference Keppel and Scrosati2004; Wyeth et al., Reference Wyeth, Woodward and Willows2006). Likewise, chemoreception drives the well documented trail following behaviour involved in homing behaviour (Chelazzi et al., Reference Chelazzi, Della Santina and Parpagnoli1990), and in the location of sexual partners (Erlandsson & Kostylev, Reference Erlandsson and Kostylev1995), preys (Shaheen et al., Reference Shaheen, Patel, Patel, Moore and Harrington2005) or predators (Dix & Hamilton, Reference Dix and Hamilton1993). Given the critical ecological role played by gastropods in structuring intertidal environments through, e.g. the control of algal growth (Stafford & Davies, Reference Stafford and Davies2005) and sediment dynamics (Kamimura & Tsuchiya, Reference Kamimura and Tsuchiya2006), understanding the determinism of gastropod navigation is an absolute prerequisite to explain the dispersion, distribution and local biodiversity of other sessile and mobile species (Chapman, Reference Chapman2000).
Orientated movements related to trail following (Erlandsson & Kostylev, Reference Erlandsson and Kostylev1995; Edwards & Davies, Reference Edwards and Davies2002) and processes such as phototaxis (Charles, Reference Charles1961; Petraitis, Reference Petraitis1982) and geotaxis (Petraitis, Reference Petraitis1982) have been investigated in Littorina littorea, one of the most abundant species of intertidal gastropod in north-western Europe (Chapman et al., Reference Chapman, Carlton, Bellinger and Blakeslee2007). Especially, directional movements of L. littorea individuals may follow dislodgement by breaking waves (Petraitis, Reference Petraitis1982) like in the high hydrodynamic intertidal area (Seuront et al., Reference Seuront, Duponchel and Chapperon2007). Though dislodgement is not always fatal, individuals can be displaced in unsuitable habitats, thus potentially reducing their survival (Miller et al., Reference Miller, O'Donnell and Mach2007). Nevertheless, informations about L. littorea navigation towards an appropriate environment following a dislodgement event and the role played by chemical water- and air-borne odours are still critically lacking.
Recent results indicated that Littorina keenae showed a strong preference for returning to the approximate tidal height from which they were dislodged, but no evidence of homing behaviour back to the original site of dislodgement was found (Miller et al., Reference Miller, O'Donnell and Mach2007). More specifically, we are not aware of any investigation related to the ability of dislodged snails to home back to their original site, when dislodgement occurs over a large area located at the same tidal level. The goals of this study were: (i) to simulate the dislodgement of Littorina littorea individuals at increasing distances from their rocky substrate; (ii) to examine whether L. littorea individuals are able to move back to their point source following dislodgement; and (iii) to assess which kind of chemical cues may be involved in the navigation process.
MATERIALS AND METHODS
The studied site was a large (~40 m × 60 m) flat rocky platform surrounded by a sandy flat situated on the mid–high intertidal zone of a wave-swept intertidal area along the French coast of the eastern English Channel. The site was specifically chosen for its exposure to wave action under neap tide conditions, and high abundance of the common herbivorous gastropod Littorina littorea (152 ± 21 ind m−2,  ± SD). Dislodgement experiments were specifically conducted during the mating season (i.e. March and early May 2006; Erlandsson & Johannesson, Reference Erlandsson and Johannesson1994) where L. littorea individuals are expected to be more sensitive to chemical cues from conspecific individuals. More specifically, L. littorea individuals were dislodged from an oblong rock (60 cm long, 30 cm wide and 40 cm high) located on the sandy flat, 5 m away from the platform, only a few metres from the upper limit reached by the tidal flow during neap tides. Littorina littorea was consistently very abundant on the rock (700 to 800 individuals), and only a few individuals were observed on the sand near the seaward side of the rock. The consistent absence of snails on the sand during emersion suggested that individuals were capable of reaching the rock substrate while underwater, during the period L. littorea individuals are active (Newell, Reference Newell1958).
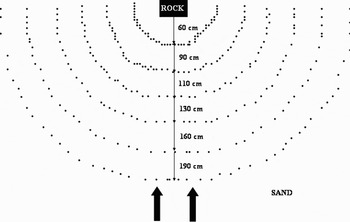
Littorina littorea individuals were manually dislodged from the rock during daylight low tides and placed randomly on concentric semi-circles centred on the rock with increasing radii, i.e. 60, 90, 110, 130, 160 and 190 cm (Figure 1). To determine the processes involved in the navigation towards the rock following dislodgement, four duplicate treatments were applied to the rock to gradually decrease the number of cues available to the dislodged snails. Sex determination was not conducted in this study to avoid any behavioural bias induced by the handling-related disturbance. However, a preliminary work has shown L. littorea sex ratio to be constant over successive tidal cycles at the study site (Seuront, unpublished data). First, a control experiment, duplicated on 24 March 2006 and 19 April 2006, consisted in relocating snails on the semi-circles without modifying the sand and the rock (Experiment A). Second, sediment surface surrounding the rock was scraped on a radius of 2 m to remove mucus trails and their related chemical information (Experiment B). This experiment was conducted on 8 and 20 April 2006. Third, to remove all the infochemicals related to the presence of conspecific and microphytobenthos on the rock, all L. littorea individuals were removed from the rock which was then carefully scraped with a metallic brush and rinsed with seawater filtered on Whatman GF/F glass-fibre filters (porosity 0.45 µm) and autoclaved (Experiment C). This experiment was carried out on 22 April and 5 May 2006. Finally, the infochemicals present on the sediment and the rock were both removed as described for Experiments B and C (Experiment D) on 25 March and 9 May 2006. Air temperature and wind speed ranged from 6.9 to 14.7°C and from 1 to 9 m s−1, respectively. No significant differences were found between the air temperature and wind speed observed during our experiments (Kruskal–Wallis H-test, P > 0.05). The experimental area was consistently affected by waves 40 to 70 cm in height during each set of experiments. One hundred individual snails were used at each of the six distances considered (Figure 1), and identified using six different enamel paints. Snails were considered as undisturbed by the dislodgement and painting process as preliminary experiments conducted on a set of 176 individuals did not lead to any unresponsiveness, identified by a failure to attach to the side of an aquarium and a subsequent lack of motility (Seuront, unpublished data). This is consistent with previous observations on Nodilittorina pyramidalis (Chapman & Underwood, Reference Chapman and Underwood1994), Littorina keenae (Miller et al., Reference Miller, O'Donnell and Mach2007) and Littorina littorea (Seuront et al., Reference Seuront, Duponchel and Chapperon2007). The number of individuals that returned to the original rock was counted at the next daytime low tide and expressed as a return rate.
Schematic top view of the experimental area. Black points are Littorina littorea individuals (N = 100 per distance) dislodged from the rock (black rectangle) and relocated at increasing distances (60, 90, 110, 130, 160 and 190 cm) on the sand. The black arrows indicate the water flow direction during flood tide. A total of 1200 individuals were used for each set of experiments.

To estimate the effect of a decreasing number of available cues, we used a ‘cue effect’ index calculated as the ratio between the mean return rate observed in Experiment A to those found in the other experiments. As each experiment has been duplicated, non-parametric statistics were used throughout this work. Correlation between the return rates and the distance of dislodgement were investigated using the Kendall's coefficient of rank correlation. Comparisons of the return rates between duplicates within each experiment were performed using the Kolmogorov–Smirnoff two sample test (KS test hereafter), and comparisons between the four experiments were conducted using the Kruskal–Wallis H-test (KW test hereafter).
RESULTS
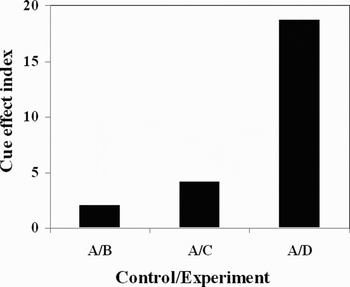
The return rates were only significantly negatively correlated with the distance in Experiment C (P < 0.05). For each experiment, no significant difference (KS test, P > 0.05) was found between the duplicated return rates. In contrast, significant differences (KW test, P < 0.05) were found between the four experiments. On average, the return rates observed were 22 ± 5% and 31 ± 6% in Experiment A (control), 12 ± 3% and 13 ± 1% in Experiment B (sand-borne cues removed), 6 ± 1% and 7 ± 1% in Experiment C (rock-borne cues removed), and 1 ± 0% and 2 ± 0% in Experiment D (both rock-borne and sand-borne cues removed). The return rates were then 2, 4 and 19 times higher in the control experiment than in Experiments B, C and D, respectively (Figure 2). This indicates a strong decrease in the attractiveness of the rock for L. littorea from Experiment A to D.
Cue effect index of Littorina littorea. Cue effect index was estimated as the ratio between the mean return rate observed in Experiment A (26.5 ± 3.7%, control experiment), those observed in Experiment B (12.7 ± 1.5%, sand-borne cues removed), Experiment C (6.3 ± 0.4%, rock-borne cues removed) and Experiment D (1.4 ± 0.2%, both rock-borne and sand-borne cues removed). A total of 1200 individuals were used for each set of experiments.

DISCUSSION
Dislodgement experiments conducted on L. littorea (present work) and L. keenae individuals (Miller et al., Reference Miller, O'Donnell and Mach2007) demonstrated that Littorina sp. does not exhibit a marked homing behaviour. Following wave dislodgement, L. keenae was found to return to their previous height level (54–90%; Miller et al., Reference Miller, O'Donnell and Mach2007) probably through geotaxis (Petraitis, Reference Petraitis1982). However, L. littorea and L. keenae return rates towards their original location were non-negligible, i.e. 22–31% (present work) and 36% (Miller et al., Reference Miller, O'Donnell and Mach2007), respectively. In this study, we found that chemical cues should also be considered as determinant in the determinism of L. littorea navigation following a dislodgement event.
In particular, rock-borne cues seem to play a stronger role than sand-borne cues as there was a 2-fold decrease in the return rate between Experiments B and C. The infochemicals involved may have been released in both water and air from a food source (Fratini et al., Reference Fratini, Cannicci and Vannini2001; Shearer & Atkinson, Reference Shearer and Atkinson2001; Fink et al., Reference Fink, von Elert and Jüttner2006) and/or conspecifics (Fratini et al., Reference Fratini, Cannicci and Vannini2001) inhabiting the rock. In particular, feeding attractants may be volatile organic compounds released by the microfilm at the surface of the rock (Fink et al., Reference Fink, von Elert and Jüttner2006). These infochemicals are likely to diffuse around the rock during high tide, creating a gradient of concentration. Nevertheless, the diffusion of chemicals probably did not happen in this study as no correlation was observed between the return rates and the distance in Experiment B, when the sand-borne cues were removed. Here, infochemicals were more probably spread away from the rock through odour plumes (Zimmer & Butman, Reference Zimmer and Butman2000) heading towards the sea during ebb tide. This assumption is consistent with the proximity of the rock to the upper limit of the tidal flow, the related wave mixing and the consistent absence of L. littorea between the rock and the upper limit of the tidal flow (Chapperon & Seuront, personal observation).
The removal of the superficial sediment layer and the related dense web of mucus trails led to a 2-fold decrease in the return rate in Experiment B when compared to the control experiment (Figure 2). This suggests that sand-borne cues might also be involved in L. littorea navigation. In particular, infochemicals contained in mucus trails are known to stimulate mollusc homing behaviour, through trail following (Chelazzi et al., Reference Chelazzi, Della Santina and Vannini1985; Chelazzi, Reference Chelazzi1990). In this study, trail following-related homing behaviour unlikely occurred regarding the low return rate observed in Experiment C where rock-borne cues were removed. However, the significant negative correlation between the return rates and the distance from the rock in Experiment C suggests that individuals close to the rock reached it more frequently than farther ones even if the rock-borne cues were removed. As the experimental rock seemed to be a focal point for L. littorea due to the consistently high abundance of snails found on the rock at low tide (up to 800 individuals) and the related absence of snails on the surrounding sand flat, this may suggest the existence of a denser web of mucus trails on the sand near the rock. Mucus trails have indeed widely been shown to attract intertidal gastropods in relation to energy saving (Davies & Blackwell, Reference Davies and Blackwell2007), bound microalgae grazing (Edwards & Davies, Reference Edwards and Davies2002) and mating search (Erlandsson & Kostylev, Reference Erlandsson and Kostylev1995). Although experiments were conducted during the mating season, our results can be generalized to the non-mating season as trail following behaviour in L. littorea is independent of the season (Erlandsson & Kostylev, Reference Erlandsson and Kostylev1995).
Finally, the insignificant return rate observed in Experiment D (19-fold lower than those of Experiment A; Figure 2) indicates that there was no additional cue than the sand- and rock-borne cues (i.e. such as visual cue; Miller et al., Reference Miller, O'Donnell and Mach2007), involved in the L. littorea navigation towards the rock. It is then suggested that the synergy between sand- and rock-borne cues may explain the differences in return rates observed in their presence (Experiment A) and absence (Experiment D; i.e. 27% and 1%, respectively).
CONCLUSION
The present work demonstrates the potential for Littorina littorea to survive in a wave-simulated dislodgement through their ability to navigate back to their original habitat. This is especially relevant in L. littorea ecology as this species typically inhabits wave-swept environments where dislodgements and displacements to unsuitable areas are a constant threat. In particular, we found that stray L. littorea individuals can return to their original habitat using rock- and sand-borne chemical cues. Hence, chemoreception seems to play a critical role in the ability of L. littorea to escape from unfamiliar environments, and decrease fitness costs related to wave-induced dislodgement.
ACKNOWLEDGEMENTS
This research was financially supported by the Centre National de la Recherche Scientifique (CNRS), the University of Sciences and Technologies of Lille (France), the Flinders University (Australia) and the Australian Research Council (ARC, Australia).