Implications
The data presented indicates that the choice of fiber source in pig feed should be decided based on the content of specific neutral sugars if the intention is to modulate the short-chain fatty acid pattern in the gut. In contrast, if the abundance of distinct bacterial communities is intended, a specific feed ingredient has to be selected.
Introduction
The non-starch polysaccharide (NSP) structure has major impact on the site of degradation and the extent of fermentation in pigs and is to a large extent linked to the solubility of the NSP fraction (Bach Knudsen et al., Reference Bach Knudsen, Hedemann and Laerke2012). For example, the microbial fermentation of soluble pectin starts in the small intestine and continues with an almost complete fermentation in the hindgut. In contrast, the microbial fermentation of insoluble NSP is low or insignificant in the small intestine and the fermentation remains low also in the hindgut (Noblet and Le Goff, Reference Noblet and Le Goff2001). Metzler-Zebeli et al. (Reference Metzler-Zebeli, Hooda, Pieper, Zijlstra, Van Kessel, Mosenthin and Ganzle2010) found that specific NSP fractions alter the ileal flow of nutrients into the large intestine, and consequently the type of NSP will be an important factor controlling the amount of available substrate for the microbiota in both ileum and colon. Awati et al. (Reference Awati, Konstantinov, Williams, Akkermans, Bosch, Smidt and Verstegen2005) suggested that it is the structure and availability of the substrate that determines the fermentation end-products rather than the microbial community that is present.
The short-chain fatty acids (SCFA) produced during carbohydrate fermentation are important for the energy supply both for the host and the epithelial cells (Cummings and Englyst, Reference Cummings and Englyst1987; Williams et al., Reference Williams, Verstegen and Tamminga2001). Among the individual SCFA, butyrate is considered as the most important energy source for colonocytes and stimulates growth and development of the intestinal cells (Barcenilla et al., Reference Barcenilla, Pryde, Martin, Duncan, Stewart, Henderson and Flit2000). In pig production, feed ingredients that stimulate a high production of SCFA, and in particular butyrate, are generally considered beneficial (Giuberti et al., Reference Giuberti, Gallo, Moschini and Masoero2013). In addition, recent studies have suggested that acetate may have an important role in the gut immune response by inducing an anti-inflammatory effect (Fukada et al., Reference Fukada, Hidehiro, Hase, Oshima, Nakanishi, Yoshimura, Tobe, Clarke, Topping, Suzuki, Taylor, Itoh, Kikuchi, Morita, Hattori and Ohno2011).
The development of culture-independent techniques has revealed how little we know about the gut microbial community in pigs. However, it is clear that the small intestine in pigs harbors a significant microbial population (Leser et al., Reference Leser, Amenuvor, Jensen, Rikke, Lindecrona and Møller2002). It has also been shown that the microbial community composition cluster in accordance with gut segment, with higher diversity in colon and fecal samples compared with ileal digesta samples (Awati et al., Reference Awati, Bosch, Tagliapietra, Williams and Verstegen2006; Liu et al., Reference Liu, Ivarsson, Dicksved, Lundh and Lindberg2012). Indeed, the fermentation of NSP is suggested to be a result of a combined action of several bacteria (Van Laere et al., Reference Van Laere, Hartemink, Bosveld, Schols and Voragen2000). Bindelle et al. (Reference Bindelle, Pieper, Leterme, Rossnagel and Van Kessel2010) showed that cereal grains with high content of insoluble NSP are slowly fermented and stimulate acetate-producing cellulolytic Ruminococcus-like bacteria and xylanolytic Clostridium-like bacteria. In contrast, feeding diets with a high content of soluble pectin have stimulated the numbers of lactobacilli in the small intestine as well as increased microbial diversity in feces (Konstantinov et al., Reference Konstantinov, Zhu, Williams, Tamminga, de Vos and Akkermans2003; Bikker et al., Reference Bikker, Dirkzwager, Fledderus, Trevisi, le Huerou-Luron, Lalles and Awati2006). Most plant-origin feedstuffs used in pig feeding contain a mixture of soluble and insoluble NSP (Montagne et al., Reference Montagne, Pluske and Hampson2003). The knowledge about effects of different native sources of NSP on the gut microbiota and its fermentation products is still scarce. Consequently, there is a gap of knowledge about interactions between the diet, gut microbiota and host health.
The current study aimed at exploring the effect of diets with different native sources of NSP on the microbial composition and the SCFA profile and lactic acid of ileal digesta and feces of growing pigs. To obtain a more complete picture of how different feed ingredients are utilized in the gastrointestinal tract (GIT), samples from both small and large intestine needs to be analyzed (Awati et al., Reference Awati, Bosch, Tagliapietra, Williams and Verstegen2006). The fecal samples were used as a reflection of the colonic fermentation (Walker et al., Reference Walker, Ince, Duncan, Webster, Holtrop, Ze, Brown, Stares, Scott, Bergerat, Louis, McIntosh, Johnstone, Lobley, Parkhill and Flint2011). The four diets studied had either high content of soluble pectins or high content of insoluble arabinoxylans. The pectin sources was either chicory forage (CFO), a novel forage crop for monogastrics, or sugar beet pulp (SBP), a widely used soluble fiber source in monogastrics. The arabinoxylan sources were either wheat bran (WB), a widely used insoluble fiber source, or grass meal (GM), a commonly used forage crop. We hypothesized that the microbial community would cluster in accordance with NSP structure (arabinoxylan v. pectin) and that addition of pectin-rich NSP would increase the microbial diversity and stimulate bacteria with pectinolytic activities as well as increase the total SCFA concentration, whereas addition of arabinoxylan-rich NSP would stimulate bacteria with xylanolytic activities.
Material and methods
Animals, housing and feeding
Seven castrated male Yorkshire pigs with an initial BW of 24.8 kg (s.d. 3.0 kg) and a final BW of 94.4 kg (s.d. 7.5) were used in the experiment. The pigs were fitted with a post-valve t-cecum (PVTC) cannula, as described by Van Leeuwen et al. (Reference Van Leeuwen, Van Kleef, van Kempen, Huisman and Verstegen1991), at an average weight of 22.8 kg (s.d. 0.79). The pigs were housed individually in pens (147×189 cm) on concrete floor with solid wooden walls between each pen and metal bars in front of the pens to allow eye contact between pigs. The pigs did not have access to bedding, but the pens were equipped with a rubber mat. Each pen had one water nipple and one water cup and the water was available ad libitum throughout the experiment. The room temperature was maintained at 19.2°C (s.d. 1.0) and an extra heat lamp was provided in each pen until the pigs had an average BW of 43.5 kg (s.d. 5.9). Artificial light was provided for 8 h/day. The feed was served as meal mixed with water (1 : 2 w/w) and was fed twice a day with equal portions at 0800 and 1600 h. The daily feed allowance was 4% of BW until the pigs reached 60 kg and was thereafter fixed at 2.4 kg/day. The pigs were weighed once a week.
The experiment was carried out at the Swedish University of Agricultural Sciences (SLU) in Uppsala and was approved by the ethical committee of the Uppsala region (application number C306/6).
Experimental design and diets
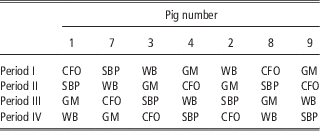
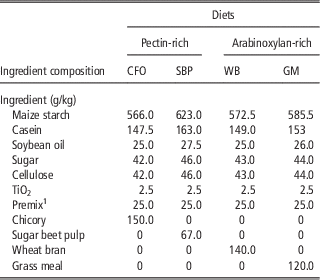
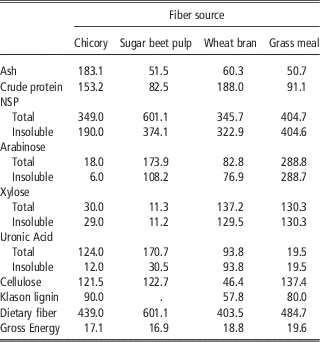
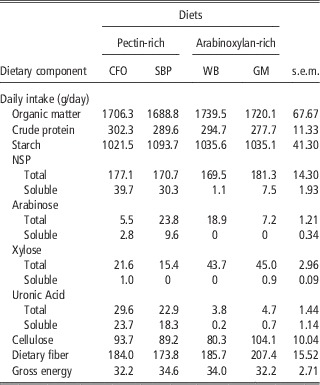
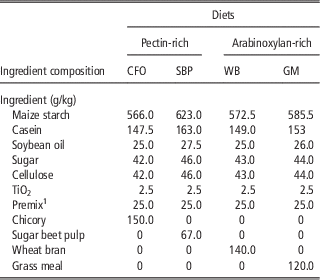
The experiment was planned with eight pigs in a double 4×4 Latin square. However, one pig did not recover from the surgery and was culled before the experiment started. Instead, the experiment was performed as a change-over experiment with seven pigs, four diets and four periods. Four of the pigs were randomly allocated to the four diets in a 4×4 Latin square, and three pigs were considered as replicates following the same feeding order as the pigs in the Latin square (Table 1). Each period lasted for 14 days. The first 7 days of each period were used to adapt the pigs to the new diets, and the 2nd week was the collection period. Four experimental diets with four different fiber sources were formulated, two pectin-rich diets, CFO and SBP, and two arabinoxylan-rich diets, WB and GM. The experimental diets were balanced to have a similar NSP content and comprised a basal diet, and one of the fiber sources. The diet composition is shown in Table 2, the chemical composition of the fiber sources is shown in Table 3 and the chemical composition of the diets is shown in Supplementary Table S1. The basal diet was based on maize starch, sugar and casein, and was formulated to meet the nutritional requirements of growing pigs (National Research Council (NRC), 1998), the daily intake of dietary components and gross energy are shown in Table 4. The fiber sources were milled through a 3.5-mm screen before they were mixed. CFO was made from vegetative shoots of chicory, harvested in July, with a stubble height of ∼5 cm and dried in an indoor area at low temperature (30°C) for a week. Grass meal was made from hay harvested in July from a mixed lay (timothy and meadow fescue). SBP was provided by Nordic Sugars A/S (Copenhagen, Denmark) and the WB was provided by Nord Mills (Uppsala, Sweden). TiO2 was included (2.5 g/kg) in the basal diet as an inert marker for digestibility calculation.
Feeding order of the diets (CFO, SBP, GM, WB) to the seven pigs in the different experimental periods

CFO=chicory forage diet; SBP=sugar beet pulp diet; GM=grass meal diet; WB=wheat bran diet.
Ingredient composition (g/kg) of the experimental diets
CFO=chicory forage diet; SBP=sugar beet pulp diet; WB=wheat bran diet; GM=grass meal diet.
1 Content per kg premix=minerals: Ca 271 g, P 51 g, Na 57 g, I 8 mg, Se 14.5 mg, Fe 2935 mg, Cu 911 mg, Mn 727 mg, Zn 4370 mg. Vitamins: retinol 194 500 IE, cholecalciferol 21 567 IE, tocopherol 2392 mg, naphthoquinone 86 mg, thiamine 86 mg, riboflavin 86 mg, pyroxidine 130 mg, cyanocobalamin 0.9 mg and niacin 859 mg.
Analyzed chemical composition (g/kg DM) and gross energy (MJ/kg DM) content of the four fiber sources used in the study
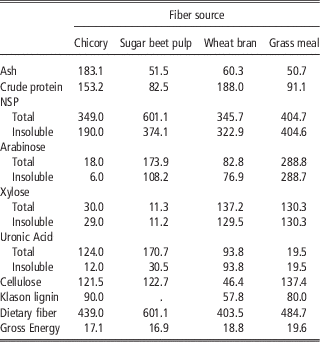
DM=dry matter; NSP=non-starch polysaccharide.
Mean daily intakeFootnote * (g/day) of dietary components and gross energy (MJ/day) of the experimental diets±pooled s.e.m.

CFO=chicory forage diet; SBP=sugar beet pulp diet; WB=wheat bran diet; GM=grass meal diet; NSP=non-starch polysaccharide.
* The intake of dietary components (g/day) and gross energy (MJ/day) was calculated as: [(Dietary component (g/kg)/1000)×daily feed intake (g)].
Sample collection
Fresh fecal samples were collected twice a day from carefully cleaned pen floor, the first 4 days of each collection period. Samples for digestibility assessment were collected in plastic bags and immediately frozen (−20°C), samples were pooled for each pig and collection period. Sub-samples for molecular microbial assessment and organic acid analysis were collected in sterile plastic tubes and stored (−80°C).
Ileal digesta samples were collected from the PVTC cannula during days 12 and 14 of the collection period. During the collection days digesta were collected during 1-h periods, on day 12 from 0900 to 1000, 1100 to 1200, 1300 to 1400 and 1500 to 1600 h and on day 14 from 0800 to 0900, 1000 to 1100, 1200 to 1300 and 1400 to 1500 h. Digesta were collected in polyethylene bags (8×30 cm), whereas the pigs were in the pens; no restriction of the pigs occurred during the sampling. The digesta samples in the collection bags were emptied into a plastic bucket as the bags filled up and were immediately frozen (−20°C), samples were pooled for each pig and collection period. Sub-samples were collected in tubes and stored (−80°C) and used for analysis of organic acids and molecular microbial analysis.
Organic acids analysis and pH determination
The digesta samples were centrifuged for 5 min at 13 000×g. The fecal samples were diluted 1 : 2 (weight basis), mixed for 2 h, centrifuged for 5 min at 25 000×g and filtered (0.45 µm) before analyses. A volume of 200 µl of the clear solution was mixed with 800 µl of the internal standard solution (0.1% of pivalic acid in 5 mm sulfuric acid). Analysis of SCFA and lactic acid of the samples was performed according to Andersson and Hedlund (Reference Andersson and Hedlund1983) by HPLC system consisting of an Alliance 2795 Separations Module with a Temperature control Module II range 40°C to 70°C and 2414 RI Detector (Waters Assoc., Milford, MA, USA), a separation column (ReproGel H 9 µm 300×8 mm) and a pre-column packet (ReproGel H, 9 µm, 30×8 mm; Dr A. Maisch, Ammerbuch, Germany). The mobile phase was 0.005 M sulfuric acid at a flow rate of 0.8 ml/min and the column temperature was kept at 60°C. Ileal digesta pH was measured on thawed samples with a pH meter (Metrohm 719 S Titrino, Herisau, Switzerland).
Terminal restriction fragment length polymorphism (T-RFLP) analysis
DNA was extracted from 200 mg fecal and ileal samples using QIAamp DNA Stool Mini kit (Qiagen, Hilden, Germany), according to the manufacturer’s instruction. To ensure appropriate lysis of bacteria, the heating step was supplemented with three cycles of heating at 95°C for 5 min followed by snap freezing in liquid nitrogen. To obtain profiles of the fecal and ileal microbial composition, extracted DNA was analyzed with the T-RFLP methodology as previously described (Dicksved et al., Reference Dicksved, Halfvarson, Rosenquist, Jarnerot, Tysk, Apajalahti, Engstrand and Jansson2008). Briefly, bacterial 16S rRNA genes were PCR amplified from each DNA extract with general primers Bact-8F 5′-end labeled with 6-carboxyfluorescein and 926r. The PCR products were digested with a restriction enzyme (HaeIII), the digested products were separated on a capillary sequencer (ABI 3730) and T-RFLP profiles were processed using Peak Scanner V1.0. Relative peak area of each terminal restriction fragment (TRF) was calculated by dividing individual peak area by total peak area within the following size limits: lower limit 50 base pairs and upper limit 500 base pairs. TRFs with a relative abundance below 0.5% were excluded from the remaining analysis. The TRF profile for each pig was based on two T-RFLP profiles; only peaks that occurred in both replicates were used for analysis. Subsequently, TRFs of interests were identified using sequence data of corresponding TRFs obtained from previous studies (Ivarsson et al., Reference Ivarsson, Liu, Dicksved, Roos and Lindberg2012a; Liu et al., Reference Liu, Ivarsson, Dicksved, Lundh and Lindberg2012).
Quantitative PCR (qPCR) of bacterial groups and genes encoding hydrolytic enzymes
QPCR assay was used to determine the amount of 16S rRNA genes of bacteria belonging to the group Lactobacillus spp., Enterobacteriaceae and Bacteroides–Prevotella–Porphyromonas. The bacterial groups were selected based on results from previous studies showing that they are dominating groups in the GIT of the pig, and also are responsive to dietary changes (Leser et al., Reference Leser, Amenuvor, Jensen, Rikke, Lindecrona and Møller2002; Bikker et al., Reference Bikker, Dirkzwager, Fledderus, Trevisi, le Huerou-Luron, Lalles and Awati2006; Metzler-Zebeli et al., Reference Metzler-Zebeli, Hooda, Pieper, Zijlstra, Van Kessel, Mosenthin and Ganzle2010; Liu et al., Reference Liu, Ivarsson, Dicksved, Lundh and Lindberg2012). For all assays each reaction contained 10 µl IQ SYBR Green Supermix (BioRad, Solna, Sweden), 0.5 µm of each primer and 2 µl of a template DNA, to a final volume of 20 µl. The thermal cycling was carried out in a CFX96 Real-Time System (BioRad) associated with the software CFX Manager (version 2.0; BioRad). The standards and negative control were run in triplicates and all samples were run in duplicates. For the standards and negative controls, extracted DNA from bacterial cultures was used. A 10-fold dilution series of the standard curves (10 to 0.0001 ng/µl) were made in RNase-, DNase- and protease-free water. Number of bacteria was expressed as number of copies/g dry matter (DM) of feces or digesta.
The program for the thermal cycling targeting the Lactobacillus spp. group was run as described by Karlsson et al. (Reference Karlsson, Molin, Cilio and Ahrne2011), and was as follows: 95°C for 5 min, followed by 40 cycles with denaturation at 95°C for 5 s, annealing and elongation at 60°C for 20 s. The fluorescent products were detected at the last step of each cycle. The primers used are shown in Supplementary Table S2. The specificity of the primers was tested by melt curve analysis and use of Enterococcus faecalis LA5:13 and Lactobacillus reuteri DSM 20016 as negative and positive controls, respectively.
The program for thermal cycling targeting the Enterobacteriaceae and Bacteroides–Prevotella–Porphyromonas was run as described by Metzler-Zebeli et al. (Reference Metzler-Zebeli, Hooda, Pieper, Zijlstra, Van Kessel, Mosenthin and Ganzle2010) and was as follows: 95°C for 5 min, followed by 40 cycles of denaturation at 95°C for 15 s, annealing at 63°C for Enterobacteriaceae and 60°C for Bacteroides–Prevotella–Porphyromonas for 30 s, elongation at 72°C for 30 s, and 1 cycle at 95°C for 1 min, 1 cycle at 55°C for 1 min. The fluorescent products were detected at the last step of each cycle. The primers used are shown in Supplementary Table S2. The specificity of the primers was tested by melt curve analysis and use of Escherichia coli DSM 498 and Bacteroidetes vulgatus DSM 1447 as negative and positive controls.
β-xylosidase (1,4-β-d-xylan xylohydrolase; EC 3.2.1.37) hydrolyses β-1,4-xylosidic bonds of xylan resulting in xylose. Primers targeting the β-xylosidase gene, xynB, were manually designed after alignments of sequences, using the multiple sequence alignment tool Clustal W2, of xynB from bacteria among the Firmicutes and Bacteroidetes known to have the gene. Aligned bacteria, primer sequences and run conditions are shown in Supplementary Table S3. Primers targeting the polygalacturonase (EC 3.2.1.15) gene that hydrolyze polygalacturonic chain of demethoxylated pectin were also designed; however, the specificity could not be confirmed and the analysis was excluded. The thermal cycling amplification targeting xynB involved one cycle at 95°C for 5 min for initial enzyme activation followed by 40 cycles of denaturation at 95°C for 5 s, primer annealing at the optimal temperatures (Supplementary Table S4) for 30 s, and a stepwise increase of the temperature from 65°C to 95°C to obtain melt curve data. Data were collected at the extension step. To verify correct amplification, melting curve analysis was performed. In addition, qPCR products from standard curves, ileal and fecal samples were sequenced as well as analyzed with gel electrophoresis to check the specificity of the reaction.
Chemical composition and calculations
The chemical composition of diets, feces and digesta, the molecular weight (mol wt) distribution of the soluble NSP fraction of the pectin-rich diets, and digesta from pigs of those treatments, as well as, the total tract (TTAD) and ileal (IAD) apparent digestibility, were analyzed and calculated as previously described by Ivarsson et al. (Reference Ivarsson, Andersson and Lindberg2012b). The amount of digested dietary components for each pig and diet (g) were calculated as
 $$\eqalignno{ [{\rm Intake}\,{\rm of}\,{\rm dietary}\,{\rm component}\,{\rm (g)}\cr &\quad{\times}({\rm TTAD}/{\rm 1}00\,{\rm or}\,{\rm IAD}/{\rm 1}00\,{\rm of}\,{\rm the}\,{\rm dietary}\,{\rm component})]$$
Statistical analysis
Simpson’s diversity index was calculated based on T-RFLP data to assess bacterial species richness and evenness (Begon et al., Reference Begon, Harper and Townsend2006). Cluster analysis of T-RFLP data was performed using Spearman rank correlation. Diet response in terms of microbiota, organic acids and pH value in digesta were assessed using the procedure Mixed in SAS (version 9.1, SAS Institute, Cary, NC, USA). The model included diet (CFO, SBP, WB and GM) and period (I, II, III and IV) as fixed factor and pig as a random factor. Carry-over effects from the previous period were tested as a fixed factor in the model. The effect of diet and differences between diets were tested using least square means. Pearson correlations (r), estimated with the procedure CORR in SAS, were used to correlate the abundance of bacterial groups in digesta and feces to intake of dietary components and amount of digested dietary components in ileal digesta and feces, as well as used to evaluate the relationship between the abundance of bacterial groups and mol wt distribution. Pearson correlations (r) were also used to correlate the amount and proportion of organic acids and abundance of bacterial groups; the amount and proportion of organic acids to intake of dietary components and amount digested dietary components.
The level of significance for all analysis was set at P<0.05.
Results
Gut microbiota
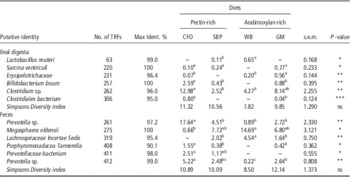
T-RFLP analysis was performed to identify microbial community shifts related to diets. A total of 57 TRFs from digesta samples (Supplementary Table S5) and 61 TRFs from fecal samples (Supplementary Table S6) constituted 0.5% or more of the microbial community, and were statistically evaluated. In general, a high individual variation between pigs was observed and cluster analysis did not show any clear differences in pattern related to diet or segment (data not shown), and there were no differences (P>0.05) in Simpson’s diversity index. The accumulative relative abundance of TRFs identified as lactic acid bacteria (TRF63, TRF244 and TRF331), butyrate-producing bacteria (TRF223, TRF258, TRF271, TRF274, TRF317 and TRF318) and Prevotella spp. (TRF160, TRF161, TRF163, TRF264, TRF411 and TRF412) did not differ between diets. However, there was a tendency for a higher relative abundance of lactic acid bacteria in digesta (P=0.066) and a lower relative abundance of Prevotella spp. in feces (P=0.095) of pigs fed the WB diet. The analysis of individual TRFs showed several diet-related effects (Table 5). TRF261, identified as a species related to Prevotellacea, and TRF275, identified as Megasphaera elsdenii, where the TRFs with highest relative abundance in feces and they showed different response to diets. TRF261 had higher relative abundance (P<0.05) in pigs fed diet CFO (17.6%) than in pigs fed the other diets (0.89% to 4.51%), whereas TRF275 had higher relative abundance (P<0.05) in pigs fed diet WB than in pigs fed the CFO diet (14.69% and 0.66%, respectively). TRF411 and 412 were both identified as species related to Prevotellaceae, and had highest relative abundance in feces of pigs fed the CFO diet (2.51% and 5.22%, respectively). Together, the three TRFs related to Prevotellaceae consisted of more than 25% of the total fecal microbiota in pigs fed the CFO diet, which is about 3 to 22 times higher than in pigs fed the other diets.
Effect of diets on the relative abundance (%) of identified TRF and Simpson’s diversity index in ileal digesta and feces

TRF=terminal restriction fragment; CFO=chicory forage diet; SBP=sugar beet pulp diet; WB=wheat bran diet; GM=grass meal diet.
Least square means±pooled s.e.m.
–Below detection limit.
abcValues within a row with different superscripts differ significantly at P<0.05.
*P⩽0.05; **P⩽0.01; ***P⩽0.001.
TRF262, identified as species related to Clostridium, was the TRF with highest relative abundance in ileal digesta and was higher (P<0.05) in pigs fed diet CFO (12.98%) than in pigs fed diets SBP and WB (2.52% and 4.27%). TRF63, identified as L. reuteri, had higher (P<0.05) relative abundance in ileal digesta of pigs fed diet WB than in pigs fed diet SBP (0.65% and 0.11%, respectively), and was not detected in pigs fed diets CFO and GM. TRF257, identified as Bifidobacterium boum, had higher (P<0.05) relative abundance in ileal digesta of pigs fed diet CFO (2.59%) than in pigs fed the other diets (0.43% to 0.88%).
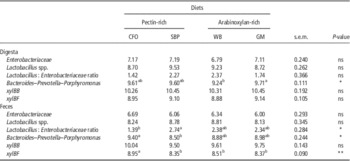
Enterobacteriaceae, Lactobacillus spp., Bacteroides–Prevotella–Porphyromonas as well as the β-xylosidase genes from Firmicutes (xylBF) and Bacteroidetes (xylBB) were quantified by qPCR (Table 6). In fecal samples, pigs fed diet CFO had higher (P<0.05) abundance of Bacteroides–Prevotella–Porphyromonas than in pigs fed diet SBP (9.40 and 8.50 log10copies/g DM, respectively). There were no differences between diets for either abundance of Lactobacillus spp. or abundance of Enterobacteriaceae in fecal samples. However, the Lactobacillus : Enterobacteriaceae ratio in fecal samples was almost two times higher in pigs fed diet SBP (2.74) than pigs fed diet CFO (1.39). Pigs fed diet CFO had higher abundance of xylBF (8.95 log10copies/g DM) in fecal samples and tended to have higher abundance of xylBB (10.04 log10copies/g DM) in fecal samples than pigs fed the other diets (xylBF, 8.35 to 8.51; XynBB, 9.50 to 9.75 log10copies/g DM). In ileal digesta samples, pigs fed diet GM had higher (P<0.05) abundance of Bacteroides–Prevotella–Porphyromonas than pigs fed the WB diet. The abundance of Lactobacillus spp. in ileal digesta tended to differ between diets with the highest numbers for pigs fed diet SBP.
Effect of diet on fecal and ileal digesta microbial counts (log10copies/g DM) and abundance of the β-xyloxidase genes from Bacteroidetes (xylBB) and Firmicutes (xylBF)

DM=dry matter; CFO=chicory forage diet; SBP=sugar beet pulp diet; WB=wheat bran diet; GM=grass meal diet.
Least square means±pooled s.e.m.
abValues within a row with different superscripts differ significantly at P<0.05.
*P⩽0.05; **P⩽0.01; ***P⩽0.001.
Pearson correlations (r) showed that in ileal digesta the intake (g/day) of dietary fiber (r=0.39; P=0.039), NSP (r=0.42; P=0.024) and cellulose (r=0.42; P=0.025) were positively correlated to the abundance of Butyrate-producing bacteria. For the amount (g/day) of digested dietary components, NSP (r=0.57; P=0.002), xylose (r=0.53; P=0.004) and dietary fiber (r=0.60; P=0.001) were positively correlated to the abundance of Bacteroides–Prevotella–Porphyromonas. In feces, there was a positive correlation between the abundance of Prevotella spp. (r=0.40; P=0.037) and the intake (g/day) of uronic acid. Moreover, there were negative correlations between the intake of dietary fiber (r=−0.52; P=0.008), NSP (r=−0.55; P=0.004), cellulose (r=−0.53; P=0.024) and the abundance of Lactobacillus spp. However, no correlations (P>0.05) were observed between the abundance of any of the tested bacterial groups and amount (g/day) of digested dietary components in the total tract or between the abundance of any of the tested bacterial groups and the mol wt distribution.
Organic acids
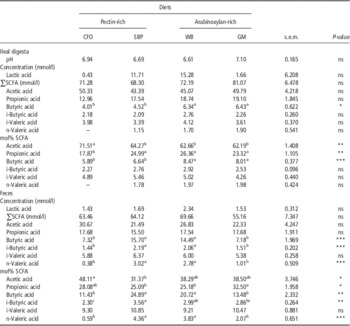
The SCFA and lactic acid analysis in ileal digesta showed that pigs fed arabinoxylan-rich diets had a higher concentration and a higher proportion of butyric acid in ileal digesta than pigs fed pectin-rich diets, whereas pigs fed diet CFO had a higher proportion of acetic acid and a lower proportion of propionic acid than pigs fed the other diets (Table 7). The abundance of Lactobacillus spp. (r=0.52; P=0.008) as well as the accumulative relative abundance of lactic acid bacteria (r=0.45; P=0.053) were positively correlated to the concentration of lactic acid. The accumulative relative abundance of Prevotella spp. was positively correlated (r=0.42; P=0.039) with the concentration of butyric acid, whereas the accumulative relative abundance of butyrate-producing bacteria was negatively correlated (r=−0.53; P=0.007) with the concentration of propionic acid. There were negative correlations between the intake (g/day) of dietary fiber (r=−0.51; P=0.006), NSP (r=−0.57; P=0.002) and cellulose (r=−0.50; P=0.010) and the concentrations (mmol/l) of SCFA. The patterns were the same for the concentration of acetic acid, with negative correlations to the intake (g/day) of dietary fiber (r=−0.48; P=0.010), NSP (r=−0.51; P=0.005) and cellulose (r=−0.45; P=0.017). There were also negative correlations between the concentration of propionic acid and the intake (g/day) of dietary fiber (r=−0.48; P=0.010), NSP (r=−0.55; P=0.003) and cellulose (r=−0.54; P=0.003). The intake (g/day) of uronic acid was negatively correlated to the concentration and mol% of propionic acid (r=−0.46; P=0.013 and r=−0.56; P=0.009, respectively) and the concentration and mol% of butyric acid (r=−0.57; P=0.002 and r=−0.68; P=0.0001, respectively), but was positively correlated to the mol% of acetic acid (r=0.56; P=0.002). Positive correlations were also observed between the intake (g/day) of cellulose (r=0.38; P=0.044) and NSP (r=0.38; P=0.046) and the mol% of acetic acid, between the intake (g/day) of arabinose (r=−0.49; P=0.009) and the mol% of propionic acid and between the intake of xylose (r=0.64; P=0.0002) and mol% of butyric acid. Moreover, in ileal digesta there was a negative correlation between the amount of digested uronic acid and the mol% of butyric acid (r=−0.48; P=0.010). A positive correlation was observed between amount of digested uronic acid in ileal digesta and the mol% of acetic acid (r=0.48; P=0.010). In the total tract, both the concentration and mol% of butyric acid and n-valeric acid was higher (P=0.001) in pigs fed diets SBP and WB than pigs fed diets CFO and GM. The mol% of acetic acid was higher (P=0.041) in pigs fed CFO than in pigs fed diet SBP (Table 7). There were positive correlations between the intake (g/day) of arabinose and the mol% of butyric acid (r=0.69; P=0.001). On the other hand, there were negative correlations between the intake (g/day) of arabinose and the mol% of acetic acid (r=−0.44; P=0.018) and propionic acid (r=−0.41; P=0.031).
Effect of diet on ileal digesta and fecal organic acids and ileal digesta pH

CFO=chicory forage diet; SBP=sugar beet pulp diet; WB=wheat bran diet; GM=grass meal diet; SCFA=short-chain fatty acids.
Least square means±pooled s.e.m.
abcValues within a row with different superscripts differ significantly at P<0.05.
*P⩽0.05; **P⩽0.01; ***P⩽0.001.
Furthermore, there was a negative correlation between the amount of digested NSP in the total tract and the concentration and mol% of propionic acid in feces (r=−0.42; P=0.026 and r=−0.39; P=0.040, respectively), as well as a positive correlation between the amount digested arabinose in the total tract and the concentration and mol% of butyric acid (r=−0.42; P=0.026 and r=0.53; P=0.004, respectively).
Discussion
The present study compared effects of feeding similar amounts of NSP originating from either pectin-rich or arabinoxylan-rich fiber sources on the ileal digesta and fecal microbial composition and its fermentation products. The results showed that the amount of digested NSP, xylose and dietary fiber in ileal digesta was positively correlated with the abundance of Bacteroides–Prevotella–Porphyromonas. The correlations in the present study did not take into account the origin of NSP. However, it should be noted that the ileal digestibility in general is higher for pectins than for arabinoxylans (Noblet and Le Goff, Reference Noblet and Le Goff2001). However, Ivarsson et al. (Reference Ivarsson, Andersson and Lindberg2012b), reported a similar ileal digestibility of dietary fiber, NSP and xylose in the GM diet as the SBP and CFO diet. Consequently, a high amount of microbial digested NSP in the present study can be linked to diets GM, SBP and CFO. Metzler et al. (Reference Metzler, Vahjen, Baumgartel, Rodehutscord and Mosenthin2009) reported that dietary pectin tended to stimulate Bacteroides–Prevotella–Porphyromonas in ileal digesta of growing pigs. Moreover, De Filippo et al. (Reference De Filippo, Cavalieri, Di Paola, Ramazzotti, Poullett, Massart, Collini, Pieraccini and Lionetti2010) showed that African children, who got a high fiber diet, in comparison with European children who got modern western diets, had a significant enrichment of Bacteroidetes in fecal samples, and especially bacteria from the Prevotella and Xylanibacter genus known to carry genes for cellulose and xylan hydrolysis. A positive correlation between abundance of Prevotella spp. in fecal samples and uronic acid intake was also observed in the present study. This indicates that bacteria belonging to Bacteroides–Prevotella–Porphyromonas are of major importance for fiber degradation.
We hypothesized that addition of NSP rich in pectin would stimulate bacteria with pectinolytic activities, whereas NSP rich in arabinoxylans would stimulate bacteria with xylanolytic activities. Designing primers targeting β-xylosidase genes was an attempt to confirm the hypothesis. Thus, quantification of β-xylosidase genes was performed and higher numbers were expected from pigs fed diets GM and WB (arabinoxylan-rich diets). However, the results from the analysis did not support our hypothesis. Instead, pigs fed diet CFO had higher numbers of β-xylosidase genes in feces, whereas no diet-related differences were observed in ileal digesta. Overall, the abundance of β-xylosidase genes was high in both ileal digesta and feces. This may indicate that many bacteria harbor the gene and have the ability to degrade xylans, but the gene may not always be expressed.
The concentrations of individual SCFA in ileal digesta were largely influenced by NSP structure in the diet. Thus, feeding pigs diets with a high content of arabinoxylans both resulted in the highest concentration and proportion of butyric acid in ileal digesta. A strong positive correlation was also observed between the intake of xylose and the proportion butyric acid, but no correlations were observed between intake of arabinose and butyric acid, indicating it mainly is xylose that acts as substrate for butyric acid production in the small intestine. Feeding pigs with diet CFO, a diet with high content of pectins, increased the proportion of acetic acid in ileal digesta, this is in agreement with Cummings and Englyst (Reference Cummings and Englyst1987), who reported that acetate is the major end-product of pectin degradation. However, feeding pigs diet SBP, which also had high content of pectins, did not result in the same fermentation pattern as feeding pigs with diet CFO. Diet CFO stimulated to a higher proportion of acetic acid, whereas diet SBP stimulated to a higher proportion of propionic acid. Lower proportion of acetic acid and higher propionic acid in pigs fed a diet with SBP was also found by Wang et al. (Reference Wang, Zhu, Li, Wang and Jensen2004). Pectins are complex polymers, with differences in composition and structure both between and within different plants (Voragen et al., Reference Voragen, Beldman and Schols2001). Van Laere et al. (Reference Van Laere, Hartemink, Bosveld, Schols and Voragen2000) showed that several bacterial species belonging to Bifidobacterium, Lactobacillus and Bacteroides responded differently to pectins with different structure and composition. SBP had a much higher content of soluble arabinose than both CFO and the other fiber sources used in the present study. This suggests that the positive correlation observed between the proportion of propionic acid in ileal digesta and the intake of arabinose mainly can be explained by fermentation of arabinose originating from SBP. Ivarsson et al. (Reference Ivarsson, Andersson and Lindberg2012b) observed differences in molecular weight distribution between pectins in diets CFO and SBP, and Ivarsson et al. (Reference Ivarsson, Andersson and Lindberg2012c) showed that there are strong correlations between molecular weight distribution and the proportion propionic and acetic acid, which suggests that both the building blocks and the molecular weight distribution of pectin can explain the differences in SCFAs between the CFO and SBP. This indicates that the bacterial degradation of pectin is selective and dependent on the molecular weight. However, none of the studied bacterial groups correlated with the molecular weight distribution, nor could they be linked to the specific pectin degradation. Neither did the correlations between selected bacterial groups and individual SCFA result in a direct relationship. Instead, in ileal digesta, a positive correlation between Prevotella spp. and butyric acid and a negative correlation between butyrate-producing bacteria and propionic acid was found. Moreover, positive correlations were observed between the intake of dietary fiber, NSP, and cellulose and the abundance of butyrate-producing bacteria, whereas the same fiber fractions decreased the concentration of acetic and propionic acid. Liu et al. (Reference Liu, Ivarsson, Dicksved, Lundh and Lindberg2012) found a positive correlation between butyrate-producing bacteria and acetic acid in colon. It is well known that metabolic cross-feeding commonly occurs within the gut, and that butyrate-producing bacteria are able to utilize acetate (Barcenilla et al., Reference Barcenilla, Pryde, Martin, Duncan, Stewart, Henderson and Flit2000). Thus, it can be hypothesized that addition of CFO results in increased amounts of chicory pectin that is utilized by acetate-producing Prevotella spp., which stimulates butyrate-producing bacteria. However, it is also clear that the gut ecosystem is very complex and that more studies about the link between the molecular weight distribution of different dietary fibers, the gut microbiota and the resulting SCFA are needed.
In contrast to the SCFA profile in ileum, the SCFA profile in feces was not directly linked to NSP structure. Instead, there were correlations between individual neutral sugars and the SCFA profile. Both the arabinose intake and digested amount were positively correlated to the concentration and proportion of butyric acid. WB and SBP were the diets contributing to the highest intake arabinose, and which also showed significantly higher concentrations and proportions of butyric acid than pigs fed diets CFO and GM. Högberg and Lindberg (Reference Högberg and Lindberg2006) also reported a higher proportion of butyric acid in the hindgut in pigs fed a diet with high content of arabinoxylans mainly originating from WB. Interestingly, these data indicate that there is a shift in substrate for the butyric acid production in the small intestine v. the hindgut, that is, from xylose in ileum to arabinose in the hindgut. In accordance with the data on ileal digesta, the proportion of acetic acid was higher in pigs fed diet CFO than in pigs fed diet SBP, whereas no differences among the two diets could be observed for propionic acid. This indicates that the soluble arabinose in SBP is mainly substrate for propionate production in the small intestine, whereas the insoluble arabinose is an important substrate for butyrate production in the hindgut.
We hypothesized that the microbial composition would cluster in accordance with NSP structure. However, no clear cluster pattern related to NSP structure could be identified and the global microbial composition was characterized by a high individual variation. It should be remembered that in the present study we worked with native fiber sources and neither the NSP structures in CFO and SBP (both pectin-rich) nor in WB and GM (both arabinoxylan-rich) are identical. This may explain why the dietary effects shown, to a high degree were ingredient specific rather than NSP structure specific. The T-RFLP analysis showed that CFO increased species related to Prevotellacea in feces, and the results were confirmed with the qPCR analysis. The results are in contrast with previous studies where CFO was included in diets to growing pigs (Ivarsson et al., Reference Ivarsson, Liu, Dicksved, Roos and Lindberg2012a; Liu et al., Reference Liu, Ivarsson, Dicksved, Lundh and Lindberg2012). In those studies, species related to Prevotella decreased in abundance with inclusion of CFO. Differences in diet composition might have affected the results. In the referred studies, cereal-based diets were used, whereas in the current study semi-purified diets were used. Moreover, Tajima et al. (Reference Tajima, Aminov, Nagamine, Matsui, Nakamura and Benno2001) showed that Prevotella ruminicola and Prevotella bryantii in rumen respond oppositely to hay and grain diets, showing a high variation within the genus. The pigs fed diet WB showed higher relative abundance of M. elsdensii in feces and L. reuteri in ileal digesta. L. reuteri is able to produce antimicrobial compounds that have the potential to suppress other bacteria (Cleusix et al., Reference Cleusix, Lacroix, Vollenweider and Le Blay2008) and Mølbak et al. (Reference Mølbak, Thomsen, Jensen, Bach Knudsen and Boye2007) suggested a role for M. elsdenii in inhibition of the pathogenic bacteria Brachyspira hyodysenteriae. This together with stimulation of butyric acid suggests that WB may be beneficial for gut health.
The major difference between the bacterial community in ileal digesta and feces was observed on the T-RFLP data. In ileal digesta the most abundant group, TRF262, belongs to the family Clostridaceae, whereas the most abundant group in feces, TRF261, belongs to the family Prevotellaceae. The results are in agreement with the literature (Jensen, Reference Jensen2001). Liu et al. (Reference Liu, Ivarsson, Dicksved, Lundh and Lindberg2012) compared the microbial community in ileum and colon of pigs and reported a perfect clustering according to gut segment, which was not observed in the current study. This may be explained by differences between the studies, such as age of the pigs, the use of intact pigs v. cannulated pigs, different sampling sites and use of colon v. fecal samples. Although there are significant differences in gut microbial composition along different sites of the GIT, the large intestine has a rather uniform composition of luminal microbiota and feces is widely used to represent the colonic microbiota (Gerritsen et al., Reference Gerritsen, Smidt, Rijkers and de Vos2011; Walker et al., Reference Walker, Ince, Duncan, Webster, Holtrop, Ze, Brown, Stares, Scott, Bergerat, Louis, McIntosh, Johnstone, Lobley, Parkhill and Flint2011). However, significant differences between the mucosa-associated colonic and fecal microbial composition has been shown (Eckburg et al., Reference Eckburg, Bik, Bernstein, Purdom, Dethlefsen, Sargent, Gill, Nelson and Relman2005). This needs to be considered when fecal microbial data is interpreted. In the current study, the relative abundance of Enterobacteriaceae, Lactobacillus and Bacteroides–Prevotella–Porphyromonas in ileal digesta and feces were in the same range. This is in general agreement with another study using cannulated pigs (Metzler-Zebeli et al., Reference Metzler-Zebeli, Hooda, Pieper, Zijlstra, Van Kessel, Mosenthin and Ganzle2010). However, Metzler-Zebeli et al. (Reference Metzler-Zebeli, Hooda, Pieper, Zijlstra, Van Kessel, Mosenthin and Ganzle2010) reported lower relative abundance of Bacteroides–Prevotella–Porphyromonas in ileal digesta than feces. It is possible that differences in cannulation technique between the studies may have affected the results. The pigs in the present study were fitted with a PVTC cannula using a surgical technique where the apex of the cecum is removed to fit the base of the cannula over the ileo-cecal sphincter (Van Leeuwen et al., Reference Van Leeuwen, Van Kleef, van Kempen, Huisman and Verstegen1991). This should allow an uninterrupted flow of ileal digesta when the cannula is opened for sample collection. In the study by Metzler-Zebeli et al. (Reference Metzler-Zebeli, Hooda, Pieper, Zijlstra, Van Kessel, Mosenthin and Ganzle2010), the pigs were fitted with a simple T-cannula directly positioned in the distal ileum, that might give a greater distinction between the small intestine and feces.
In conclusion, this study shows that increasing the total amount of fermentable NSP in a diet increased the abundance of Bacteroides–Prevotella–Porphyromonas in ileal digesta, and that increasing intake of uronic acid increase the abundance of Prevotella spp. in feces. The effects of native fiber sources on the microbial composition were to a high degree ingredient specific rather than NSP structure specific. The effect on SCFA was linked to specific neutral sugars, in ileum xylose increased the butyric acid proportion, whereas arabinose increased the butyric acid proportion in feces. Chicory pectin increased the acetic acid proportion in both ileum and feces.
Acknowledgment
This project was supported by Formas (Swedish Research Council for Environment, Agricultural Sciences and Spatial Planning).