1 Introduction
A large number of studies, starting with Pierre Delattre and Donald C. Freeman's seminal paper (Delattre & Freeman Reference Delattre and Freeman1968) using X-ray imaging, have investigated the articulation of approximant /ɹ/ in American English (AE). Delattre & Freeman's research found that the main acoustic cue signaling rhoticity, the lowering of F3, could be achieved by employing a number of different tongue configurations. The two main variant categories have been termed ‘tip-down’ (‘bunched’) and ‘tip-up’ (‘retroflex’) /ɹ/ (Hagiwara Reference Hagiwara1994), and different speakers may use one of the variants exclusively or have preferences for using one of the variants in certain phonetic contexts.
Guenther et al. (Reference Guenther, Espy-Wilson, Boyce, Matthies, Zandipour and Perkell1999) have proposed that these variants exhibit articulatory ‘trading relationships’ used to maintain a constantly low F3 across various production strategies (see Nieto-Castañón et al. Reference Nieto-Castañón, Guenther, Perkell and Curtin2005 for a follow-up study that confirmed these observations using a computational model utilizing articulatory data). More recently, Mielke, Baker & Archangeli (Reference Mielke, Baker, Archangeli, Fougeron, Kuehnert and Vallée2010, Reference Mielke, Baker and Archangeli2016) have shown that in addition to articulatory constraints favoring the use of a specific tongue gesture in a certain environment, individual speakers may display complex patterns of allophony. These patterns may arise during speech acquisition (Magloughlin Reference Magloughlin2016) as a child's dominant rhotic production strategy may not work in all contexts. Mielke et al. (Reference Mielke, Baker, Archangeli, Fougeron, Kuehnert and Vallée2010) found an overall bunched ‘r’ preference in AE, but for speakers who show variation, a preference for bunched ‘r’ adjacent to /i/, and tip-up ‘r’ adjacent to /a/ and /o/. Stavness et al. (Reference Stavness, Gick, Derrick and Fels2012) provide a potential motive for the development of some of these strategies; they used biomechanical modeling to show that transitioning between /a/ and tip-up /ɹ/, and between /i/ and tip-down /ɹ/, produces less tongue displacement, relative strain, and relative muscle stress than the alternatives.
Here we present a large-scale articulatory study of /ɹ/ in New Zealand English (NZE) to test whether a largely non-rhotic variety of English displays similar patterns of ‘r’ allophony as previously documented for rhotic dialects of English. If such patterns were to be identified, this would provide additional support for Stavness et al.’s (Reference Stavness, Gick, Derrick and Fels2012) mechanical articulatory arguments for English ‘r’ allophony. Alternatively, it might be possible to identify other considerations accounting for diverging patterns of consonantal /ɹ/ allophony in non-rhotic varieties of English.
2 Background
2.1 Rhotics in New Zealand English
New Zealand is a highly monolingual country; 72.8% of the people are monolingual English speakers (Statistics New Zealand 2013). Most native English speakers speak NZE (Hay, Maclagan & Gordon Reference Hay, Maclagan and Gordon2008), a variety that has provided a rich and abundant resource for linguistic studies. Many of NZE's phonological characteristics are well-documented (e.g. Gordon et al. Reference Gordon, Campbell, Hay, Maclagan, Sudbury and Trudgill2004). Among these, the realization of /ɹ/ is one that has received considerably little attention, possibly due to NZE's status as a largely non-rhotic variety of English (Bauer & Warren Reference Bauer, Warren, Burridge and Kortmann2008); note that ‘non-rhoticity’ does not indicate a complete absence of rhotics in a certain dialect but rather a lack of realization in post-vocalic (= non–pre-vocalic) and syllabic contexts. To date, the main focus of work on /ɹ/ in NZE has been on the few geographical regions that are known for their maintenance of non–pre-vocalic /ɹ/, such as Southland and parts of Otago (e.g. Bartlett Reference Bartlett2002; see also Marsden Reference Marsden2013 for work on New Zealand's North Island), or other kinds of socially conditioned variation (e.g. Gibson Reference Gibson2005 examines the use of non–pre-vocalic /r/ in singing by artists of Māori or Pasifika descent). /ɹ/ sandhi has also received some attention in the literature (e.g. Hay & Maclagan Reference Hay, Maclagan, Preston and Niedzielski2010, Reference Hay and Maclagan2012). The focus in this work is again on the linguistic and sociolinguistic constraints on the use of /ɹ/ sandhi, but Hay & Maclagan (Reference Hay and Maclagan2012) also examine the quality of the /ɹ/ in certain contexts, showing that the frequency with which a given individual uses ‘r’ in a particular context predicts the amount of F3 lowering they produce in that context. Aside from this study, the phonetic quality of /ɹ/ in NZE has been rarely investigated. For postvocalic ‘r’, Christopher M. Bartlett has observed the lack of certainty in determining the degree of retroflexion in previous work on Southland English. He claimed, on the basis of tape-recorded interviews, that the realization was usually ‘approximal rather than rolled or flapped’ (Bartlett Reference Bartlett1992: 7), and the degree of ‘retroflexion’ varied along a continuum (Bartlett Reference Bartlett1992, Reference Bartlett2002); note the use of ‘retroflexion’ in an acoustically-descriptive rather than articulatory fashion. In word-initial position, Hay et al. (Reference Hay, Maclagan and Gordon2008: 18) write that NZE ‘r’ is ‘slightly retroflexed with the tongue tip raised just behind the alveolar ridge or bunched at the back of the mouth’, and is usually transcribed as [ɹ]. These observations were based on self-referential intuition from trained phoneticians, and the details of the articulation of /ɹ/ in NZE, including whether it varies across different social and linguistic environments, have not yet been subject to systematic investigation.
More is known about the articulation of /ɹ/ in other varieties of English. Mielke et al. (Reference Mielke, Baker and Archangeli2016) systematically examined consonantal /ɹ/ in various contexts from 27 speakers of AE. They found that two participants produced only retroflex (tip-up) /ɹ/, 16 produced only bunched (tip-down) /ɹ/, and nine produced both, depending on context. They summarized the results of those with categorical variability as follows:
Summary of asymmetries in preference for retroflexion (tip-up /ɹ/)
a. Prevocalic syllable-initial > prevocalic in onset cluster > postvocalic
b. Labial cluster > coronal cluster > dorsal cluster
c. Next to back and/or low vowels > next to front vowels
(Mielke et al. Reference Mielke, Baker and Archangeli2016: 115)
By recording NZE participants’ /ɹ/ production in similar contexts, we not only compare rhotic variability in NZE to that in AE, but also provide a cross-dialectical distributional test of the mechanical articulatory models in Stavness et al. (Reference Stavness, Gick, Derrick and Fels2012). For high front vowels, it appears that it would be more difficult to produce tip-up gestures as the tongue is already in a relatively forward and high position, while for back vowel environments, the tongue would have more space to move to the tip-up shapes. Note, however, that the impact of such considerations is subject to differences in individual vocal tract morphology, given that tongue position during vowel production is influenced by, for example, palate shape (see Brunner, Fuchs & Perrier Reference Brunner, Fuchs and Perrier2009, Lammert, Proctor & Narayanan Reference Lammert, Proctor and Narayanan2013). Stavness et al. (Reference Stavness, Gick, Derrick and Fels2012) showed that constraints such as these affect tongue displacement, relative strain, and relative muscle stress; at least for the vocal tract morphology of the single speaker represented by their model, it was easier to move from a tip-down rhotic to a high front vowel, and from a tip-up rhotic to a low-back vowel.
In the dataset investigated in this paper (discussed below) we had a limited number of possible environments for /ɹ/ but do compare the articulation of /ɹ/ preceding high front, central, and back vowels, as well as occurring word-initially, following coronal and velar consonants, and intervocalically; the last environment has received limited attention in previous research.
2.2 Tongue shape categorization and curvature
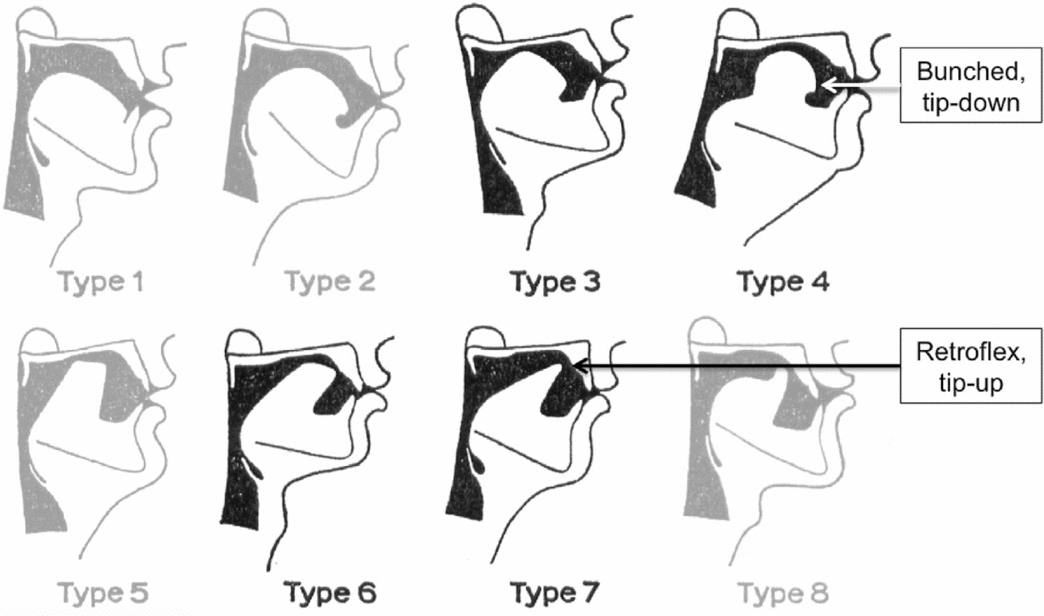
Mielke et al. (Reference Mielke, Baker and Archangeli2016) categorized their data as bunched and retroflex /ɹ/, but Delattre & Freeman's (Reference Delattre and Freeman1968) seminal paper provides eight possible tongue shape categorizations, as shown in Figure 1 (from Magloughlin Reference Magloughlin2016: 52). We categorized the tongue shapes observed during the articulation of /ɹ/ according to their types applying to pre-vocalic /ɹ/. Categories 1 and 2 were identified as ‘r’-less in Delattre & Freeman's paper and were hence excluded. Type 8 was referred to as ‘strong British /r/’ by Delattre & Freeman (Reference Delattre and Freeman1968: 45). Type 7 has a greater pharyngeal constriction than type 8, but pharyngeal constriction is impossible to distinguish using only ultrasound images of the tongue; therefore, we collapsed the identification of types 7 and 8. None of the independent raters we asked to classify the tongue shapes observed in our study assigned any shapes to the somewhat elusive type 5 (Mielke et al. (Reference Mielke, Baker and Archangeli2016) describe types 5 and 6 as more difficult to classify, judging types 1–4 and 7–8 to be clearly bunched or retroflexed, respectively; see discussion in Boyce et al. Reference Boyce, Tiede, Espy-Wilson and Groves-Wright2015). Therefore, our shape classifications correspond with our tip-up versus tip-down ratings (Mielke et al.’s ‘retroflexion rate’) allowing us to treat types 3 and 4 as tip-down and types 6 and 7 as tip-up.
/ɹ/ shape classification according to Delattre and Freeman (Reference Delattre and Freeman1968). Types 4 and 7 illustrate the classic bunched/retroflex or tip-down/tip-up distinction, while types 1 and 2 (greyed out) represent shapes observed in non-prevocalic environments or judged not to occur in Western varieties of English; type 5 is greyed out since it has seldom been used in the studies following Delattre & Freeman (Reference Delattre and Freeman1968) and was judged to not have occurred by the independent raters employed for our study (see Boyce et al. Reference Boyce, Tiede, Espy-Wilson and Groves-Wright2015 for a discussion why it can be hard to distinguish types 4 and 5 when using visualization methods other than X-ray imaging, and even with X-ray it can be difficult unless a contrast medium is applied). In analogy to Mielke, Baker & Archangeli's ‘retroflexion rate’ (Reference Mielke, Baker and Archangeli2016) we treated types 3 and 4 as tip-down and types 6 and 7 as tip-up. Type 8 is greyed out because, lacking a view of the pharyngeal wall, it is indistinguishable from type 7 in ultrasound images. As a result, we group the tongue shape types of 7 and 8 together. Reproduced with permission from MagLoughlin (Reference Magloughlin2016: 52) who adapted Delattre & Freeman's (Reference Delattre and Freeman1968: 41) original taxonomy by flipping the images to be rightward facing.

Apart from coding according to tongue shape, we also attempted to quantify the tongue shape of traces using the x–y coordinates extracted for each /ɹ/ gesture using the Articulate Assistant Advanced (AAA) software (Articulate Instruments Ltd. 2012). This step was undertaken not only to verify our manual coding but also to determine whether existing methods for quantifying midsagittal tongue shapes can be used to distinguish various approximant /ɹ/ gestures. Previous studies using ultrasound data have proposed a number of methods to do so: Ménard et al. (Reference Ménard, Aubin, Thibeault and Richard2011), for example, fitted a triangle to the tongue contour to extract important parameters to describe tongue characteristics such as tongue position and tongue curvature degree. A somewhat similar measurement was proposed by Zharkova (Reference Zharkova2013), termed ‘dorsum excursion index’; this involved drawing a straight line between the ends of each tongue trace and measuring the distance of this line to the highest relative point of the tongue contour, thus representing the extent of the dorsum excursion in relation to the front and back of the tongue. These measures have been reported to be useful for distinguishing simple shapes like vowels; however, approximant /ɹ/ was classified by Dawson, Tiede & Whalen (Reference Dawson, Tiede and Whalen2016) as belonging to a group of ‘high complexity’ tongue shapes due to its multiple points of vocal tract constriction (see Gick et al. Reference Gick, Bacsfalvi, Bernhardt, Oh, Stolar and Wilson2008), including one at the lips, and two at the tongue (Guenther et al. Reference Guenther, Espy-Wilson, Boyce, Matthies, Zandipour and Perkell1999), one at the front (tongue blade and/or tip), and the other a tongue root bulging at the pharynx (Boyce, Hamilton & Rivera-Campos Reference Boyce, Hamilton and Rivera-Campos2016). Therefore, we expected that the simpler quantification methods developed by Ménard et al. (Reference Ménard, Aubin, Thibeault and Richard2011) and Zharkova (Reference Zharkova2013) would have too many problems in classifying the complex tongue shapes observed for approximant /ɹ/.
For high complexity tongue shapes, another type of quantification method based on polynomial fitting (see e.g. Morrish et al. Reference Morrish, Stone, Shawker and Sonies1985) could be more effective, because such an approach can be used to measure tongue shape complexity. Stolar & Gick (Reference Stolar and Gick2013) developed a Curvature Index (CI) measurement, in which a 7th-order polynomial curve was fit to the tongue's surface, and the reciprocal of the radius of curvature was extracted; the CI was found to accurately distinguish the complex tongues shapes for /ɹ/ and /l/ from other English sounds. Importantly, Stolar & Gick (Reference Stolar and Gick2013) also mentioned potential differences between retroflex and bunched /ɹ/ in their data, indicating that although the two types of /ɹ/ are approximately equally curvy, distinctions might be found if the tongue tip and tongue body were to be examined separately; they did not, however, further investigate the CI for different /ɹ/ variants found in their data. Drawing on this work, Dawson et al. (Reference Dawson, Tiede and Whalen2016) recently published an extension of the CI, which they call Modified Curvature Index (MCI). Compared to the original CI method, MCI offers the following improvements: (i) it integrates curvature values with the arc length of the tongue instead of the x-axis, which eliminates discrepancies arising from the rotation of the ultrasound probe; and (ii) polynomial fitting was replaced by central differencing of the shape coordinate points, which avoids the unwanted effects at the boundaries of the shape caused by higher order polynomials (see Stolar & Gick Reference Stolar and Gick2013: 7 for details). The updated version of the CI thus measures curvature complexity in a more explicit and controllable way, and we decided to use the MCI to quantify the different tongue gestures for /ɹ/ in the present study. A script by Katherine Dawson is available from Github (Dawson Reference Dawson2017 – an earlier version was uploaded in 2015) which implements the algorithm described in the paper in Python (Python Software Foundation 2013).
Stolar & Gick (Reference Stolar and Gick2013) suggested that measuring the curvature of the tongue tip and body separately could potentially be used to distinguish tip-up from tip-down /ɹ/ shapes. They found that retroflex and bunched tongue shapes in their dataset ‘were approximately equally curvy overall’ but pointed out that the retroflexed posture exhibited a ‘locally-high curvature at the tip and a relatively flat shape over the body of the tongue’ while ‘bunched /r/ was more curved over its entire length’ (Stolar & Gick Reference Stolar and Gick2013: 14). A similar observation is stated more indirectly by Alwan, Narayanan & Haker (Reference Alwan, Narayanan and Haker1997: 1085) who report that ‘the pharyngeal constriction is likely to be more superior in cases where the oral constriction is formed by raising the anterior tongue body’ (tip-up /ɹ/) and that ‘the degree of concavity of the tongue shapes posterior to the oral constriction is smaller for the more anterior oral constrictions’. Similarly, the fact that approximant /ɹ/ requires three significant constrictions along the vocal tract (pharyngeal, coronal, and labial; see Gick et al. Reference Gick, Iskarous, Whalen and Goldstein2003, Campbell et al. Reference Campbell, Gick, Wilson and Vatikiotis-Bateson2010, Boyce et al. Reference Boyce, Hamilton and Rivera-Campos2016), two of which can be assessed using ultrasound imaging of the tongue, suggests that there might also be some meaningful variation in terms of the constriction formed by the tongue root as compared to the tongue front (e.g. Guenther et al. Reference Guenther, Espy-Wilson, Boyce, Matthies, Zandipour and Perkell1999). Therefore, we calculate MCI values for the front and back of the tongue separately, in addition to calculations based on the full imaged tongue contours.
3 Hypotheses
Drawing on Mielke et al.’s (Reference Mielke, Baker and Archangeli2016) results for AE, and our understanding of Stavness et al.’s (Reference Stavness, Gick, Derrick and Fels2012) results, we formulate the following five hypotheses about NZE production:
1. Some NZE speakers will produce only one variant of /ɹ/, and most of those will be tip-down /ɹ/.
2. Some, possibly up to half of NZE speakers (see results in Mielke et al. Reference Mielke, Baker, Archangeli, Fougeron, Kuehnert and Vallée2010, Reference Mielke, Baker and Archangeli2016 for AE speakers), will present categorical variability in /ɹ/ production.
3. NZE speakers will produce tip-up /ɹ/ more often when it precedes a back vowel than when it precedes a high front vowel, as in American English.
4. NZE speakers will produce tip-up /ɹ/ most often in word initial, then coronal, and least often in velar contexts.
5. As bunched and retroflex /ɹ/ produce different forms of constrictions at the front of tongue that involve different muscle body positioning, we expect them to also be distinguished by the nature of their pharyngeal constriction, in accordance with the trading relationships proposed by Guenther et al. (Reference Guenther, Espy-Wilson, Boyce, Matthies, Zandipour and Perkell1999) and differences in the muscle activations underlying various /ɹ/ gestures (Stavness et al. Reference Stavness, Gick, Derrick and Fels2012).
4 Method
This investigation presents the analysis of articulatory data for 62 native speakers of NZE recorded using ultrasound imaging of the tongue and speech audio.
4.1 Participants
The majority of participants in this study were recorded at the 2016 Museum of Transport and Technology (MOTAT) science street fair for children in Auckland (North Island), where the first author was demonstrating the application of ultrasound imaging for speech research on behalf of the New Zealand Institute of Language Brain and Behaviour (NZILBB); the remaining data were collected at the 2016 New Zealand Careers Expo in Christchurch and at an ultrasound demonstration at the University of Canterbury. Visitors at the various events either reacted to a large sign advertising the opportunity to participate in a research project or were approached directly by the investigator once they showed interest in the ultrasound display. At the main event in Auckland, 25 participants under the age of 18 years, including 12 children younger than 10 years, participated in the study. Altogether 63 speakers were recorded; however, one of the datasets was not analyzed due to the fact that this speaker did not produce any adult-like /ɹ/ tokens. In addition, three others’ recordings could not be processed by the AAA software, so the statistical comparisons involving the MCI values use data from 59 participants only. The data collection was approved by the University of Canterbury Human Ethics Committee.
4.2 Recording procedure
Once participants signaled their intent to participate in the study, they were asked to read through an information sheet (a child-appropriate version was on display and sufficient copies were available to be taken home), fill in a brief demographic survey, and fill in a consent form; underage participants were required to fill in an assent form with parents granting consent. The investigator then briefly explained the use of the ultrasound setup to them (if they had not tried it before) and asked them to hold the transducer in place underneath the chin so he could optimize the ultrasound image. Participants were subsequently given a few seconds to familiarize themselves with the list of stimuli, and all children were asked whether they knew how to pronounce all the words on the list. If this was not the case, the investigator (and in many cases also a parent) would quickly go through the list with them. Nonetheless, in a limited number of cases, it happened that the investigator (or a parent) had to provide pronunciation help during the recording.
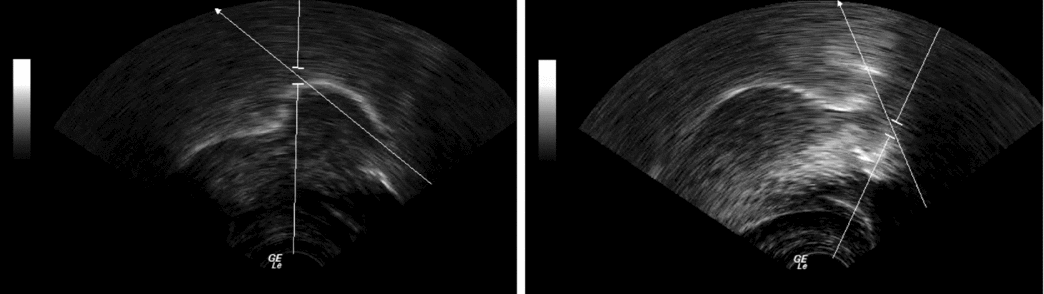
During the actual ultrasound recording, the investigator held a shotgun microphone close to the participant's mouth while they usually held ultrasound transducer and stimuli sheet themselves; parents often assisted their children. Note that the nature of the data collection and the brevity of the recordings (less than 30 seconds) ruled out the use of head stabilization. This also meant that the ultrasound images could potentially rotate off the midsagittal plane, so we used experienced multi-rater categorization to ensure only suitably midsagittal tokens were included in the study, as described in the data analysis section. A GE Healthcare Logiq e (version 11) ultrasound machine with an 8C-RS wide-band microconvex array 4.0–10 MHz transducer was used to record midsagittal images of the tongue via an Epiphan VGA2USB pro USB frame grabber. Audio was recorded through a Sound Devices LLC USB Pre 2 microphone amplifier; the microphone was a Sennheiser MKH 416. Both USB devices were connected to a 2015 HP Spectre Ultrabook and data were written to the hard drive using the FFmpeg command line utility (FFmpeg 2015) running in Windows 10; video was encoded in x264 using the avi container while audio was encoded as uncompressed (wav) 44.1 kHz mono. Video frame rates varied between 58 and 60 Hz and were encoded in a progressive scan yuv420p pixel format at 1024 × 768 pixels. Figure 2 shows example ultrasound frames of two different adult speakers producing a bunched /ɹ/ gesture in the word ‘eerie’ and a retroflex /ɹ/ gesture in the word ‘aura’.
Example ultrasound frames from two different adult speakers, facing right, producing a bunched /ɹ/ gesture in the word ‘eerie’ (left) and a retroflex /ɹ/ gesture in the word ‘aura’ (right). The superimposed lines, specifically the arrow, indicate the plane of data collection for a feature called anatomical m-mode that we removed from the images, and hence are irrelevant for the purpose of this paper.

4.3 Stimuli
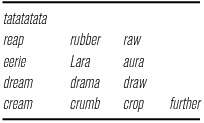
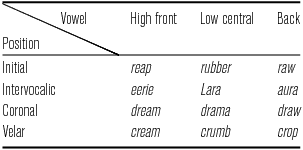
The participants were asked to read once, without repetition, through a list of 13 words containing tokens of /ɹ/ in various pre-vocalic environments, provided in Table 1. The different environments consisted of initial and intervocalic position, following coronal and velar consonants, and high front, low central, and back vowels (/ʉː/ in NZE is almost a front vowel, leaving /oː/ as the highest back vowel; Heyne, Derrick & Hay Reference Heyne, Derrick and Hay2015). A list was printed in the same order on a laminated sheet of A4 (landscape – Arial, 32pt); no directions were given whether the list was to be read down or across, although most participants chose to read across. The initial ‘tatatatata’ was included to allow audio–video alignment (see Table 1), while the final ‘further’ was added to collect limited information on participants’ rhoticity.
List of stimuli.

In a very small number of cases (eight tokens overall), participants mispronounced words, such as Lara being articulated as Laura or cream being pronounced as scream; we nonetheless assigned these tokens to the originally intended vowel category (Laura still containing a low vowel, albeit a diphthong /æʉ/ rather than a monophthong /ɐː/) and our results did not change when excluding them so we kept them in the statistical models.
4.4 Data analysis
4.4.1 Pre-processing
Prior to analysis proper, all recordings were pre-processed to correct for slight misalignments of the video and audio tracks. The /ta/ syllables at the beginning of each recording (some participants produced fewer or more than five syllables) were used to determine the time difference between the video and audio streams by identifying the moment when the tongue first starts dropping down from its place of articulation, and a sharp rise in the audio waveform marking the onset of the alveolar consonant (Miller & Finch Reference Miller and Finch2011). These measurements were carried out in ELAN (Wittenburg et al. Reference Wittenburg, Brugman, Russel, Klassmann and Sloetjes2006), yielding misalignments of 30–90 milliseconds. We then used Praat (Boersma & Weenink Reference Boersma and Weenink2014) to correct for the offset by adding silence at the beginning of the corresponding audio tracks spliced off the original video files; this means that timestamps identified on the basis of the audio signal can be used to directly identify the corresponding ultrasound images in the video files.
The second step of data preparation was to automatically segment the speech signal using the HTK toolkit (Young et al. Reference Young, Evermann, Gales, Hain, Kershaw, Liu, Moore, Odell, Ollason and Povey2006) via its implementation in LaBB-CAT (Fromont & Hay Reference Fromont, Hay, Cook and Nowson2012). Time-aligned segmentations were exported as Praat Textgrids (Boersma & Weenink Reference Boersma and Weenink2014) and manually checked for the correct alignment of the acoustic duration of the /ɹ/ gestures using the formant-tracking function, with special attention paid to the characteristic lowering of the third formant; note, however, that this was sometimes impossible due to insufficient audio quality. From the outset, our study was designed to focus primarily on the articulation of approximant /ɹ/ as it was clear that the quality of the recorded audio data would be variable due to the circumstances of the data collection; we furthermore reduced the impact of potentially including inappropriate ultrasound frames (on the basis of audio segmentation) by performing articulatory averaging across multiple frames within the estimated acoustic duration of /ɹ/ gestures (see Section 4.4.4 below).
As we could not be sure that all child participants’ productions were adult-like tokens of /ɹ/ in NZE, we set up an auditory rating task in Praat (Boersma & Weenink Reference Boersma and Weenink2014, ‘ExperimentMFC’) that was completed by two professional speech pathologists whose native language was NZE. All tokens produced by participants under the age of ten were included in this task, yielding 139 productions of /ɹ/ to be rated as either ‘adult-like’ or ‘non–adult-like’; a third option was to select ‘not sure’. Prior research has shown that /ɹ/ is usually mastered by age six (e.g. Smit et al. Reference Smit, Hand, Freilinger, Bernthal and Bird1990, Dodd et al. Reference Dodd, Holm, Hua and Crosbie2003, Maclagan & Buckley Reference Maclagan and Buckley2016), although this of course does not apply to children with developmental deficits.
These ratings yielded agreement on 83.5 percent of tokens; in cases where there was disagreement, a third rater who is a professional phonetician and native speaker of North-American English was used for disambiguation. 33 tokens either unambiguously rated as ‘non–adult-like’ by the two speech pathologists or in the majority including the third rater were eliminated from the dataset. Tokens that received two ‘not sure’ ratings were decided by the third vote; all tokens rated as ‘adult-like’ in the majority were kept.
4.4.2 Tongue contour tracing
Midsagittal tongue contours were semi-automatically traced throughout the full length of each video using the ‘batch processing’ tool of the AAA software (Articulate Instruments Ltd. 2012). This process was manually monitored and corrected at regular intervals. The AAA software overlays a concentric grid of 42 fan lines onto the ultrasound video with a virtual origin (Lawson, Scobbie & Stuart-Smith Reference Lawson, Scobbie and Stuart-Smith2013; see also Heyne & Derrick Reference Heyne and Derrick2015). However, scan-depth differences resulting from differences in the size of participants’ oral cavities necessitated a manual solution to cut off the wiggly ends of traces, as detailed in Section 4.4.4. Since we were only interested in the tongue shape during the acoustic duration of each /ɹ/ gesture, we used the R software environment (R Core Team 2015) to identify the traces that occurred during each /ɹ/ gesture on the basis of the time stamps encoded in our Praat Textgrids. Semi-automatic tracing failed for three participants’ datasets, most likely due to memory limitations of the AAA software; as a result, MCI comparisons presented below are based on 59 of the participants only.
4.4.3 Categorization of /ɹ/ gestures based on Delattre & Freeman's (Reference Delattre and Freeman1968) typology
Inconsistency of transducer placement across participants, along with the curvedness of traces at the edges, necessitated categorization on the basis of dynamic data. Praat Textgrids, created during data pre-processing to bring up the relevant video frames, were imported into ELAN (Wittenburg et al. Reference Wittenburg, Brugman, Russel, Klassmann and Sloetjes2006) in order to isolate /ɹ/ gestures. This allowed the raters to take all the information contained in the ultrasound images into account, including the movement of the tongue root, body, and tip (see Mielke et al. (Reference Mielke, Baker and Archangeli2016: 112), who report that it was ‘crucial’ to inspect the preceding and following ultrasound frames to analyze ‘many speakers’ productions’).
The first and third authors assigned the labels tip-up or tip-down to each /ɹ/ tongue gesture, further subdividing these into one of four tongue shape types determined by Delattre & Freeman (Reference Delattre and Freeman1968) to occur in rhotic varieties of English; 3 and 4 for tip-down, and 6 and 7 for tip-up. Across 749 tokens, they agreed in terms of type (and thus also tip-up versus tip-down placement) for 581 tokens (77.6%), while disagreeing on only 55 tokens (7.3%) in terms of the tongue tip-up versus tip-down ratings; conversely, this means that for 113 tokens (15%) there was agreement in terms of tip-up/tip-down ratings but not specific tongue shape type. We used the fourth author to resolve all disagreement (including ratings where the first two raters only differed in terms of shape classifications) to arrive at the final ratings reported in the remainder of the paper.
4.4.4 Quantifying tongue shape curvature
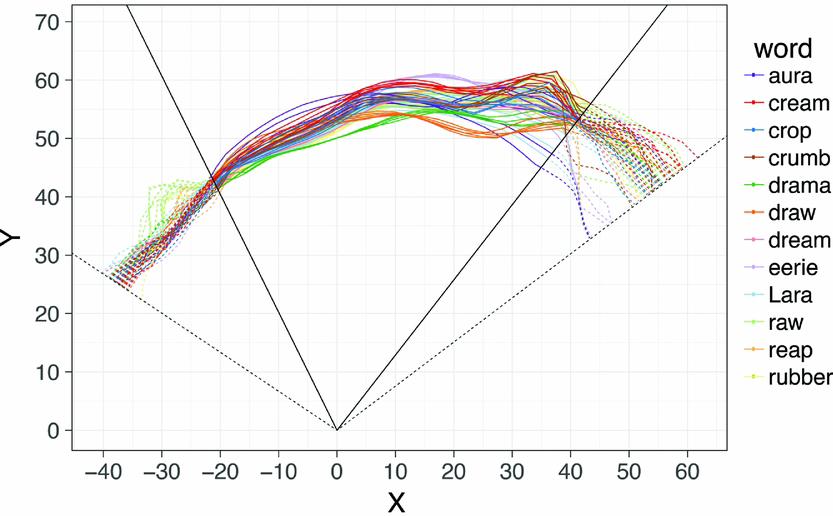
As mentioned above, the ends of tongue traces are highly inaccurate due to the fact that ultrasound images of the tongue surface become faint at the edges. Our solution was to cut off the highly variable end portions of the traces, allowing us to keep confidence intervals small enough throughout the full trace length to obtain meaningful results when performing MCI measurements. To do so, the first author of the paper transformed all tongue contour coordinates into polar coordinates using the virtual origin estimated from the ultrasound images (Heyne & Derrick Reference Heyne and Derrick2015) and plotted them separately for each participant; since the acoustic duration of /ɹ/ gestures included anywhere from two to 12 individual tongue traces, depending on acoustical duration, and each participant produced up to 13 analyzable tokens of /ɹ/, these plots included up to 100 traces. We then overlaid each trace with a fan angle between the most extreme edges of all the traces and visually estimated where the lines began to diverge or ‘flare out’, as seen in Figure 3. This location coincides quite well with individual traces becoming more different as the algorithm used by the AAA software struggled to determine an appropriate fit on adjacent ultrasound frames. Visual estimation was greatly aided by the fact that we investigated a sufficiently large number of tokens (a minimum of 31 individual ultrasound traces per participant); as a result, our MCI values fall within the range reported in an earlier study (Dawson et al. Reference Dawson, Tiede and Whalen2016; c. 1.5–6 for 15 different phoneme types). Note that AAA includes an export tool which should allow for the export of spline coordinates thresholded by their confidence value (referring to an algorithm-based error measure which is in turn based on the brightness of the image); however, this mode of export failed, possibly due to computational memory limitations. In the final step, points falling outside the hypothetical fan lines (solid fan lines in Figure 3) were eliminated by subtracting/adding the estimated angle from the most extreme Theta value (the angle measurement of each polar coordinate pairing) at both edges of each trace and removing all points falling within this range (dashed parts of traces in Figure 3).
Collected ultrasound traces by an adult speaker who produced tip-up /ɹ/ (specifically, type 7) in all contexts. The meeting point of the fan lines at the bottom of the graph indicates the estimated ultrasound transducer position; the scale is arbitrary and was set by the AAA software. The dashed trace lines indicate where traces were cut off prior to calculating MCI values, while the dashed fan lines illustrate the radial field of view in the original ultrasound images.

While this process necessarily led to individual tongue gestures being represented by different radial fields of view, the same is not necessarily true regarding the length of tongue surface forming the basis of the MCI calculations detailed below. We also readily admit that the fact that we did not make use of head stabilization (see reasons provided in Section 4.2) introduces the possibility of study participants altering the position of the ultrasound transducer during recordings, affecting the field of view accordingly; as far as we know, there currently exists no way of addressing this issue without introducing additional variability or uncertainty. Note that we would have faced the same problem if we had used AAA's export tool with a specified confidence value as the radial field likewise may have been different even for each single tongue trace. Since ultrasound imaging of the tongue does not provide any anatomical landmarks and part of the tongue surface can be obscured due to air pockets forming underneath the tongue (especially at the tongue tip – Stone Reference Stone2005, Heyne & Derrick Reference Heyne and Derrick2015), researchers can never be sure which parts, and how much, of the tongue surface they are analyzing. Altering an ultrasound machine's scan depth setting, however, can be applied to help ensure that roughly the same parts of the tongue are represented in ultrasound images even for participants with vastly different vocal tract dimensions; by zooming into the tongue image of a participant with a small tongue, the number of pixels representing the tongue surface on the ultrasound machine screen can be increased to match those resulting from imaging a larger vocal tract, thereby ensuring the same amount of detail in the images recorded on external computer and used for subsequent analysis.
We then used Moerman's (Reference Moerman2014) {linear} interp_polar function in MATLAB (MathWorks Inc. 2016) to increase the number of points for each trace to 37 as Dawson's MCI script (Reference Dawson2017) requires at least 18 points to calculate an MCI value. As a final step, we calculated MCI values for each trace on the basis of the whole tongue contour using the 37 equally-spaced points resulting from polar interpolation, as well as separate MCI values for the front and back halves of each tongue contour by using the 18 left-most or 18 right-most coordinates; note that the midpoint of the interpolated traces was not used for the latter calculations. Since every /ɹ/ gesture (operationalized by its acoustic duration) contained at least two traces derived from separate ultrasound frames, we averaged the MCI values for each /ɹ/ gesture; as a result, each /ɹ/ gesture was assigned three (average) MCI values, one for the whole tongue shape, one for the front, and one for the back of the tongue.
5 Results
5.1 Social and linguistic distribution of tip-up/tip-down /ɹ/
In this section, we explore the social and linguistic constraints operating on the articulation of /ɹ/ using the categorical coding based on Delattre & Freeman (Reference Delattre and Freeman1968). Prior to model fitting, all tokens produced by children coded as ‘non–adult-like’ and tokens with bad images were removed, leaving us with a dataset of 716 tokens from 62 speakers, some of whom only produced a few adult-like pronunciations.
5.1.1 Statistical model including all speakers
First, we explored the factors influencing tip-up versus tip-down /ɹ/ as a binary variable. All tokens were fitted into logistic mixed effects model using the lme4 package in R (Bates et al. Reference Bates, Mächler, Bolker and Walker2015, R Core Team 2015). The model was hand-fit using a backward stepwise elimination, and model selection was guided by the Akaike Information Criterion (Akaike Reference Akaike1974). The dependent variable was the tip-up versus tip-down binary coding. Speakers’ age, sex, and New Zealand region of residence were tested as social predictors. For the linguistic factors, all tested words were classified according to the position of /ɹ/ and/or the preceding consonant, and the quality of the preceding and following vowels (see Table 2), so the effects of position and vowel were also tested in the model. Note that, although most participants produced close-mid vowels when uttering the words raw, aura, and draw, productions for crop were mostly open-mid and we thus decided not to include any reference to vowel height in assigning the ‘back’ label to this group of words. Interactions between these social and linguistic factors were also tested (all possible three-way and two-way interactions were tested); each model has random intercepts for word and speaker. When the linguistic predictors (vowel and/or position) were included in the fixed effects, they were also included as random slopes for speaker.
Classification of words in the wordlist according to vowel quality and /ɹ/ position.

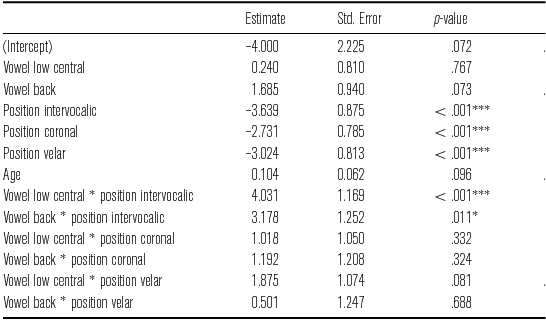
The best-fit model, as shown in (1) below, has fixed effects for age and an interaction between position and vowel; random effects were included for speaker and word as intercepts, and vowel by speaker as a slope. The outcome of the best-fit model is shown in Table 3.
(1) up.down ∼ position * vowel + age + (1 + vowel | speaker) + (1 | word)
Outcome of the best model testing /ɹ/ shape constraints in the whole data set.

α = .1, * α = .05, ** α = .001, *** α < .001
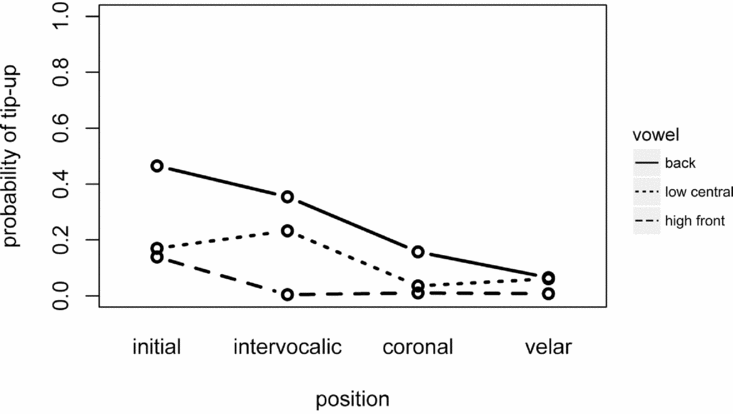
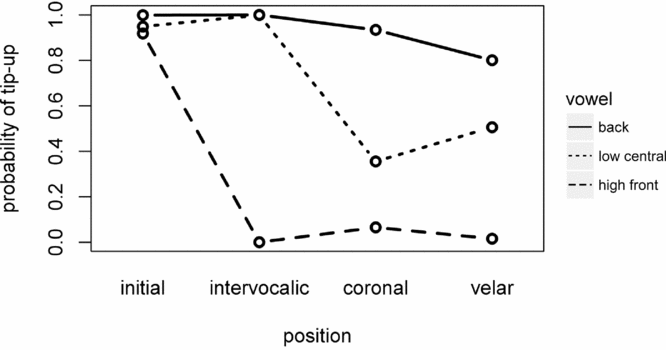
The plot of the interaction between position and vowel is shown in Figure 4. The y-axis shows the probability of using a tip-up gesture. The x-axis shows the four types of environment and position of /ɹ/ within words, and the three lines represent the three different vowel environments.
Plot of the interaction between position and vowel in the whole dataset in model (1).

The vowel effects showed similar patterns across all environments. /ɹ/ in back vowel contexts was the most likely to be tongue tip-up, followed by the low central and high front vowel environments. This result is consistent with previous findings on AE (Ong & Stone Reference Ong and Stone1998, Tiede et al. Reference Tiede, Boyce, Espy-Wilson, Gracco, Maassen and van Lieshout2011, Mielke et al. Reference Mielke, Baker and Archangeli2016). The effects of context and word position on retroflexion rate are more complicated, showing slightly different patterns across the three vowel environments. In high front vowel contexts, /ɹ/ in initial position is significantly more likely to be realized as tip-up compared to the other three contexts. However, when /ɹ/ is flanked by low central vowels, the intervocalic position favors tip-up more, followed by initial, velar, and coronal positions. In the back vowel context, the initial position has a yet higher probability of being realized as a tip-up gesture, and the retroflexion rate reduces for the intervocalic, coronal and velar positions, respectively. Note, that while we assume these patterns to be governed by phonetic context, the fact that we only collected a single item for each context gives rise to an alternative explanation whereby the patterns could be word-specific and possibly influenced by word-frequency effects.
5.1.2 Variable participants only
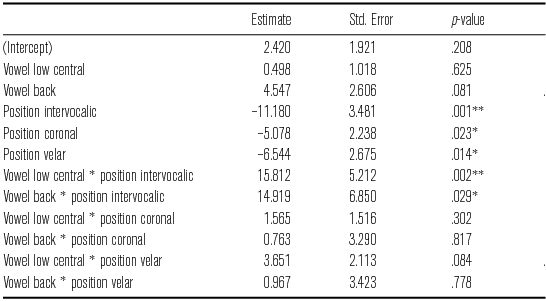
Of the 62 speakers tested in the full model, 37 did not display any variation in their tip-up and tip-down production; that is, 25 consistently used tip-down /ɹ/, and 12 consistently used tip-up /ɹ/. Since this could be a factor distorting our results, we ran the same analysis again on the subset of the 25 speakers who varied in their use of the different /ɹ/ gestures. A total of 297 tokens from these variable speakers were fitted into a logistic mixed effects model in R. After backward stepwise model comparison along the Akaike Information Criterion, the best model found was similar to that of the full dataset, with an interaction between position and vowel, as shown in (2).
(2) up.down ∼ position * vowel + (1 + position | speaker) + (1 | word)
There was no age effect for this dataset, confirming our earlier suspicions that the age effect in the full dataset could be due to a larger number of younger speakers using tip-down /ɹ/ exclusively. For random effects, the model included speaker and word as random intercepts, as well as by-speaker random slope for position. The outcome of the best-fit model is shown in Table 4, and the plot of the interaction between the consonantal and vowel contexts is presented in Figure 5. The general trends of the effects were almost the same as for the full dataset results.
Outcome of the best model testing /ɹ/ shape constraints in the subset of speakers who vary in their use of different /ɹ/ gestures.

α = .1, * α = .05, ** α = .001, *** α < .001
Plot of the interaction between position and vowel in the subset of the variable speakers in model (2).

In the following section, we explore positional and vocalic effects on the categories defined by Delattre & Freeman (Reference Delattre and Freeman1968).
5.2 Exploring the social and linguistic distribution of different /ɹ/ gestures according to Delattre & Freeman (Reference Delattre and Freeman1968)
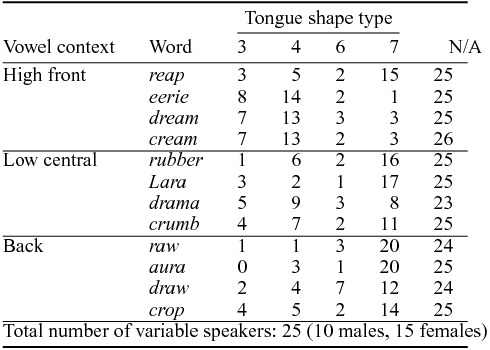
Here, we explore the social and linguistic factors operating on the four-level categorical /ɹ/ classification. For the modeling, as the dependent variable /ɹ/ shape type was a four-level nominal variable, we fitted a multinomial logistic regression model using the multinom() function from the nnet package in R (R Core Team 2015, Ripley & Venables Reference Ripley and Venables2016). Again, we conducted separate analyses for the full and reduced datasets of variable speakers, but the results were very similar, so we only report the results from the variable speakers’ subset; token counts for the reduced dataset are shown in Table 5.
Token counts for the reduced data set including only the variable speakers.

The best model was again found by eliminating non-significant factors in a backward stepwise manner. In the best model, vowel and positional context were still found to be significant predictors for /ɹ/ shape classification. The p-values of the predictors in the best model is presented in Table 6, and the plots for the main effects are shown in Figure 6.
The p-values of multinomial regression model for /ɹ/ shape type classification.

α = .1, * α = .05, ** α = .001, *** α < .001
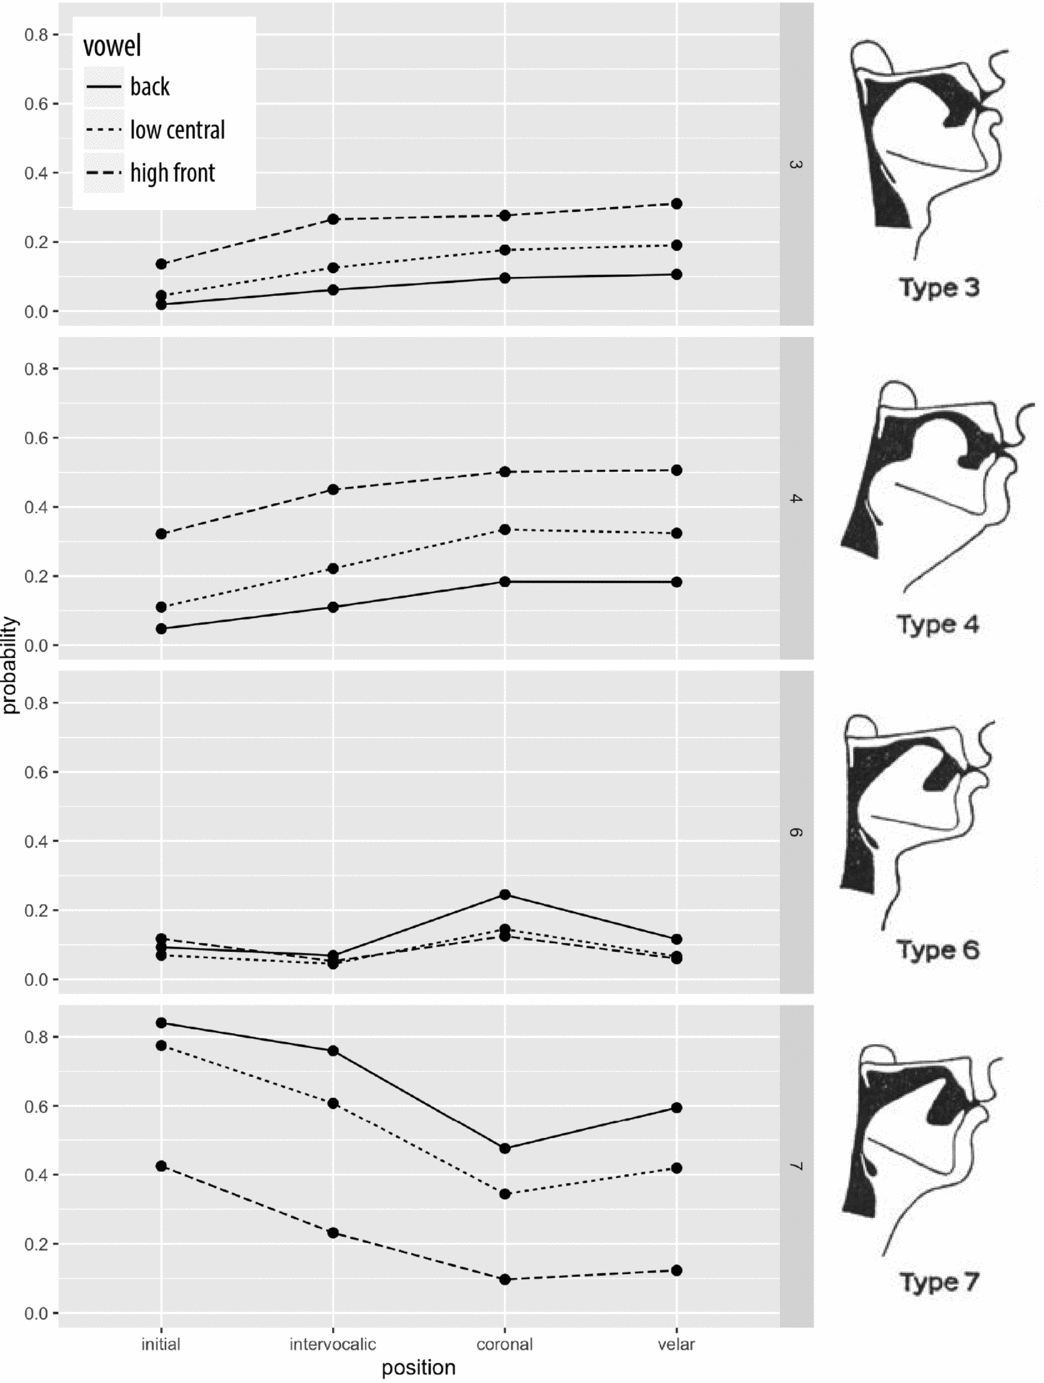
Plots of the effects for vowel and position on /ɹ/ shape type. Delattre & Freeman's (Reference Delattre and Freeman1968) types in the right-hand column were adapted from their original taxonomy (p. 41) by flipping the images to be rightward facing.

In Figure 6, for each /ɹ/ shape type, the y-axes show the probabilities of /ɹ/ being realized as types 3, 4, 6, and 7 respectively. Similarly, the x-axes indicate the four positional environments for each /ɹ/ shape type, while the three vowel contexts are represented by different line styles. Types 3 and 4 were found to have very similar patterns in terms of the vowel and position effects. In terms of vowel effects, /ɹ/ in high front vowel contexts was more likely to be produced as type 3 or 4, while back vowels represent the least likely environment for these gestures. Effects of positional contexts showed that types 3 and 4 were favored more in velar and coronal contexts, followed by intervocalic and initial positions. These results are consistent with the binary coding analysis, since types 3 and 4 are both classified as bunched /ɹ/ gestures. Results for types 6 and 7 are shown in the bottom two plots in Figure 6. The vowel effects were just the opposite of types 3 and 4, with the back vowel context serving as the most favorable environment, which was expected since types 6 and 7 are retroflexed /ɹ/ gestures. However, when it came to the positional contexts, the patterns for types 6 and 7 were found to be different. Type 7 patterned with initial and intervocalic /ɹ/ as the favorable environment, contrary to the pattern observed for bunched /ɹ/ gestures (types 3 and 4). Type 6 differed from type 7 in that it was more likely to appear after coronals than in any of the other contexts.
5.3 Verification of coding for tongue shape types
In Section 4.4.4, we quantified all the /ɹ/ shape types by giving each gesture an average MCI value to measure their curvature complexity. In this section, we explore how these MCI values are correlated with our manual coding of the /ɹ/ shapes, to see whether the visual coding could be verified by calculating the curvature complexity of the traces. As we mentioned previously, the MCI values for each tongue contour were calculated for the whole tongue shape, the front half, and the back half of the tongue, respectively. Therefore, when verifying the perceptual coding through statistical analysis, the whole-tongue, the front, and the back MCI values were all tested in separate models. Contrary to our assumptions outlined earlier, however, the front and back MCI results did not yield better results than the whole-tongue MCI, so we only report the results for the whole-tongue MCI values in this section; they will be referred to as (average) MCI values from here on. Recall that semi-automatic contour tracing failed for three participants’ datasets; furthermore, one participant produced only non–adult-like tokens, meaning that the data presented in this section are based on a total of 59 participants only.
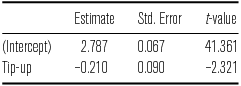
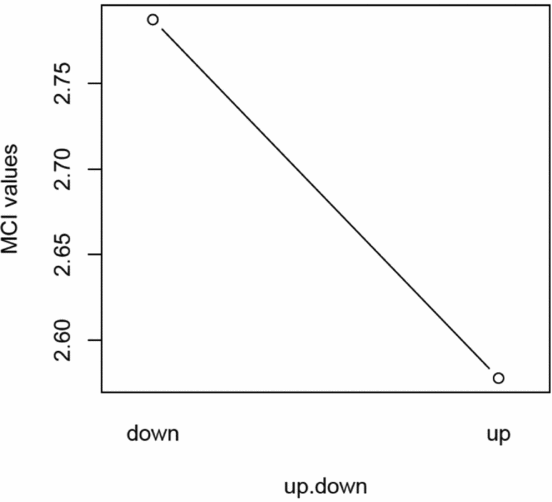
First, a linear mixed effects model, as shown below in (3), was fit to investigate the correlation between the MCI values and the tip-up versus tip-down binary coding; subject and word were included as random intercepts, as well as by speaker and by word slopes for the up/down binary coding. The outcome of this model is shown in Table 7, and the corresponding plot is presented in Figure 7. The result showed that the MCI values were significantly correlated with the perceptual binary coding (t = 2.32). Tokens with higher MCI values were significantly more likely to be coded as tip-down.
(3) Avg.MCI ∼ up.down + (1 + up.down | speaker) + (1 + up.down | word)
Outcome of the model to verify tip-up and tip-down perceptual coding using the MCI values.

Plot of the correlation between MCI values and tip-up/tip-down coding in model (3).

Then, a similar mixed effects model was run with the tongue shape type ratings based on Delattre & Freeman's (Reference Delattre and Freeman1968) seminal paper as the independent variable, as shown in (4).
(4) Avg.MCI ∼ up.down + (1 + up.down | speaker) + (1 + up.down | word)
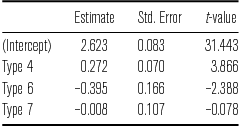
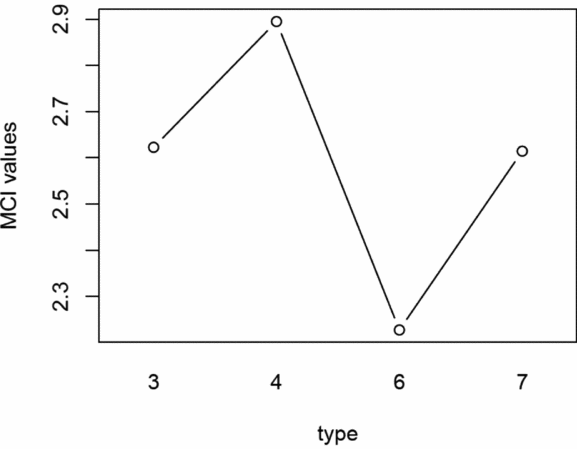
Again, subject and word were included as random intercepts, as well as by speaker and by word slopes for the various tongue shape types. The result showed that the four-category coding was also significantly correlated with the MCI values (see Table 8). The pattern of the four categories is presented in Figure 8. The x-axis has the four types of /ɹ/ shape types from Delattre & Freeman (Reference Delattre and Freeman1968) that we made use of in our ratings: types 3, 4, 6, and 7, while the y-axis still shows the MCI values. The pattern showed that type 3 obtained significantly lower MCI values than type 4 (t = 3.866), and significantly higher MCI values than type 6 (t = 2.388). Types 3 and 7, however, did not show a significant difference. The model was also relevelled to check the significance of each category, and type 6 was found to have significantly lower MCI values than types 3 (t = 2.388), 4 (t = 3.98) and 7 (t = 2.039); type 7 also had significantly lower MCI values than type 4 (t = 2.78). That is to say, except in the case of types 3 and 7, all four categories obtained significantly different MCI values, indicating that the MCI values could clearly distinguish the four types and thus can be used as a good criterion for classifying approximant /ɹ/ gestures. These findings were also consistent with the result from the binary coding; types 3 and 4, which were classified as bunched shapes, tended to have higher MCI values than types 6 and 7 (retroflex shapes).
Outcome of the model to verify tongue shape type classifications based on Delattre & Freeman (Reference Delattre and Freeman1968), using the MCI values.

Plot of the correlation between MCI values and the categorical /ɹ/ shape classification manual coding.

6 Discussion and conclusion
Overall, the allophonic variation patterns of NZE consonantal /ɹ/ do not vary much from those observed for AE. Hypothesis 1 is strongly supported: Among NZE speakers who produced only one /ɹ/ variant, more (25) were tip-down /ɹ/, as compared to tip-up /ɹ/ (12). However, the observed number of speakers using r tip-up /ɹ/ exclusively was up to three times higher than in Mielke et al.’s (Reference Mielke, Baker and Archangeli2016) study on AE. Since these authors found very low retroflexion rates in postvocalic contexts among their variable speakers (p. 115), we speculate that a possible dialect difference might be due to the fact that most NZE speakers do not ever produce /ɹ/s in postvocalic environments (which heavily favor tongue bunching) and thus are less likely to acquire tip-down /ɹ/ as an alternative articulation strategy if they have already mastered tip-up /ɹ/ (see also our points concerning acquisition below).
We also found a somewhat larger ratio of speakers demonstrating categorical variability in /ɹ/ production than in Mielke et al.’s (Reference Mielke, Baker and Archangeli2016) study, meaning that conversely, there were less speakers who used tip-down /ɹ/ exclusively; this could possibly be due to the same reasons outlined above but nonetheless supporting hypothesis 2. For those who demonstrated variability, their patterns of allophony matched up quite well with those observed for AE. As with AE, NZE speakers produced tip-up /ɹ/ more often when the rhotic preceded a back vowel than when it preceded a high front vowel, supporting hypothesis 3. In NZE, /ɹ/ variability adjacent to low central vowels fit between that of front and back vowels. These vocalic adjacency trends further support Stavness et al.’s (Reference Stavness, Gick, Derrick and Fels2012) theory of mechanical articulatory influence on /ɹ/ allophony. Additionally, as with AE, NZE speakers produced tip-up /ɹ/ most often in word-initial position, followed by intervocalic, then coronal, and least often in velar contexts, supporting hypothesis 4.
No clear evidence emerged regarding hypothesis 5. We did not find any differences regarding bunched vs. retroflex /ɹ/ when calculating separate MCI values for the front and back of the tongue, even though we do not interpret this result to show that these gestures do not differ in the nature of their pharyngeal constriction. It is likely that such differences can only be determined with a technique that can measure the actual size of constriction rather than just the position of the tongue surface.
Our study showed that the intervocalic environment, which has not received much attention in previous research, patterns between word initial and coronal-adjacent /ɹ/. Consonantal and vocalic influences on tip up vs. tip down /ɹ/ allophony appear to be straightforward except for that of the low central intervocalic context. In terms of the categorization according to Delattre & Freeman (Reference Delattre and Freeman1968), the biggest anomaly was in the higher-than-expected type 6 production for /ɹ/ adjacent to coronal consonants. While the classic paper describes this type as resulting from ‘a general tendency’ (by speakers predominantly using bunched gestures) to front the tongue in prevocalic position (Delattre & Freeman Reference Delattre and Freeman1968: 44) and occurring most often in ‘strong syllabic position’ (p. 67), Westbury, Hashi & Lindstrom (Reference Westbury, Hashi and Lindstrom1998: 223) found that the alveolar context (in the word ‘street’ in their dataset) seemed to ‘constrain speakers’ /ɹ/ shapes noticeably more than other contexts’ (/ɹ/ occurring in initial position, and following velars and bilabials). In our NZE dataset, there were twice as many occurrences of type 6 in the articulation of the word ‘draw’ than in any other context, suggesting that a coronal consonant preceding /ɹ/ which is followed by a back vowel might represent the environment most conducive to type 6 articulations; a (mid-close) back vowel requires raising the back of the tongue while a coronal consonant requires raising the tongue tip – type 6 makes use of parts of both gestures.
A possible explanation for the pronounced rise in the probability for tip-up /ɹ/ preceding the low central vowel observed for the full dataset (Figure 3), but also exhibited less clearly by the variable speakers (Figure 4) from the initial to intervocalic environments, may arise from the fact that most speakers in our study can be expected to assume a language-specific speech-readiness or interspeech posture (ISP; Gick et al. Reference Gick, Wilson, Koch and Cook2004, Wilson & Gick Reference Wilson and Gick2014) that is higher than a low central vowel tongue position (Gick et al. Reference Gick, Wilson, Koch and Cook2004), meaning that producing a tip-up /ɹ/ gesture would require a larger biomechanical effort in the initial than intervocalic environment. While one might advance the objection that is also well-known that speakers often press the front of their tongues against the hard palate between utterances, especially in laboratory environments (e.g. Wilson Reference Wilson2006: 23), we believe that speakers almost never commence speaking from this position but usually momentarily release to a tongue position without coronal contact that may or may not be identical to a speaker's ISP. The frequent occurrence of tip-up /ɹ/ in initial position would seem to be at odds with the tongue resting against the palate just prior to those productions. However, ISPs may vary across speaking style, as shown by Ramanarayanan et al. (Reference Ramanarayanan, Goldstein, Byrd and Narayanan2013) using Magnetic Resonance Imaging (MRI) data. We also know from Stavness et al. (Reference Stavness, Gick, Derrick and Fels2012) that retroflexion (canonical tongue shape type 7) can be achieved using at least two different muscle activation patterns, namely primary superior longitudinal activation, and alternatively by the activation of the hyoglossus and the relaxation of the anterior genioglossus muscles. Finally, it may be that simulations can also uncover an alternative technique for bunching, given the difference in magnitude of the patterns affecting tongue shape types 3 and 4 – this would be a topic for future research.
In addition, the results of the linear models presented above show that our binary tip-up versus tip-down rating and the categorical ratings using four of Delattre & Freeman's (Reference Delattre and Freeman1968) /ɹ/ shape types were both significantly correlated with the average MCI values for the articulatory traces, indicating that our manual coding was justified and that MCI values can be used in future research as an additional classification tool for different types of approximant /ɹ/.
These results support theories of modular speech motor control with articulation strategies evolving from local rather than global optimization processes. Even though numerous studies have posited that an optimal solution should exist for any given motor task (Friston Reference Friston2011) implying that any individual can arrive at this solution with sufficient training, recent empirical evidence from Ganesh et al. (Reference Ganesh, Haruno, Kawato and Burdet2010) suggests that the search for optimality could be secondary in the context of motor planning. Discussing their results of muscle activations measuring during a complex motor task that required maintaining a certain position of the wrist while perturbed, the authors found that the observed behavior was ‘largely influenced by motor [or muscle] memory’, suggesting that ‘the CNS does not optimize coactivation tasks globally but determines the motor behavior in a tradeoff of motor memory, error, and effort minimization’ (Ganesh et al. Reference Ganesh, Haruno, Kawato and Burdet2010: 382). A similar argument has also been put forward by Loeb (Reference Loeb2012: 757), based on theoretical considerations; he describes local optimization processes as finding a ‘good-enough’ solution which does not involve the optimization of ‘a single, known cost function’. Any potential solution or stable state would be related to the ‘starting state and nature of the system’, with a cost function made up of ‘many peaks and valleys’, depending on the system's complexity (Loeb Reference Loeb2012: 758–759).
While several studies have shown that different sections of the tongue can be independently controlled during speech production (e.g. Miyawaki et al. Reference Miyawaki, Hirose, Ushijima and Sawashima1975, Harshman, Ladefoged & Goldstein Reference Harshman, Ladefoged and Goldstein1977, Stone, Epstein & Iskarous Reference Stone, Epstein and Iskarous2004), this fact cannot by itself explain the widespread articulatory variability observed in approximant /ɹ/ production strategies. Although differences in individual vocal tract morphology could mean that some speakers are simply unable to produce retroflex or bunched /ɹ/ gestures in certain contexts (even if they were applying global optimization to develop such an articulatory strategy), we believe this situation to rather be a consequence of local optimization taking place during speech acquisition. Evidence comes from Magloughlin's (Reference Magloughlin2016) study on the acquisition of approximant /ɹ/ by American children, who argues that ‘an allophonic variation involving more than one tongue shape can arise when a child's initial (dominant) strategy is found to be effective in some but not all contexts’ (p. 65; see a similar argument in Mielke et al. Reference Mielke, Baker and Archangeli2016). The articulatory behavior of the three participants in her study with ongoing exploratory behavior regarding /ɹ/ productions ‘was more variable in contexts where they showed a production lag’, and she observed that ‘it is also possible for learners to develop a single strategy across all contexts, which may be more likely if the lag is in a context that is compatible with the dominant strategy’ used by a particular individual (Magloughlin Reference Magloughlin2016: 65–66). We interpret these observations as attempts to describe local optimization processes emanating from coarticulation preceding and (possibly) following /ɹ/ gestures. However, we agree with Magloughlin (Reference Magloughlin2016: 66) that such interpretation must be regarded as largely speculative until more acquisition data become available. Conceiving the acquisition of /ɹ/ gestures as a local rather than global optimization problem is furthermore consistent with the fact that a pair of possibly monozygotic twins in Magloughlin's study adopted different articulatory strategies, suggesting that development is non-deterministic (p. 66).
In summary, our results strongly support the mechanical model of rhotic variation set forth by Stavness et al. (Reference Stavness, Gick, Derrick and Fels2012). There may be cross-dialectical influences in relation to the relationship between /ɹ/ and coronal consonants, or there may be as yet unknown mechanical influences. The binary tip-up vs. tip-down coding, the four-category classification according to Delattre & Freeman (Reference Delattre and Freeman1968), and the average MCI values all confirm that the realization of prevocalic approximant /ɹ/ in NZE follows a similar linguistic distribution as in AE, lending strong support to the mechanical articulatory model of /ɹ/ allophony, and supporting the use of categorical descriptions for /ɹ/ analysis from large numbers of speakers.
Acknowledgements
We would like to thank the New Zealand Institute of Language Brain and Behaviour's Language Variation and Change Theme for financial support; the Museum of Transport and Technology (MOTAT) in Auckland for allowing us to collect participant data at their 2016 Science Street Fair; Jim Scobbie and Jane Stuart-Smith for mentioning the idea of a large-scale study on the articulation of /ɹ/; Jen Hay and our anonymous reviewers for valuable feedback leading to a significantly improved paper, and, most importantly, all the participants who provided their data in Auckland and Christchurch.